Download presentation
Presentation is loading. Please wait.

1
Estimating Ecosystem Model Uncertainties in Pan-Regional Syntheses and Climate Change Impacts on Coastal Domains of the North Pacific Ocean Jerome Fiechter Andrew M. Moore Ocean Science, UCSC Thomas M. “Zack” Powell Integrative Biology, Cal Christopher K. Wikle Mevin Hooten Statistics, U. Missouri Utah State Ralph F. Milliff Jeremiah Brown NWRA, CoRA Div. US GLOBEC PIs and Co-Is: Emanuele Di Lorenzo Earth Sci, Ga Tech L. Mark Berliner Statistics, Ohio State William G. Large NCAR, CGD Bernard Megrey NOAA, NMFS Project Advisory Panel: 3 rd US GLOBEC PRS Workshop, 17-20 Feb 2009, Boulder

2
1D relocatable BHM; Data Stage Inputs – Regional Obs, Regional ROMS output Process Model Stage – NPZD, NEMURO, Error Models, dynamics Climate Scale Calculations (1D BHM) Data Stage Inputs – Pac Boundary Ecosystem Climate Project (Di Lorenzo et al.) NCAR OGCM, ROMS-Pacific Basin 3D Coastal Domain BHM “Forest” of statistically-linked 1D BHM Conventional 3D Goals: Estimate ocean ecosystem model parameters, and quantify parameter uncertainty for coastal domains spanning the North Pacific Ocean Demonstrate the feasibility and advantages of Bayesian Hierarchical Models (BHM) for large state-space ocean ecosystems Quantify impacts of climate-scale variability on coastal ocean ecosystems Objectives:
 Data Stage Inputs – Pac Boundary Ecosystem Climate Project (Di Lorenzo et al.) NCAR OGCM, ROMS-Pacific Basin 3D Coastal Domain BHM Forest of statistically-linked 1D BHM Conventional 3D Goals: Estimate ocean ecosystem model parameters, and quantify parameter uncertainty for coastal domains spanning the North Pacific Ocean Demonstrate the feasibility and advantages of Bayesian Hierarchical Models (BHM) for large state-space ocean ecosystems Quantify impacts of climate-scale variability on coastal ocean ecosystems Objectives:")
3
Bayesian Estimation Cartoon: Model for Process of Interest: e.g. Phytoplankton Abundance mmolN m -3

4
Measurement Error Model: e.g. estimates based on fluorometer readings Bayesian Estimation Cartoon:

5
Posterior Distribution: Prior updated by Observation distribution (normalized) Bayesian Estimation Cartoon: mmolN m -3
 Bayesian Estimation Cartoon: mmolN m -3")
6
Process Model Stage Distribution “Prior”, “(approximate) Balance Eqns”, “Basis Functions”,... 1D and 3D NEMURO+Fe and NPZD+Fe discretizations plus error (test sophisticated error models) Parameter Distributions structured vs. vague some “random”, some “fixed”, model validation tool Posterior Distribution “posterior mean”, “spread quantifies uncertainty” estimate via sampling; e.g. Markov Chain Monte Carlo (MCMC) posterior distributions on parameters Bayes Theorem Data Stage Distribution “Likelihood” “Measurement Error Model” Station obs, transects, satellite obs; i.e. with error estimates ROMS-NEMURO+Fe output with error estimates What is a Bayesian Hierarchical Model (BHM)? Use hierarchies of distributions to facilitate modelling, multi-platform data,...
 Parameter Distributions structured vs. vague some random , some fixed , model validation tool Posterior Distribution posterior mean , spread quantifies uncertainty estimate via sampling; e.g. Markov Chain Monte Carlo (MCMC) posterior distributions on parameters Bayes Theorem Data Stage Distribution Likelihood Measurement Error Model Station obs, transects, satellite obs; i.e. with error estimates ROMS-NEMURO+Fe output with error estimates What is a Bayesian Hierarchical Model (BHM). Use hierarchies of distributions to facilitate modelling, multi-platform data,....")
7
WPAC CGOA CCS WPAC Data Stage Distribution “Likelihood” “Measurement Error Model” Station obs, transects, satellite obs; i.e. with error estimates ROMS-NEMURO+Fe output with error estimates

8
Process Model Stage Distribution “Prior”, “(approximate) Balance Eqns”, “Basis Functions”,... 1D and 3D NEMURO+Fe and NPZD+Fe discretizations plus error (test sophisticated error models) Parameter Distributions structured vs. vague some “random”, some “fixed”, model validation tool Posterior Distribution “posterior mean”, “spread quantifies uncertainty” estimate via sampling; e.g. Markov Chain Monte Carlo (MCMC) posterior distributions on parameters Bayes Theorem Data Stage Distribution “Likelihood” “Measurement Error Model” Station obs, transects, satellite obs; i.e. with error estimates ROMS-NEMURO+Fe output with error estimates What is a Bayesian Hierarchical Model (BHM)? Use hierarchies of distributions to facilitate modelling, multi-platform data,...
 Parameter Distributions structured vs. vague some random , some fixed , model validation tool Posterior Distribution posterior mean , spread quantifies uncertainty estimate via sampling; e.g. Markov Chain Monte Carlo (MCMC) posterior distributions on parameters Bayes Theorem Data Stage Distribution Likelihood Measurement Error Model Station obs, transects, satellite obs; i.e. with error estimates ROMS-NEMURO+Fe output with error estimates What is a Bayesian Hierarchical Model (BHM). Use hierarchies of distributions to facilitate modelling, multi-platform data,....")
9
Process Model Stage Distribution “Prior”, “(approximate) Balance Eqns”, “Basis Functions”,... 1D and 3D NEMURO+Fe and NPZD+Fe discretizations plus error (test sophisticated error models)
.")
10
Process Model Stage Distribution “Prior”, “(approximate) Balance Eqns”, “Basis Functions”,... 1D and 3D NEMURO+Fe and NPZD+Fe discretizations plus error (test sophisticated error models) Parameter Distributions structured vs. vague some “random”, some “fixed”, model validation tool Posterior Distribution “posterior mean”, “spread quantifies uncertainty” estimate via sampling; e.g. Markov Chain Monte Carlo (MCMC) posterior distributions on parameters Bayes Theorem Data Stage Distribution “Likelihood” “Measurement Error Model” Station obs, transects, satellite obs; i.e. with error estimates ROMS-NEMURO+Fe output with error estimates What is a Bayesian Hierarchical Model (BHM)? Use hierarchies of distributions to facilitate modelling, multi-platform data,...
 Parameter Distributions structured vs. vague some random , some fixed , model validation tool Posterior Distribution posterior mean , spread quantifies uncertainty estimate via sampling; e.g. Markov Chain Monte Carlo (MCMC) posterior distributions on parameters Bayes Theorem Data Stage Distribution Likelihood Measurement Error Model Station obs, transects, satellite obs; i.e. with error estimates ROMS-NEMURO+Fe output with error estimates What is a Bayesian Hierarchical Model (BHM). Use hierarchies of distributions to facilitate modelling, multi-platform data,....")
11
Parameter Distributions structured vs. vague some “random”, some “fixed”, model validation tool AttSW Vm_NO3 PhyMRD ZooGR ZooMRD DetRR wDet T_Fe FeRR K_NO3 K_FeC Unif (0.04,0.4) Unif (0.2,2.0) Unif (0.02,0.2) Unif (0.1,1.0) Unif (0.02,0.2) Unif (0.1,1.0) Unif (0,50) Unif (1,10) Unif (0.1,1.0) Unif (0.3,3.0) Unif (3,30)
 Unif (0.2,2.0) Unif (0.02,0.2) Unif (0.1,1.0) Unif (0.02,0.2) Unif (0.1,1.0) Unif (0,50) Unif (1,10) Unif (0.1,1.0) Unif (0.3,3.0) Unif (3,30).")
12
Process Model Stage Distribution “Prior”, “(approximate) Balance Eqns”, “Basis Functions”,... 1D and 3D NEMURO+Fe and NPZD+Fe discretizations plus error (test sophisticated error models) Parameter Distributions structured vs. vague some “random”, some “fixed”, model validation tool Posterior Distribution “posterior mean”, “spread quantifies uncertainty” estimate via sampling; e.g. Markov Chain Monte Carlo (MCMC) posterior distributions on parameters Bayes Theorem Data Stage Distribution “Likelihood” “Measurement Error Model” Station obs, transects, satellite obs; i.e. with error estimates ROMS-NEMURO+Fe output with error estimates What is a Bayesian Hierarchical Model (BHM)? Use hierarchies of distributions to facilitate modelling, multi-platform data,...
 Parameter Distributions structured vs. vague some random , some fixed , model validation tool Posterior Distribution posterior mean , spread quantifies uncertainty estimate via sampling; e.g. Markov Chain Monte Carlo (MCMC) posterior distributions on parameters Bayes Theorem Data Stage Distribution Likelihood Measurement Error Model Station obs, transects, satellite obs; i.e. with error estimates ROMS-NEMURO+Fe output with error estimates What is a Bayesian Hierarchical Model (BHM). Use hierarchies of distributions to facilitate modelling, multi-platform data,....")
13
Posterior Distribution “posterior mean”, “spread quantifies uncertainty” estimate via sampling; e.g. Markov Chain Monte Carlo (MCMC) posterior distributions on parameters Zooplankton Grazing Rate Posterior Distribution day -1
 posterior distributions on parameters Zooplankton Grazing Rate Posterior Distribution day -1.")
14
What do we get from a BHM? Distributions mode is “most likely state”, distribution (“spread”) is uncertainty animations of “posterior mean”, “uncertainty maps”, summary fields parameter posterior distributions are the model parameters “identifiable” given the data? partition uncertainty; i.e. biological components vs. physics Conditional Probabilities diagnose/compare dependencies (i.e. “top-down/bottom-up”, “webs”) multi-platform (disparate) data stages “borrowed support” from well-known distributions to less well-known Model and Array Design identify next “most explanatory” term identify next “most informative” observation
 is uncertainty animations of posterior mean , uncertainty maps , summary fields parameter posterior distributions are the model parameters identifiable given the data. partition uncertainty; i.e. biological components vs. physics Conditional Probabilities diagnose/compare dependencies (i.e. top-down/bottom-up , webs ) multi-platform (disparate) data stages borrowed support from well-known distributions to less well-known Model and Array Design identify next most explanatory term identify next most informative observation.")
15
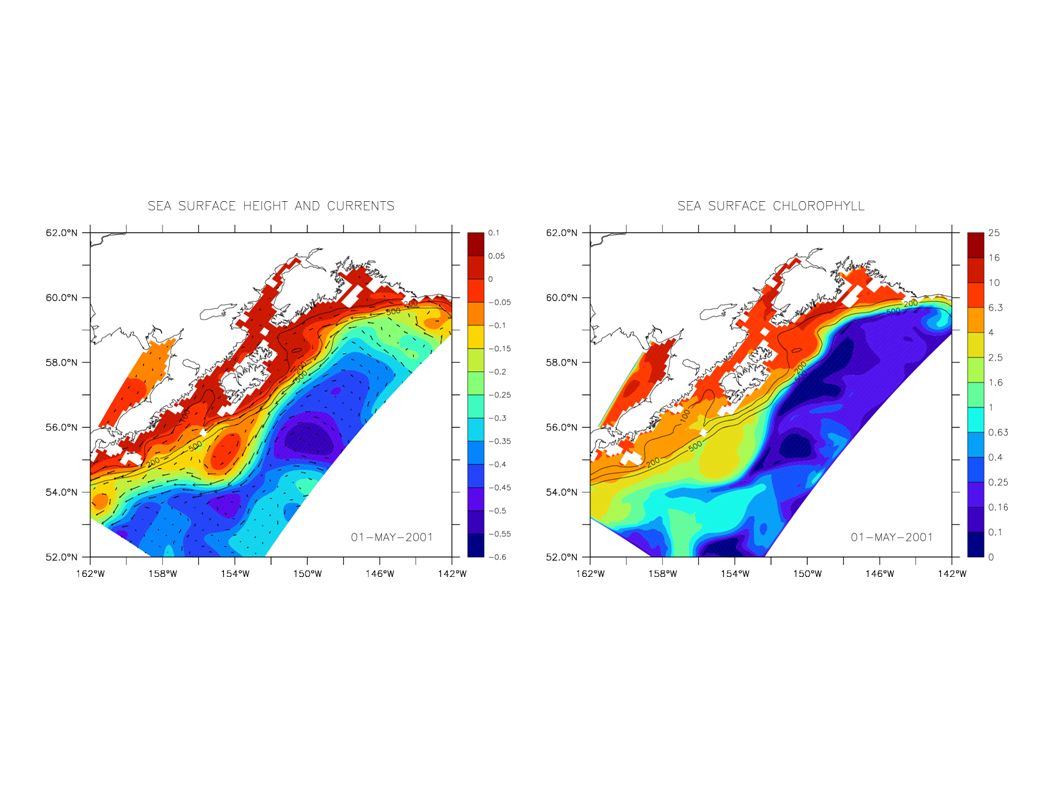
WPAC CGOA CCS ROMS-NPZD+Fe: Sea Surface Height Annual Average New WPAC ROMS-Nemuro+Fe and ROMS-NPZD+Fe implemented by J. Fiechter and A. Moore CCS dynamical model from C. Edwards and M. Veneziani Biology implemented by J. Fiechter CGOA and WPAC physical boundary conditions from N. Pacific ROMS due to JAMSTEC; E. Curchitser and E. Di Lorenzo

16
CCS ROMS-NPZD-Fe: Surface Chlorophyll Annual Average (sample data stage inputs) CGOA WPAC
 CGOA WPAC")
17
SEAWIFS Chlorophyll: 2001 Annual Mean (use comparison with ROMS-NPZD+Fe to estimate error) WPAC CGOA CCS WPAC
 WPAC CGOA CCS WPAC")
18
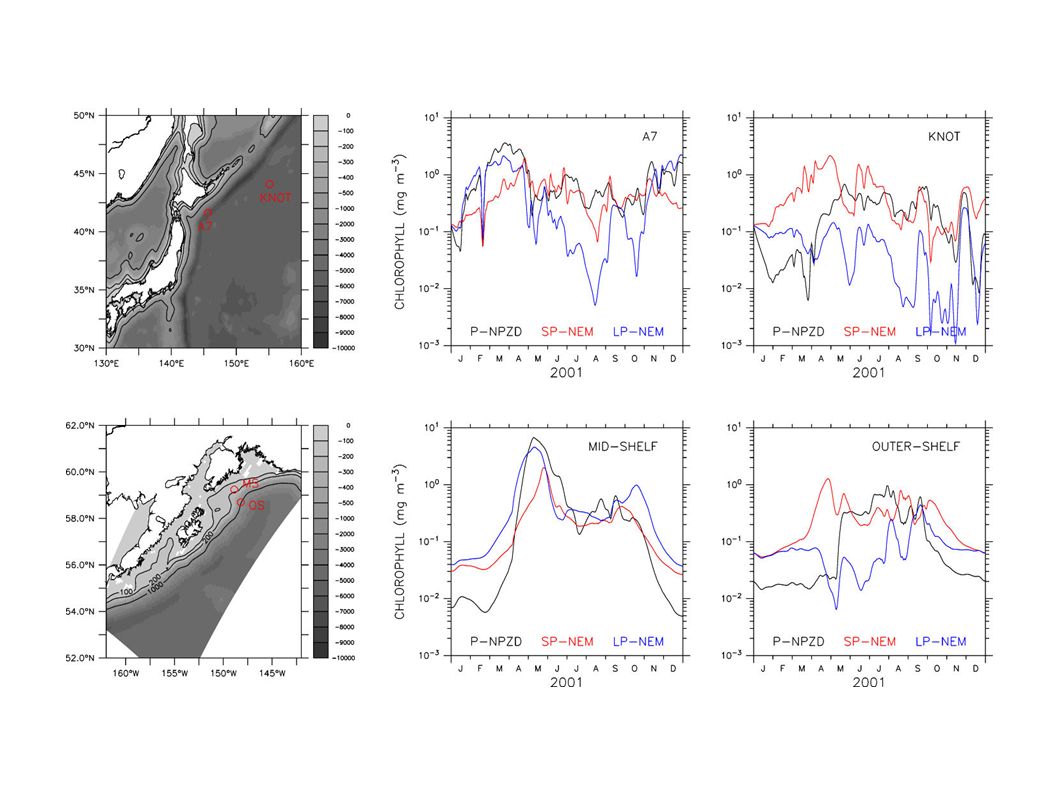
Data Stage Input Choices: Compare ROMS-NPZD, ROMS-NEMURO, SeaWIFS

19
inner shelfmid shelfouter shelf Z max 61.2 m162.4 m915.4 m10 levels 109-203107-195105-198dt = 1 d 94 d 88 d 93 d days 1D-NPZD+Fe BHM: Initial Experiments CGOA x,t domain: data stage inputs: NO3, P, Z, D, Fe dissolved, Fe P-assoc, SW rad GLOBEC data: GAK line station data NO3, SiOH4, P_total, P_small, P_large ROMS-NPZD output BHM solution procedure: Markov Chain Monte Carlo (Metropolis Hastings) 22K iterations, 2K burn-in validate with 30K repeat
 22K iterations, 2K burn-in validate with 30K repeat")
20
1D NPZD+Fe BHM: Process Model development 3D NPZD fr Powell Fe limitation fr Fiechter f90 fr ROMS-NPZD+Fe Semi-implicit, 3D»1D Matlab fr Brown BHM by Wikle 1. Random params 2. Random dependent vars 3. Error Models

21
AttSW Vm_NO3 PhyMRD ZooGR ZooMRD DetRR wDet T_Fe FeRR K_NO3 K_FeC Unif (0.04,0.4) Unif (0.2,2.0) Unif (0.02,0.2) Unif (0.1,1.0) Unif (0.02,0.2) Unif (0.1,1.0) Unif (0,50) Unif (1,10) Unif (0.1,1.0) Unif (0.3,3.0) Unif (3,30) 1D NPZD+Fe BHM: Initial Experiments CGOA Random Parameters and Hyperprior Distributions BHM Params BHM Initial Val BHM Initial Dist
 Unif (0.2,2.0) Unif (0.02,0.2) Unif (0.1,1.0) Unif (0.02,0.2) Unif (0.1,1.0) Unif (0,50) Unif (1,10) Unif (0.1,1.0) Unif (0.3,3.0) Unif (3,30) 1D NPZD+Fe BHM: Initial Experiments CGOA Random Parameters and Hyperprior Distributions BHM Params BHM Initial Val BHM Initial Dist")
22
inner shelf mid shelf outer shelf T_Fek_FeCFeRR 1D NPZD+Fe BHM: CGOA Initial Results GLOBEC GAK line data only Fe limitation vs. offshore position

23
1D NPZD+Fe BHM: CGOA Initial Results GLOBEC GAK line data only Data Influence on Posterior Mean Trace Forward integration of Process Model (no Bayesian estimation) Mean of posterior distribution from 1D NPZD+Fe BHM at one level on inner shelf profile * Observed N concentration at 19.375m on GAK line (inner shelf)
 Mean of posterior distribution from 1D NPZD+Fe BHM at one level on inner shelf profile * Observed N concentration at m on GAK line (inner shelf)")
24
BHM for 1D-NPZDFe using data from obs + ROMS Preliminary runs exhibit Bayesian learning and “mixing” BHM to be validated via sequence of 1D calculations: NPZDFe, NPZD, NPZ, NP, N, P Test issues of uniqueness in solutions Summary

25
Issues Data Stage Process Model Incl. vertical adv. and vertical mixing Identify correlated parameters Fixed vs. random parameters Data volume Data importance (uncertainty) Data timing
 Data timing.")
26
EXTRAS

29
1D NPZD+Fe BHM: CGOA Initial Results ROMS-NPZD+Fe data only Fe limitation vs. offshore position inner shelf mid shelf outer shelf T_Fek_FeCFeRR

30
1D NPZD+Fe BHM: CGOA Initial Results GLOBEC GAK line data only Vm_NO3 convergence vs. offshore position inner shelf mid shelf outer shelf Vm_NO3MCMC iteration trace 22K iterations Phytoplankton Nitrate Uptake Rate

31
inner shelf mid shelf outer shelf Vm_NO3MCMC iteration trace 22K iterations Phytoplankton Nitrate Uptake Rate 1D NPZD+Fe BHM: CGOA Initial Results ROMS-NPZD+Fe data only Vm_NO3 convergence vs. offshore position

Similar presentations


 Jonathan Rougier (Durham Univ.)>")
 Methods Nelson Christensen Carleton College LIGO-G020104-00-Z.>")

 Ralph F. Milliff; CIRES, University of Colorado Jerome Fiechter, Ocean.>")


