Download presentation
Presentation is loading. Please wait.

1
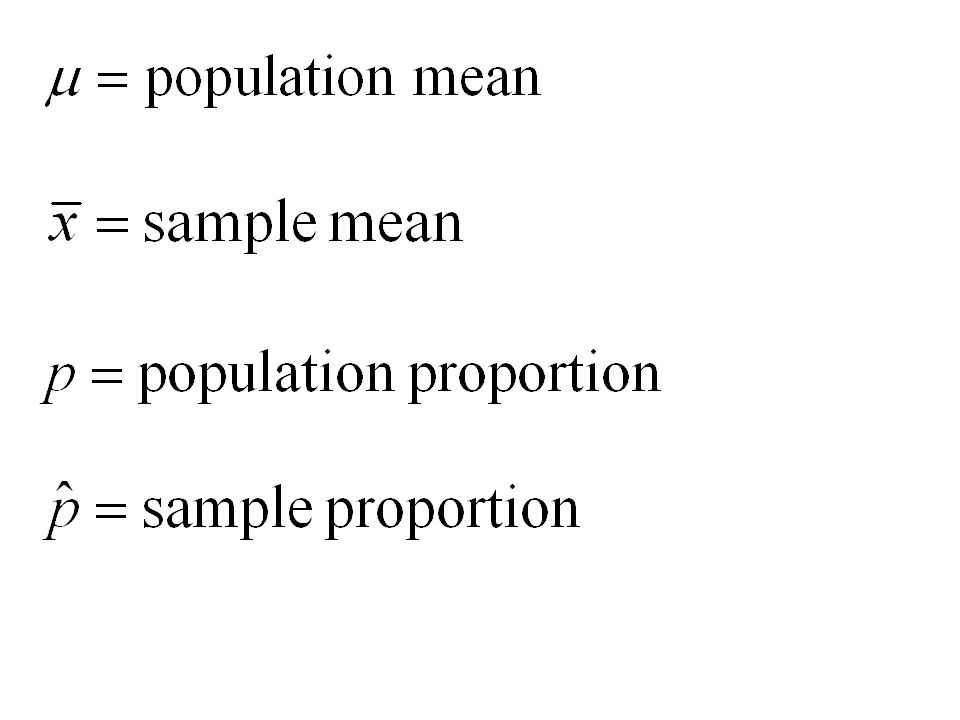
Parameters and Statistics What is the average income of American households? Each March, the government’s Current Population Survey (CPS) asks detailed questions about income. The random sample of 54,100 households contacted in March 2009 had a mean “total money income” of $68,424 in 2008.That $68,424 describes the sample, but we use it to estimate the mean income of all households. Parameter Population Sample Statistics the mean income μ of all households
 asks detailed questions about income. The random sample of 54,100 households contacted in March 2009 had a mean total money income of $68,424 in 2008.That $68,424 describes the sample, but we use it to estimate the mean income of all households. Parameter Population Sample Statistics the mean income μ of all households.")
3
From Ghosts to Cold Cabins Identify the population, the parameter, the sample, and the statistic in each of the following settings (a) The Gallup Poll asked a random sample of 515 U.S. adults whether or not they believe in ghosts. Of the respondents, 160 said “Yes.” Population: All US adults Parameter: p, the proportion of all U.S. adults who believe in ghosts Sample: the 515 people who were interviewed Statistic: (b) During the winter months, the temperatures outside the Starneses’ cabin in Colorado can stay well below freezing (32°F, or 0°C) for weeks at a time. To prevent the pipes from freezing, Mrs. Starnes sets the thermostat at 50°F. She wants to know how low the temperature actually gets in the cabin. A digital thermometer records the indoor temperature at 20 randomly chosen times during a given day. The minimum reading is 38°F.
 During the winter months, the temperatures outside the Starneses’ cabin in Colorado can stay well below freezing (32°F, or 0°C) for weeks at a time. To prevent the pipes from freezing, Mrs. Starnes sets the thermostat at 50°F. She wants to know how low the temperature actually gets in the cabin. A digital thermometer records the indoor temperature at 20 randomly chosen times during a given day. The minimum reading is 38°F..")
4
CHECK YOUR UNDERSTANDING Each boldface number below is the value of either a parameter or a statistic. In each case, state which it is and use appropriate notation to describe the number. 1. On Tuesday, the bottles of Arizona Iced Tea filled in a plant were supposed to contain an average of 20 ounces of iced tea. Quality control inspectors sampled 50 bottles at random from the day’s production. These bottles contained an average of 19.6 ounces of iced tea. The parameter is μ = 20 ounces of iced tea The statistic is ounces of iced tea 2. On a New York–to–Denver flight, 8% of the 125 passengers were selected for random security screening before boarding. According to the Transportation Security Administration, 10% of passengers at this airport are chosen for random screening The parameter is p = 0.10, or 10% of passengers The statistic is of the sample of passengers

5
Sampling Cards Sample Median Describe what you see: shape, center, spread and any unusual values Is this a Sampling Distribution?

6
We used Fathom to simulate choosing 500 SRSs of size 5 from the deck of cards. The graph below shows the distribution of the sample median for these 500 samples. (a) Is this the sampling distribution of the sample median? Justify your answer. (b) Describe the distribution. Are there any obvious outliers? (c) Suppose that another student prepared a different deck of cards and claimed that it was exactly the same as the one used in the activity. However, when you took an SRS of size 5, the median was 4. Does this provide convincing evidence that the student’s deck is different?
 Is this the sampling distribution of the sample median. Justify your answer. (b) Describe the distribution. Are there any obvious outliers. (c) Suppose that another student prepared a different deck of cards and claimed that it was exactly the same as the one used in the activity. However, when you took an SRS of size 5, the median was 4. Does this provide convincing evidence that the student’s deck is different .")
8
Sampling sleep Calculate the sample IQR of sleep hours and the sample maximum of sleep hours and plot the values of these statistics on the dot plots below: Biased vs. Unbiased estimators Average IQR: Average Max:

9
Make a graph of the population of sleep hours and calculate the true values of the IQR and maximum. Sleep Based on these values and the approximate sampling distributions, do either of these statistics appear to be unbiased estimators?

10
Who Watches Survivor? Why sample size matters Television executives and companies who advertise on TV are interested in how many viewers watch particular shows. According to Nielsen ratings, Survivor was one of the most- watched television shows in the United States during every week that it aired. Suppose that the true proportion of U.S. adults who have watched Survivor is p = 0.37.

11
Sample size of 100 Sample size of 1000 Variability of a Statistic

12
The variability of a statistic is described by the spread of its sampling distribution. This spread is determined primarily by the size of the random sample. Larger samples give smaller spread. The population should be at least 10 times larger than the sample.

13
Exercises on page 428, #1-13 odds, # 17-20 all Read 7.2

14
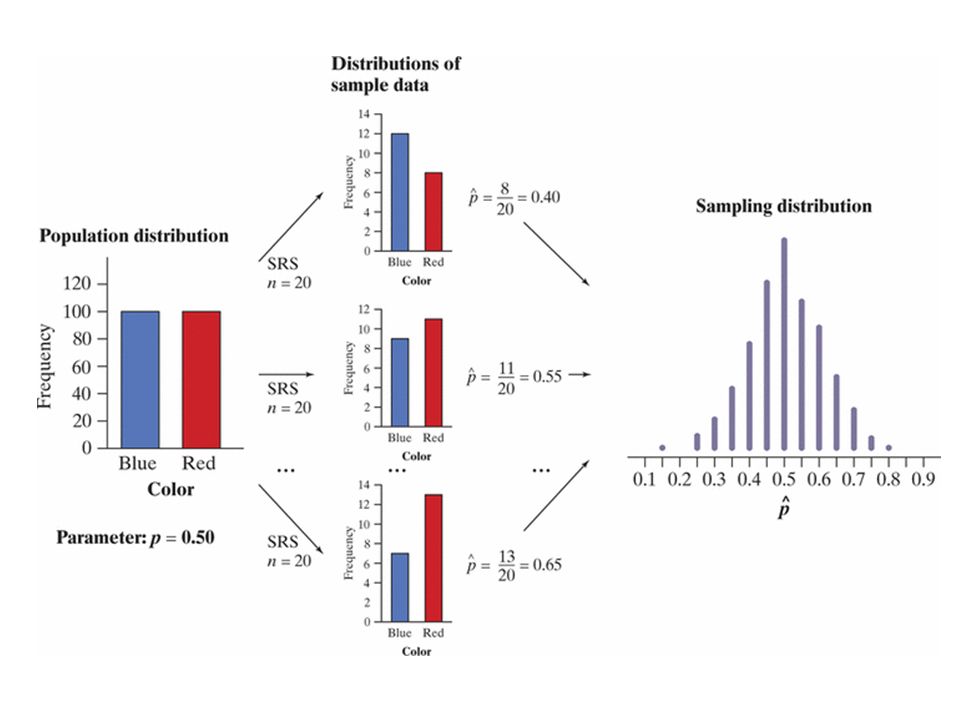
We used Fathom software to simulate choosing 500 SRSs of size n = 20 from a population of 200 chips, 100 red and 100 blue. Below is a dot plot of the values of, the sample proportion of red chips, from these 500 samples. (a) Is this the sampling distribution of ? (b) Describe the distribution. Are there any obvious outliers? (c) Suppose your teacher prepares a bag with 200 chips and claims that half of them are red. A classmate takes an SRS of 20 chips; 17 of them are red. What would you conclude about your teacher’s claim? Explain.
 Is this the sampling distribution of . (b) Describe the distribution. Are there any obvious outliers. (c) Suppose your teacher prepares a bag with 200 chips and claims that half of them are red. A classmate takes an SRS of 20 chips; 17 of them are red. What would you conclude about your teacher’s claim. Explain..")
Similar presentations


 SAMPLING DISTRIBUTIONS.>")


 Statistic: A number that can.>")