Download presentation
Presentation is loading. Please wait.

1
Software Modeling Juan Carlos Olivares Rojas MSN: juancarlosolivares@hotmail.com jcolivar@itmorelia.edu.mx http://antares.itmorelia.edu.mx/~jcolivar/ @jcolivares Social Network: Facebook, LinkedIn. Hi5

2
The Unified Modeling Language (UML) is the standard modeling language for software and systems development. Systems design on any reasonably large scale is difficult. We model for one important reason: to manage complexity UML

3
A model is an abstraction of the real thing. A model is a simplification of the real system. A particular diagram will show you some parts of your model but not necessarily everything. UML

4
Stereotypes signify a special use or intent and can be applied to almost any element of UML notation. Stereotypes modify the meaning of an element and describe the element's role within your model. UML

5
Modeling System Workflows: Activity Diagrams Use cases show what your system should do. Activity diagrams allow you to specify how your system will accomplish its goals. Activity diagrams show high-level actions chained together to represent a process occurring in your system. Activity Diagramas Pr

6
Activity diagrams are particularly good at modeling business processes. A business process is a set of coordinated tasks that achieve a business goal, such as shipping customers' orders. Some business process management (BPM) tools allow you to define business processes using activity diagrams, or a similar graphical notation, and then execute them. Activity Diagrams Pr
 tools allow you to define business processes using activity diagrams, or a similar graphical notation, and then execute them. Activity Diagrams Pr.")
7
Activity Diagrams Pr

8
Activity Diagrams Pr

9
Activity Diagrams Time Signaling Using pins for modeling I/O Transformations Pr

10
Activity Diagrams Signaling Pr

11
Activity Diagrams Partial Finally Event Pr

12
Activity Diagrams Swimingline Pr

13
A class has the next properties: Abstraction Encapsulate Class Diagrams L

14
L

15
L

16
Class and Objects can be restricted using OCL. OCL is representated with a Note L

17
The Object Constraint Language (OCL) is a declarative language for describing rules that apply to Unified Modeling Language (UML) models developed at IBM and now part of the UML standard. OCL is a precise text language that provides constraint and object query expressions on any MOF model or meta-model that cannot otherwise be expressed by diagrammatic notation. OCL L

18
L

19
Datatypes: –Booleantrue; false –Integer1; 6,664; -200 –Real2.7181828; 10.5 –String"Hello, World." Operators: –Arithmetic+, -, *, / –Additional Arithmeticabs(), max(), min( ) –Comparison, >= –Equality=, <> OCL L
, max(), min( ) –Comparison, >= –Equality=, <> OCL L")
20
Operators: –Booleanand, or, xor, not –Stringconcat(), size(), substring( ), toInteger(), toReal( ) Context: is the class we are located. Operator self indicate de selfclasse. There are three types of constraints: OCL L

21
Invariants An invariant is a constraint that must always be trueotherwise the system is in an invalid state. Preconditions A precondition is a constraint that is defined on a method and is checked before the method executes. Preconditions are frequently used to validate input parameters to a method. OCL L

22
Postconditions A postcondition is also defined on a method and is checked after the method executes. Postconditions are frequently used to describe how values were changed by a method. OCL L

23
Context AccountFee inv: self.baseCost >= 0.0 context BlogEntry::incrementRating(amount: int) : void pre: amount <= 100 post: rating = rating@pre + amount OCL L
 : void pre: amount <= 100 post: rating = + amount OCL L")
24
Class Diagrams L

25
Stereotype for modeling Generic Collections. Character E represent the generic type L

26
Object Diagrams Objects are at the heart of any object-oriented system at runtime. When the system you designed is actually in use, objects make up its parts and bring all of your carefully designed classes to life.Compared to class diagrams, object diagram notation is very simple. L

27
Sequence Diagramas Modeling Ordered Interactions. Use cases allow your model to describe what your system must be able to do; classes allow your model to describe the different types of parts that make up your system's structure. This is where interaction diagrams, and specifically sequence diagrams, come into play. Sequence Diagrams L

28
Secuence Diagrams L

29
L

30
L

31
L

32
The main purpose of sequence diagrams is to show the order of events between the parts of your system that are involved in a particular interaction. Communication diagrams add another perspective to an interaction by focusing on the links between the participants. Communications Diagrams L

33
Sequence and communication diagrams are so similar that most UML tools can automatically convert from one diagram type to the other. The difference between the two approaches is largely personal preference. Communications Diagrams L

34
Communication Diagrams L

35
Interaction timing is most commonly associated with real-time or embedded systems, but it certainly is not limited to these domains. In a timing diagram, each event has timing information associated with it that accurately describes when the event is invoked, how long it takes for another participant to receive the event, and how long the receiving participant is expected to be in a particular state. Timing Diagrams L

36
Although sequence diagrams and communication diagrams are very similar, timing diagrams add completely new information that is not easily expressed on any other form of UML interaction diagram. Not having a timing diagram for an interaction is like saying, "I know what events need to occur, but I'm not really worried about exactly when they happen or how quickly they will be worked on.” Timing Diagrams L

37
L

38
L

39
L

40
L

41
They exist to give you that big picture perspective on your system's interactions. Interaction overview diagrams provide a high-level view of how several interactions work together to implement a system concern, such as a use case. An interaction overview looks very much like an activity diagram except that each of the actions are interactions within their own right. Interaction Overview Diagrams L

42
Think of each part of an interaction overview as a complete interaction in itself. If one interaction within the overview is most concerned with timing, then a timing diagram could be employed, while another interaction of the overview may need to focus on message ordering, and so a sequence diagram could be used. Interaction Overview Diagrams L

43
L

44
L

45
Compiste Structure Diagrams Composite structures show how objects create a big picture. They model how objects work together inside a class, or how objects achieve a goal. Composite structures show: Internal structures Ports Collaborations L

46
Compiste Structure Diagrams L

47
Component Diagrams When designing a software system, it's rare to jump directly from requirements to defining the classes in your system. With all but the most trivial systems, it's helpful to plan out the high- level pieces of your system to establish the architecture and manage complexity and dependencies among the parts. Components are used to organize a system into manageable, reusable, and swappable pieces of software. D

48
Component Diagrams UML component diagrams model the components in your system and as such form part of the development view The development view describes how your system's parts are organized into modules and components and is great at helping you manage layers within your system's architecture. D

49
Component Diagrams A component is an encapsulated, reusable, and replaceable part of your software. You can think of components as building blocks: you combine them to fit together (possibly building successively larger components) to form your software. Because of this, components can range in size from relatively small, about the size of a class, up to a large. D
 to form your software. Because of this, components can range in size from relatively small, about the size of a class, up to a large. D.")
50
Component Diagrams Good candidates for components are items that perform a key functionality and will be used frequently throughout your system. Software, such as loggers, XML parsers, or online shopping carts, are components you may already be using. In UML, a component can do the same things a class can do: generalize and associate with other classes and components, implement interfaces, have operations, and so on. D

51
Component Diagrams D

52
D

53
D

54
As a software program grows in complexity, it can easily contain hundreds of classes. One way to impose structure is by organizing your classes into logically related groups. In UML, groups of classes are modeled with packages. Most object-oriented languages have an analog of UML packages to organize and avoid name collision among classes. For example, Java has packages, C# has namespaces. Package Diagrams D

55
D

56
D

57
D

58
State machine diagrams are heavily used in special niches of software and hardware systems, including the following: Real- time/mission-critical systems, such as heart monitoring software, Dedicated devices whose behavior is defined in terms of state, such as ATMs, First-person shooter games, such as Doom or Half-LifeTo reflect these common uses. State machine diagrams are often referred to informally as state diagrams. State Machine Diagrams L

59
L

60
L

61
L

62
L

63
Protocol State Machine Diag. L

64
The physical view is concerned with the physical elements of your system, such as executable software files and the hardware they run on. UML deployment diagrams show the physical view of your system, bringing your software into the real world by showing how software gets assigned to hardware and how the pieces communicate. Deployment Diagrams Ph

65
Deployment Diagrams Ph

66
Deployment Diagrams Ph

67
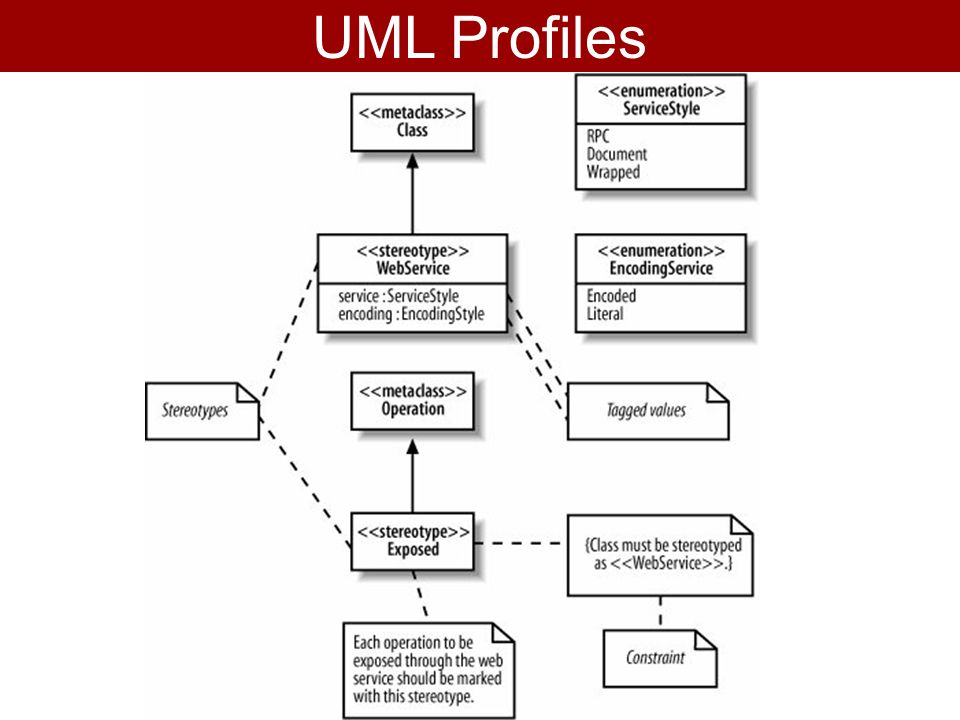
When you create your UML model, it is helpful if you label your model elements with the terminology specific to the environment or platform you've chosen. The group behind UML, the Object Management Group (OMG), realized this and built a mechanism by which UML can be adapted and tailored to meet your own specific needs. That mechanism was the profile. UML Profiles
, realized this and built a mechanism by which UML can be adapted and tailored to meet your own specific needs. That mechanism was the profile. UML Profiles.")
68
Profiles are a lightweight way to adapt UML to a particular platform: J2EE,.NET, etc. or domain: medical, financial, aerospace, etc. Profiles are made up of stereotypes, tagged values, and a set of constraints. They capture a vocabulary commonly used across a domain or platform and allow that vocabulary to be applied to your model's elements to make them more meaningful. UML Profiles

69
Even better, code generation tools can use profiles to generate artifacts specific to a platform or environment. A component labeled with an EJB stereotype could be converted to the classes and interfaces it takes to implement an EJB. In earlier versions of UML, you could make up stereotypes on the fly. UML Profiles

70
Stereotypes may have one or more associated tagged values. Tagged values provide extra information that is associated with the stereotype. UML Profiles

71
The term meta-model define rules about how the UML elements work, e.g., a class can have a subclass or a class can be associated with any number of other classes. When you are modeling a profile you are working with the meta-model, customizing the regular UML's rules for a particular context. UML Profiles

74
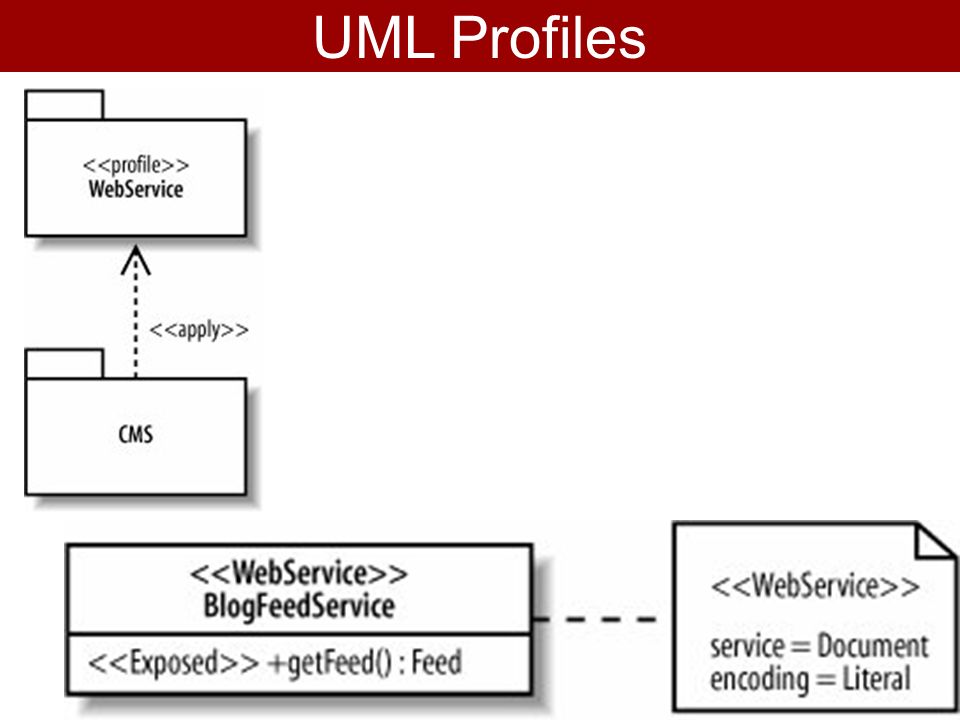
The real power of a profile comes when it is used by many people interested in that platform or domain. For example, a tool could convert a model that uses our Web Service profile into a deployable web service. The OMG maintains some common profiles, such as profiles for CORBA and testing. The testing profile, for example, describes mappings to JUnita widely-used Java unit testing framework. UML Profiles

75
Hamilton, K. And Miles, R. (2006), Learning UML 2.0, O'Reilly, ISBN-13: 978-0- 59-600982-3, pp. 286 References

76
¿Preguntas?

Similar presentations


 Used to help understand requirements more completely based on assertions; assertions are applicable to any.>")
 – Part One Ku-Yaw Chang Assistant Professor.>")


 SYSC 3100 - System Analysis and Design.>")

 – Part One Ku-Yaw Chang Assistant Professor.>")

 CYT.>")
