Download presentation
Presentation is loading. Please wait.

1
Center of Ocean-Land- Atmosphere studies Projected Global Changes Jagadish Shukla Lecture17: Oct 28, 2008 CLIM 101: Weather, Climate and Global Society

2
1.The IPCC 4th Assessment “Intergovernmental” Assessment—is it an “Integrated assessment?” Every 5 (or so) years The Process: WG1,2,3 and the Synthesis Document. Reviews, SPM “Policy relevant but not policy prescriptive” The FCCC (1992) is the policy mechanism of the UN
 is the policy mechanism of the UN.")
3
FCCC OBJECTIVE (1992) “The ultimate objective of this Convention and any related legal instruments that the Conference of the Parties may adopt is to achieve, in accordance with the relevant provisions of the Convention, stabilization of greenhouse gas concentrations in the atmosphere at a level that would prevent dangerous anthropogenic interference with the climate system. Such a level should be achieved within a time frame sufficient to allow ecosystems to adapt naturally to climate change, to ensure that food production is not threatened and to enable economic development to proceed in a sustainable manner.”

4
PRINCIPLES 1. The Parties should protect the climate system for the benefit of present and future generations of humankind, on the basis of equity and in accordance with their common but differentiated responsibilities and respective capabilities. Accordingly, the developed country Parties should take the lead in combating climate change and the adverse effects thereof. 2. The specific needs and special circumstances of developing country Parties, especially those that are particularly vulnerable to the adverse effects of climate change, and of those Parties, especially developing country Parties, that would have to bear a disproportionate or abnormal burden under the Convention, should be given full consideration.

5
PRINCIPLES 3. The Parties should take precautionary measures to anticipate, prevent or minimize the causes of climate change and mitigate its adverse effects. Where there are threats of serious or irreversible damage, lack of full scientific certainty should not be used as a reason for postponing such measures, taking into account that policies and measures to deal with climate change should be cost-effective so as to ensure global benefits at the lowest possible cost. To achieve this, such policies and measures should take into account different socio- economic contexts, be comprehensive, cover all relevant sources, sinks and reservoirs of greenhouse gases and adaptation, and comprise all economic sectors. Efforts to address climate change may be carried out cooperatively by interested Parties.

6
PRINCIPLES 4. The Parties have a right to, and should, promote sustainable development. Policies and measures to protect the climate system against human-induced change should be appropriate for the specific conditions of each Party and should be integrated with national development programmes, taking into account that economic development is essential for adopting measures to address climate change. 5. The Parties should cooperate to promote a supportive and open international economic system that would lead to sustainable economic growth and development in all Parties, particularly developing country Parties, thus enabling them better to address the problems of climate change. Measures taken to combat climate change, including unilateral ones, should not constitute a means of arbitrary or unjustifiable discrimination or a disguised restriction on international trade.

7
IMPLEMENTATION: 2. The head of the interim secretariat referred to in paragraph 1 above will cooperate closely with the Intergovernmental Panel on Climate Change to ensure that the Panel can respond to the need for objective scientific and technical advice. Other relevant scientific bodies could also be consulted

8
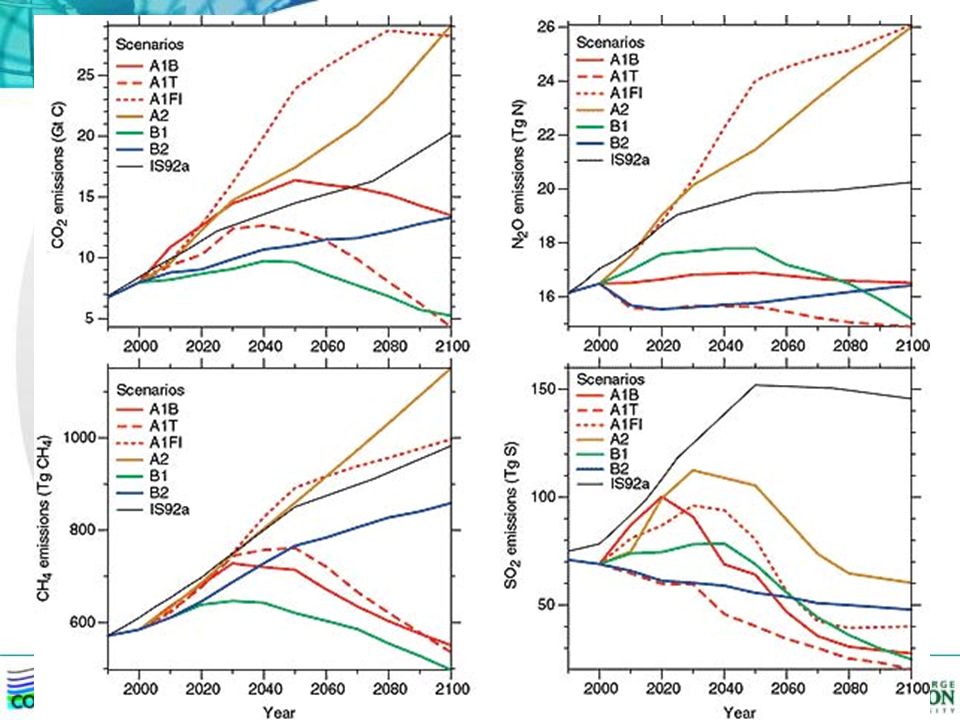
The Issue of “predictions” The SRES: The Emission Scenarios of the IPCC Special Report on Emission Scenarios A1. The A1 storyline and scenario family describes a future world of very rapid economic growth, global population that peaks in mid-century and declines thereafter, and the rapid introduction of new and more efficient technologies. Major underlying themes are convergence among regions, capacity building and increased cultural and social interactions, with a substantial reduction in regional differences in per capita income. The A1 scenario family develops into three groups that describe alternative directions of technological change in the energy system. The three A1 groups are distinguished by their technological emphasis: fossil intensive (A1FI), non-fossil energy sources (A1T), or a balance across all sources (A1B) (where balanced is defined as not relying too heavily on one particular energy source, on the assumption that similar improvement rates apply to all energy supply and end use technologies). A2. The A2 storyline and scenario family describes a very heterogeneous world. The underlying theme is self reliance and preservation of local identities. Fertility patterns across regions converge very slowly, which results in continuously increasing population. Economic development is primarily regionally oriented and per capita economic growth and technological change more fragmented and slower than other storylines.
, non-fossil energy sources (A1T), or a balance across all sources (A1B) (where balanced is defined as not relying too heavily on one particular energy source, on the assumption that similar improvement rates apply to all energy supply and end use technologies). A2. The A2 storyline and scenario family describes a very heterogeneous world. The underlying theme is self reliance and preservation of local identities. Fertility patterns across regions converge very slowly, which results in continuously increasing population. Economic development is primarily regionally oriented and per capita economic growth and technological change more fragmented and slower than other storylines..")
9
The Issue of “predictions” The SRES: The Emission Scenarios of the IPCC Special Report on Emission Scenarios B1. The B1 storyline and scenario family describes a convergent world with the same global population, that peaks in mid-century and declines thereafter, as in the A1 storyline, but with rapid change in economic structures toward a service and information economy, with reductions in material intensity and the introduction of clean and resource efficient technologies. The emphasis is on global solutions to economic, social and environmental sustainability, including improved equity, but without additional climate initiatives. B2. The B2 storyline and scenario family describes a world in which the emphasis is on local solutions to economic, social and environmental sustainability. It is a world with continuously increasing global population, at a rate lower than A2, intermediate levels of economic development, and less rapid and more diverse technological change than in the B1 and A1 storylines. While the scenario is also oriented towards environmental protection and social equity, it focuses on local and regional levels. An illustrative scenario was chosen for each of the six scenario groups A1B, A1FI, A1T, A2, B1 and B2. All should be considered equally sound. The SRES scenarios do not include additional climate initiatives, which means that no scenarios are included that explicitly assume implementation of the United Nations Framework Convention on Climate Change or the emissions targets of the Kyoto Protocol.

11
Uncertainties are being reduced Error analysis: FF + other emissions: 0.3 PgC/y Land Use change: 1.0 PgC/y Atmospheric increase: 0.1 PgC/y Ocean uptake: 0.5 PgC/y Residual Land use: 1.2 PgC/y fossil fuel emissions tropical deforestation atmospheric CO 2 ocean sink land sink Anthropogenic Global Carbon Cycle No slow down of emission in sight! Atmospheric accumulation = F Foss + F LUC + F LandAir + F OceanAir Source: Pep Canadell, Corinne LeQuere, Mike Raupach, Gregg Marland, Skee Houghton, Tom Conway, Philippe Ciais, GCP, 2006.

13
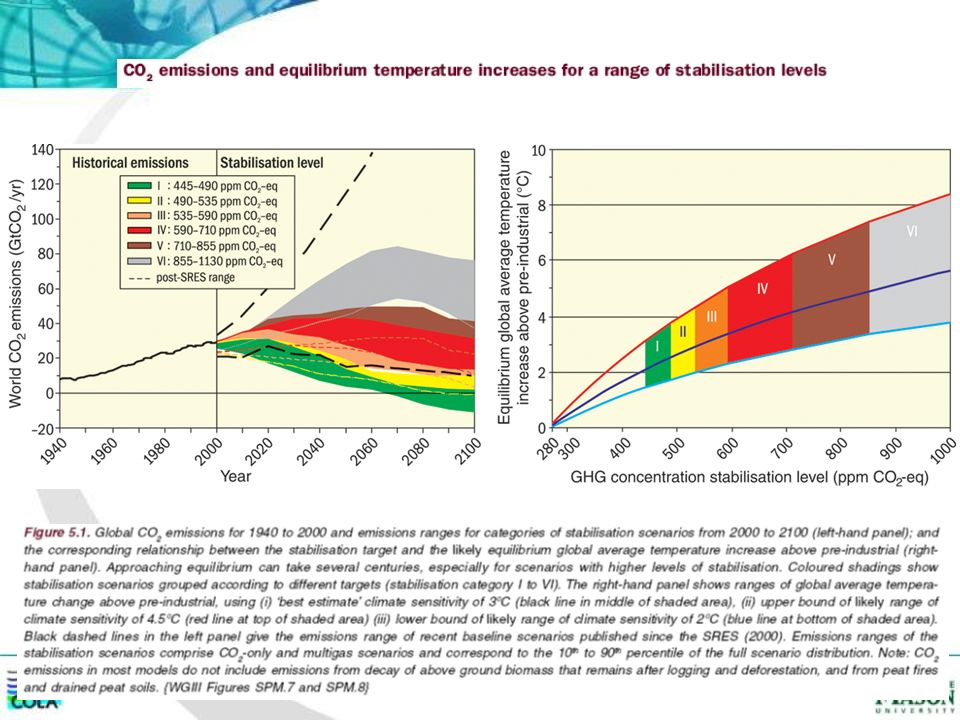
Global temperature changes estimated for SRES (bottom) and stabilisation (top)
 and stabilisation (top)")
15
IPCC has been established by WMO and UNEP to assess scientific, technical and socio- economic information relevant for the understanding of climate change, its potential impacts and options for adaptation and mitigation. Intergovernmental Panel on Climate Change (IPCC) Working Group I: The Physical Science Basis Working Group II: Impacts, Adaptation and Vulnerability Working Group III: Mitigation of Climate Change Center of Ocean-Land- Atmosphere studies Largest number of U.S. scientists: nominated by the U.S. Govt. Largest number of U.S. scientists: nominated by the U.S. Govt. Highest skepticism : “U.S. Govt.” Highest skepticism : “U.S. Govt.”
 Working Group I: The Physical Science Basis Working Group II: Impacts, Adaptation and Vulnerability Working Group III: Mitigation of Climate Change Center of Ocean-Land- Atmosphere studies Largest number of U.S. scientists: nominated by the U.S. Govt. Largest number of U.S. scientists: nominated by the U.S. Govt. Highest skepticism : U.S. Govt. Highest skepticism : U.S. Govt. .")
16
Quantitative and/or qualitative representation of natural processes (may be physical or mathematical) Based on theory Suitable for testing “ What if … ? ” hypotheses Capable of making predictions What is a Model? Center of Ocean-Land- Atmosphere studies

17
Input DataModelOutput Data Tunable Parameters What output data might we consider for a typical climate model? What input data might we consider for a typical climate model? What are the tunable parameters of interest? What is a Model? Center of Ocean-Land- Atmosphere studies

18
Dynamics Physical processes Climate System Modeling Atmospheric General Circulation Model Basic Equations

19
Using the secant approach, we can approximate the temperature equation: By reducing t, we can obtain an increasingly accurate solution.

20
CLIMATE DYNAMICS OF THE PLANET EARTH S Ω a g T4T4 WEATHERWEATHER CLIMATE. CLIMATE. hydrodynamic instabilities of shear flows; stratification & rotation; moist thermodynamics day-to-day weather fluctuations; wavelike motions: wavelength, period, amplitude S,, a, g, Ω O 3 H 2 O CO 2 stationary waves (Q, h*), monsoons h*: mountains, oceans (SST) w*: forest, desert (soil wetness) (albedo)
, monsoons h*: mountains, oceans (SST) w*: forest, desert (soil wetness) (albedo).")
21
Equations of motions and laws of thermodynamics to predict rate of change of: T, P, V, q, etc. (A, O, L, CO 2, etc.) 10 Million Equations: 100,000 Points × 100 Levels × 10 Variables With Time Steps of: ~ 10 Minutes Use Supercomputers What is a Climate Model?
 10 Million Equations: 100,000 Points × 100 Levels × 10 Variables With Time Steps of: ~ 10 Minutes Use Supercomputers What is a Climate Model .")
22
Geographic resolution characteristic of the generations of climate models used in the IPCC Assessment Reports: FAR (IPCC, 1990), SAR (IPCC, 1996), TAR (IPCC, 2001a), and AR4 (2007). The figures above show how successive generations of these global models increasingly resolved northern Europe. These illustrations are representative of the most detailed horizontal resolution used for short-term climate simulations. The century-long simulations cited in IPCC Assessment Reports after the FAR were typically run with the previous generation’s resolution. Vertical resolution in both atmosphere and ocean models is not shown, but it has increased comparably with the horizontal resolution, beginning typically with a single- layer slab ocean and ten atmospheric layers in the FAR and progressing to about thirty levels in both atmosphere and ocean.

23
Warming 1. Greenhouse gases (CO 2, CH 4, N 2 O) CO 2 : Carbon Dioxide : Emission from fossil fuel CH 4 : Methane : Agriculture N 2 O: Nitrous Oxide 2. Land use change Cooling 1.Aerosols Man made/Natural Volcanoes ※ Rate of increase of GHG is largest in 10,000 years (Net) Global Warming Center of Ocean-Land- Atmosphere studies
 CO 2 : Carbon Dioxide : Emission from fossil fuel CH 4 : Methane : Agriculture N 2 O: Nitrous Oxide 2. Land use change Cooling 1.Aerosols Man made/Natural Volcanoes ※ Rate of increase of GHG is largest in 10,000 years (Net) Global Warming Center of Ocean-Land- Atmosphere studies.")
24
Global mean, volume mean ocean temperature Courtesy of Tom Delworth (GFDL) GFDL Model Simulations
 GFDL Model Simulations")
25
Center of Ocean-Land- Atmosphere studies Global and Continental Temperature Change Comparison of observed continental- and global-scale changes in surface temperature with results simulated by climate models using natural and anthropogenic forcings. Decadal averages of observations are shown for he period 1906-2005 (black line) plotted against the centre of the decade and relative to the corresponding average for 1901-1950. Lines are dashed where spatial coverage is less than 50 %. Blue shaded bands show the 5-95% range for 19 simulates form 5 climate models using only the natural forcings due to solar activity and volcanoes. Red shaded bands show the 5-95% range for 58 simulations from 14 climate models using both natural and anthropogenic forcings.
 plotted against the centre of the decade and relative to the corresponding average for Lines are dashed where spatial coverage is less than 50 %. Blue shaded bands show the 5-95% range for 19 simulates form 5 climate models using only the natural forcings due to solar activity and volcanoes. Red shaded bands show the 5-95% range for 58 simulations from 14 climate models using both natural and anthropogenic forcings..")
26
Main threat to a sustainable Earth IPCC-AR4: Warming of the climate system is unequivocal

27
Center of Ocean-Land- Atmosphere studies Mean of 15 Models Surface Air Temperature Difference (Sresa1b YR 71-100) minus (20c3m 1969-98), Global Average = 2.61
 minus (20c3m ), Global Average = 2.61")
28
Courtesy of UCAR 1.0º C Center of Ocean-Land- Atmosphere studies

29
Figure 10.4 Multi-Model Means of Surface Warming

30
Center of Ocean-Land- Atmosphere studies Global Mean Surface Warming and Precipitation

31
Center of Ocean-Land- Atmosphere studies Multi-Model Means of Surface Warming

32
Center of Ocean-Land- Atmosphere studies Multi-Model Mean Changes of Surface Air Temperature, Precipitation and Sea Level Pressure

33
Center of Ocean-Land- Atmosphere studies Multi-Model Mean Changes in SRES A1B (2080 to 2099 minus 1980 to 1999)
")
34
Center of Ocean-Land- Atmosphere studies Multi-Model Anomalies in Sea Ice Extent

35
Center of Ocean-Land- Atmosphere studies Multi-Model Mean Sea Ice Concentration (SRES A1B scenario)
")
36
Center of Ocean-Land- Atmosphere studies Changes in Extremes in Multi-Model Simulations

37
Center of Ocean-Land- Atmosphere studies Projected CO2 emissions

38
Center of Ocean-Land- Atmosphere studies Multi-Model Mean of Projected Levels of Saturation

39
Center of Ocean-Land- Atmosphere studies Probability Density Function for Global Mean Temperature Changes

40
Center of Ocean-Land- Atmosphere studies Evolution of Greenland Surface Elevation and Ice Sheet Volume

41
Center of Ocean-Land- Atmosphere studies Mean of 15 Models Surface Air Temperature Difference (Sresa1b YR 71-100) minus (20c3m 1969-98), Global Average = 2.61
 minus (20c3m ), Global Average = 2.61")
42
Center of Ocean-Land- Atmosphere studies J. Shukla, T. DelSole, M. Fennessy, J. Kinter and D. Paolino Geophys. Research Letters, 33, doi10.1029/2005GL025579, 2006 Climate Model Fidelity and Projections of Climate Change

43
Main threat to a sustainable Earth Arctic summer sea ice likely to disappear in second half of century Dynamic instability of Greenland ice sheets Very likely increase in heat waves Likely increase in intensity of tropical storms Etc… SST

44
Main threat to a sustainable Earth Damages from business-as-usual scenario would be at least 5% and up to 20% of Global GDP a year Costs of removing most of the climate risk are around 1% of GDP per year This is equivalent to paying on average 1% more for what we buy “We can grow and be green” Sir Nicholas Stern

45
Main threat to a sustainable Earth According to IPCC AR4/WGIII, the cost of avoiding the worst would be only a fraction of what Stern Report projected Trajectories towards stabilization levels (ppm CO 2 -eq) Median GDP reduction (%) Range of GDP reduction (%) Reduction of average annual GDP growth rates (percentage points) 590-7100.2-0.6 – 1.2< 0.06 535-5900.60.2 – 2.5<0.1 445-535Not available< 3< 0.12
 Median GDP reduction (%) Range of GDP reduction (%) Reduction of average annual GDP growth rates (percentage points) – 1.2< – 2.5< Not available< 3< 0.12")
46
Sustainability issues – LDCs China, India and Brazil: now among the main drivers of the world’s economy Nepstad et al., Conservation Biology (2006) China’s GDP has grown on average 9.6% per year in the last quarter century China replaced EU as the main importer of Brazilian soybeans
 China’s GDP has grown on average 9.6% per year in the last quarter century China replaced EU as the main importer of Brazilian soybeans")
47
Sustainability issues – LDCs Cultivated land area went from 1,307,400 km² in 1991 to 1,282,400 km² in 2000 Construction accounted for 56.6% of reduction 60% of China’s 669 cities face water scarcity Economic losses due to pollution in China amounted to US$ 12.8 billion annually – 1.4% of GDP (1990-1998) Source: Gaoming Jiang & Jixi Gao, 2007
 Source: Gaoming Jiang & Jixi Gao, 2007")
48
Sustainability issues - LDCs 2006: 2.6% increase in global CO 2 from fossil fuel Mainly due to 4.5% increase in coal consumption China contributed more than two-thirds China’s CO 2 emissions surpassed those of the USA by 8% LDCs are now part of the problem and part of the solution Total emissions

49
Sustainability issues - LDCs But LDCs: small contribution to climate change, at least in per capita terms Per capita emissions US China Remember 1992 UNFCCC: “Common but differentiated responsibilities”

50
Equality: impacts will hit the poor hardest and earliest

51
Impacts hit the poor hardest 30 to 200 million people at risk of hunger with temperature rises of 2 to 3°C 0.7 to 4.4 billion people will experience growing water shortages with a rise of 2°C Yields across Africa and Western Asia may fall by 15% to 35%

52
Impacts hit the poor hardest Climate impacts will decrease water availability and drought in semi-arid latitudes “It’s exactly what we don’t want; it makes the world much less even, more inequitable” Martin Parry, co-chair IPCC WGII

53
Challenges to be addressed Purification of air and water Mitigation of droughts and floods Preservation of soils Pollination of crops and vegetation Dispersal of seeds Cycling and movement of nutrients Control of potential agricultural pests Maintenance of biodiversity Protection of coastal shores erosion Stabilization of climate etc. ECOSYSTEM SERVICES

54
Sustainability issues – LDCs Under threat: Cerrado, Brazilian savanna One of Brazil’s two biodiversity hotspots At the current rate of loss, gone by 2030 CI/Nature

55
Impacts hit the poor hardest Adaptation will cost LDCs $10 bns anually Even more for the necessary infrastructure

56
Main threat to a sustainable Earth

57
Source: Gordon et al., 2004 Impacts hit the poor hardest Nearly 200 million people live in coastal flood zones at risk South Asia alone: more than 60 million people

58
THANK YOU! ANY QUESTIONS? Center of Ocean-Land- Atmosphere studies

59
Sustainability issues – LDCs Eastern Amazon: Clearing > 40% for pasture or soybeans can trigger 2-3°C rise and “savannization” of tropical forest Sampaio, Nobre et al., 2007 Geophys. Res. Lett., 34 Dry SeasonAll PastureAll Soybean JJA-27.5%-39.8% SON-28.1%-39.9% PASTURE SOYBEAN Marked precipitation reductions during the dry season

60
Sustainability issues - LDCs

61
Gullison et al., 2007 Science Decreasing tropical deforestation rates by 50% up to 2050 Up to 15% of avoided CO 2 emissions for stabilization at 550 ppm

62
Impacts hit the poor hardest Dengue transmission in South America may increase 2 to 5 times by the 2050s An additional 40 to 60 million people in Africa could be exposed to malaria with a 2°C rise

Similar presentations


 projections Olivier Crespo Thanks to M. Tadross Climate Systems Analysis Group University.>")

 Meteorological Service, Jamaica International Day for Biological Diversity: Biodiversity and Climate Change 22 May.>")


>")

 Your Organization (Line #2) Global warming.: Matthieu BERCHER, Master M.I.G.S., University of Burgundy,>")
