Download presentation
Presentation is loading. Please wait.

1
How to graph impedance and build your own spreadsheets with the Si6000b polarinstruments.com

2
Building a simple example sheet (This tutorial assumes you have a basic understanding of Excel) polarinstruments.com In this tutorial
 polarinstruments.com In this tutorial")
3
Please run through all the slides to give yourself an overview. Then launch the Si6000b, and work through the examples yourself. If you are not familiar with some of the features of Excel, you may find it worth taking reviewing the Si6000b Introduction presentation. polarinstruments.com How to use this tutorial

4
Learn the tools needed to Maximise yields Study microsection results Investigate production variation Design for manufacture polarinstruments.com From this example:

5
For this example lets build a simple impedance calculator using the embedded field solvers… polarinstruments.com Example 3

6
With the Si6000A open, select new

7
Starting with a clean sheet…

8
Select a cell for your result

9
Click the paste function

10
Scroll down to user defined

11
Select polarsurfacemicrostrip

12
This describes the parameters required for the selected structure

13
Select the cell for the H data

14
Cell reference automatically appears

15
Use the tab key to enter all the fields

16
Now add labels

17
Enter some trial numbers (use any units, but be consistent, - the field solvers are ratiometric so the units cancel out)
")
18
Press the F9 key and your result will appear here.. If you have made many changes to the underlying sheet you may need to wait a while while Excel recalculates the other values

19
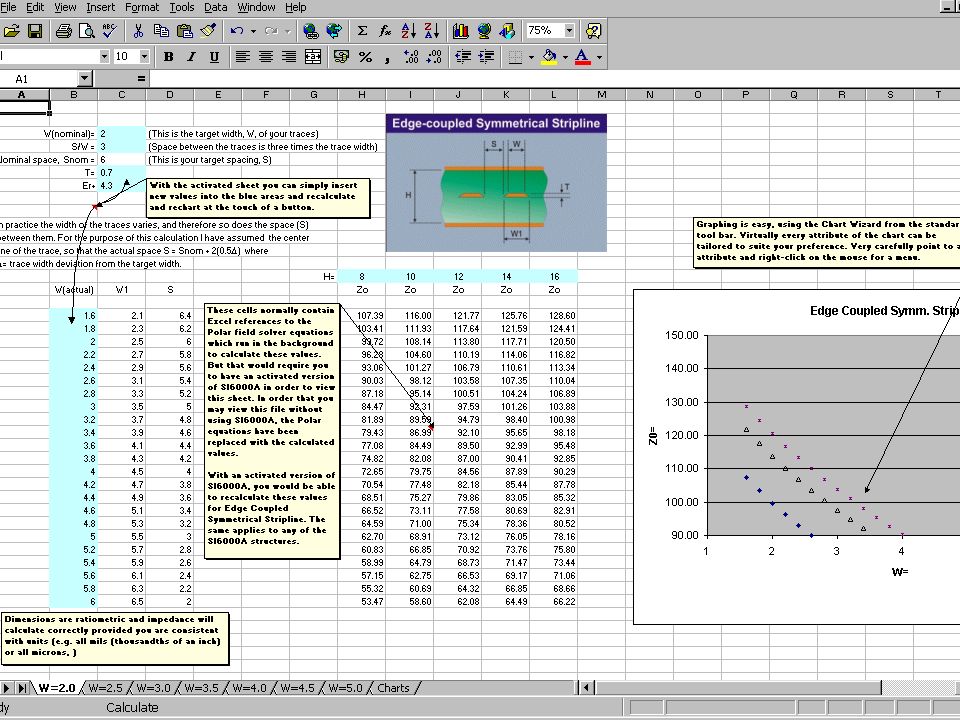
Here is one example of a sheet created by a customer who needed to use Si6000 to graph impedance sensitivity against structure height.. You can download your own copy from the application notes section of the website: polarinstruments.com How creative can you be?

21
Thank you for taking the time to study this presentation. For further information or if you would like to purchase a copy please contact your local Polar representative or email: ken.taylor@polarinstruments.com polarinstruments.com

Similar presentations


 This presentation works.>")


