Download presentation
Presentation is loading. Please wait.

1
Paper presented at the BSPS Annual Conference, University of Kent at Canterbury, 12-14 September 2005 Are our cities still losing human capital? The evidence of the ‘moving group’ data from the 2001 Census Tony Champion and Mike Coombes Centre for Urban & Regional Development Studies University of Newcastle, Newcastle upon Tyne, NE1 7RU Tel: +44 (0) 191 222 6437, Email: tony.champion@ncl.ac.uk
 ,")
2
Are our cities still losing human capital? Introduction: aims & acknowledgements Policy and theoretical contexts Approach and data source Overall migration for 27 Primary Urban Areas Migration by NS-SeC of Moving Group Representative Persons Concluding comments

3
Introduction Aims: assess the extent to which cities are attracting and retaining their human capital, especially people in higher-skill occupations Acknowledgements: based on research funded by the Joseph Rowntree Foundation Census Programme: project on ‘migration and the socio-economic complexion of communities’

4
Policy and theoretical contexts Policy context: - strong preference for living in the country - quest for an urban renaissance - the ‘knowledge economy’ as growth driver Theoretical context: - key = high-quality labour force (R. Florida) - also issue of local decentralisation - any change since analyses of patterns shown by 1991 Census, e.g.
 - also issue of local decentralisation - any change since analyses of patterns shown by 1991 Census, e.g..")
5
Seven conurbations: net within-UK migration, 1990-1991, for 4 social groups

6
Approach and data source Same approach broadly, but no direct comparison 1991-2001 is possible, due to: Change in definition of resident population in 2001: students at term-time address Change in patterns of underenumeration Different method of disclosure control New socio-economic classification: NS-SeC replaces SEG New measure: ‘moving group’

7
National Statistics Socio-economic Classification 1.1 Large employers and higher managerial occupations Higher M&P 1.2 Higher professional occupations 2 Lower managerial and professional occupations Lower M&P 3 Intermediate occupations Intermediate 4 Small employers and own account workers 5 Lower supervisory and technical occupations Lower 6 Semi-routine occupations 7 Routine occupations L15 Full-time students Full-time students L14.1 Never worked Other unclassified L14.2 Long term unemployed L17 Not classifiable for other reasons

8
Moving Group ‘Moving group’: One or more people living together on census night who were living together at a different address one year ago NB.- no obvious denominator for calculating migration rates (though 2/3 MGs comprise one person only) Avoid this issue by concentrating on flow composition (% each type) and in/out ratio (N moving in for each out-migrant)
 Avoid this issue by concentrating on flow composition (% each type) and in/out ratio (N moving in for each out-migrant)")
9
SMS1 Table MG109 NS-SeC is for Representative Persons of Moving Groups (MGRPs) MGs are counted only for migrants living in private households, i.e. not in communal estabs MGRP can be any age, not just 16-74 of NS-SeC range in Area Tables (can be under 16) District-to-district* flow matrix for UK (*in Northern Ireland, Parliamentary Constituencies) ‘Cities’ are LA-best-fits to ONS (primary) ‘urban areas’ Study here is on 27 largest GB ‘cities’ that are Principal Cities of CURDS City Regions
 District-to-district* flow matrix for UK (*in Northern Ireland, Parliamentary Constituencies) ‘Cities’ are LA-best-fits to ONS (primary) ‘urban areas’ Study here is on 27 largest GB ‘cities’ that are Principal Cities of CURDS City Regions.")
10
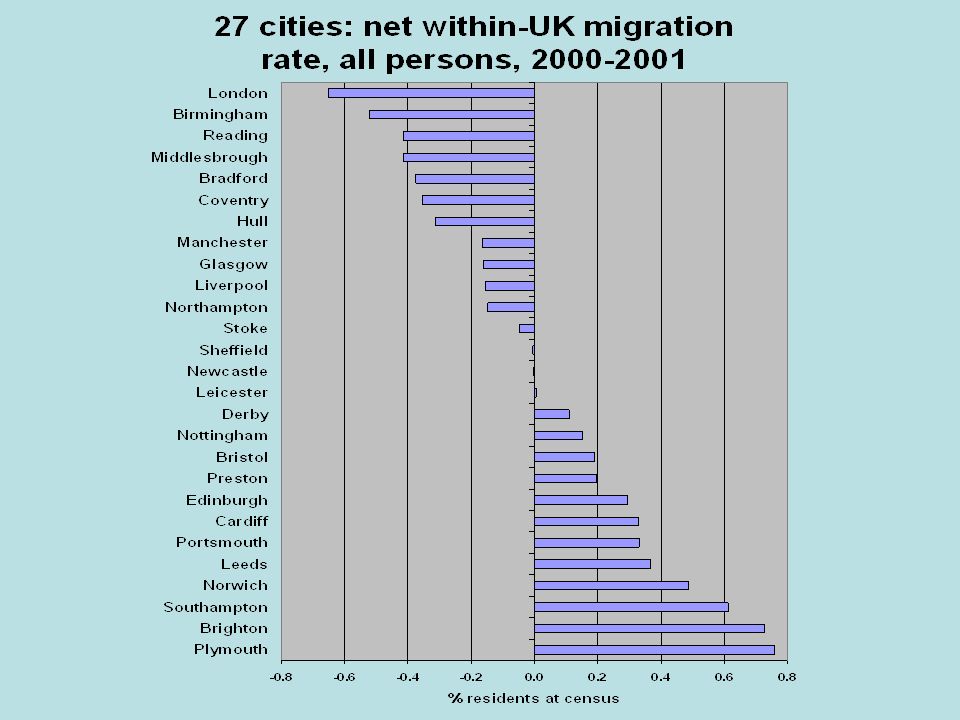
Overall migration for 27 Primary Urban Areas To provide context: Within-UK migration of all persons for the 27 cities Normal measure: net migration rate (% residents at census) In/out ratio: number of in-migrants for each out-migrant (perfect balance = 1.0, but will express as ‘deviation from unity’ in bar graphs where + = more in than out) Results are similar, not identical
 In/out ratio: number of in-migrants for each out-migrant (perfect balance = 1.0, but will express as ‘deviation from unity’ in bar graphs where + = more in than out) Results are similar, not identical")
14
Migration by NS-SeC of Moving Group Representative Persons Restrict to the 4 broad types of classified MGRPs Start with all 27 cities as a single aggregate Subdivide by size: London, next 5 largest, the other 21 Look at the 27 individually Bar graphs, with in/out ratio expressed as deviation from unity

19
Main findings These 27 large cities are evenly split on net gains and net losses of all persons, with most of the largest being losers All 27 together have slight loss of MGRPs: gain of students, lowest IOR for ‘other’, positive link between IOR and 4 SEC levels London is major part of latter and is one of only 3 with positive IOR for ‘all classified’ Majority of cities have negative association between IOR and 4 SEC levels, i.e. lower INs for the higher occups

20
Concluding comments Aimed to see whether GB’s largest cities are (still*) losing human capital Half and half re all persons, but majority picture is of losing ‘classified MGRPs’, especially higher- level occupations But picture needs to be interpreted in light of their gains of students (graduating to work locally or moving elsewhere) Partly in that context, useful to break down into shorter moves to rest of city region vs longer distance moves to other cities (esp London) *No direct comparison with 1991 possible
 losing human capital Half and half re all persons, but majority picture is of losing ‘classified MGRPs’, especially higher- level occupations But picture needs to be interpreted in light of their gains of students (graduating to work locally or moving elsewhere) Partly in that context, useful to break down into shorter moves to rest of city region vs longer distance moves to other cities (esp London) *No direct comparison with 1991 possible")
21
Paper presented at the BSPS Annual Conference, University of Kent at Canterbury, 12-14 September 2005 Are our cities still losing human capital? The evidence of the ‘moving group’ data from the 2001 Census Tony Champion and Mike Coombes Centre for Urban & Regional Development Studies University of Newcastle, Newcastle upon Tyne, NE1 7RU Tel: +44 (0) 191 222 6437, Email: tony.champion@ncl.ac.uk
 ,")
Similar presentations


, Sweden.>")


