Download presentation
Presentation is loading. Please wait.

1
John L. Snider Third Year Review Crop Physiologist University of Georgia Department of Crop and Soil Sciences

2
Responsibilities Teaching: 15% Appointment Advanced Crop Production: CRSS 8050 Crop Physiology: CRSS 4450/6650 Graduate Student Advising Research: 85% Appointment Drought Stress Irrigation Management Heat Stress Drought and Heat Tolerance Screening Seedling Vigor

3
Teaching

4
Crop Physiology

5
PeanutTobacco Cotton Corn Advanced Crop Production

6
Graduate Student Advisement Graduate Student Major Advisor Calvin Meeks. 2014 to Present. PhD Daryl Chastain. 2012 to Present. PhD Graduate Student Advisory Committee Member Seth Byrd. 2013 to Present. PhD Harold Owiti. 2014 to Present. MS Calvin Meeks. 2012 to 2013. MS

7
RESEARCH FOCUS 1 Drought Stress Physiology & Irrigation Management

8
2012 Drought Stress Study

9
Location Stripling Irrigation Research Park: Camilla, GA Three Cultivars DP 0912 B2RF, DP 1050 B2RF, PHY 499 WRF Two Irrigation Treatments Dryland 100% Checkbook Statistical Design/Analysis Split-plot, RCBD, n=4, 3 Mixed Effects ANOVA 100 % checkbook irrigation amounts Growth Stagecm/week Pre-Bloom2.54 1st Bloom (week 1)2.54 Week 23.81 Week 35.08 Week 45.08 Week 53.81 Week 63.81 Week 72.54 Week 82.54
2.54 Week Week Week Week Week Week Week 82.54")
10
Temperature: T air T leaf Water Status: Ψ PD Ψ MD PSII: F v /F m Φ PSII ETR Gas Exchange: P N P G R D g s E

11
Summary MeasurementTrend Photosynthesis↓ R D /P G ↑ gs, E↓ Canopy Temperature↑ PS II = Cultivar= Lint Yield↓ Arrows indicate direction of effect for dryland relative to 100% checkbook. How do underlying mechanisms interact to inhibit net photosynthesis and drive yield loss? J. Plant Physiol., 2014 J. Agron. Crop Sci., 2014

12
Plant-Based Irrigation Scheduling

13
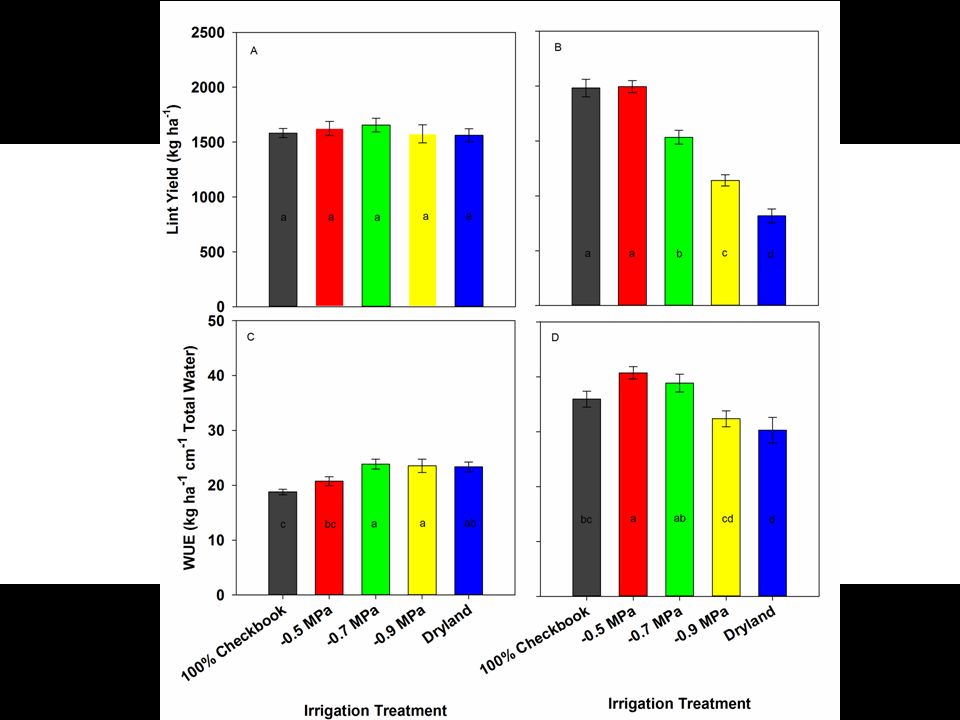
Predawn Water Potential for Scheduling Irrigation Location Stripling Irrigation Research Park: Camilla, GA Two Cultivars FM 1944 PHY 499 Five Irrigation Treatments 100% Checkbook -0.5 Mpa -0.7 Mpa -0.9MPa Dryland Design RCBD n = 4 Sampling Leaf sampled from 4 th main-stem node below the apical meristem three days per week.

14
Rainfall and Irrigation: 2013 & 2014 All data are in cm. Treatment Irrigation 2013 Irrigation 2014 Rainfall 2013 Rainfall 2014 Total 2013 Total 2014 Checkbook 17.429.966.934.9 84.364.8 -0.5 MPa 11.523.766.934.9 78.458.6 -0.7 MPa 2.514.2 66.934.9 69.449.1 -0.9 MPa 010.0 66.934.9 66.944.9 Dryland 0066.934.9 66.934.9

15
Predawn Water Potential (Ψ PD ) 2013 2014
 2013 2014 ")
16
Season-Average Predawn Water Potential 2013 2014

18
Yield x Average Ψ PD Yield & WUE optimized

19
T C - T a Well-Watered Baseline Can Use This Model to Calculate Crop Water Stress Index

20
T C -Derived Crop Water Stress Index 20132014

21
T C -Derived Crop Water Stress Index

22
Yield x CWSI

23
RESEARCH FOCUS 2 Heat Stress Physiology & Drought/Heat Tolerance Screening

24
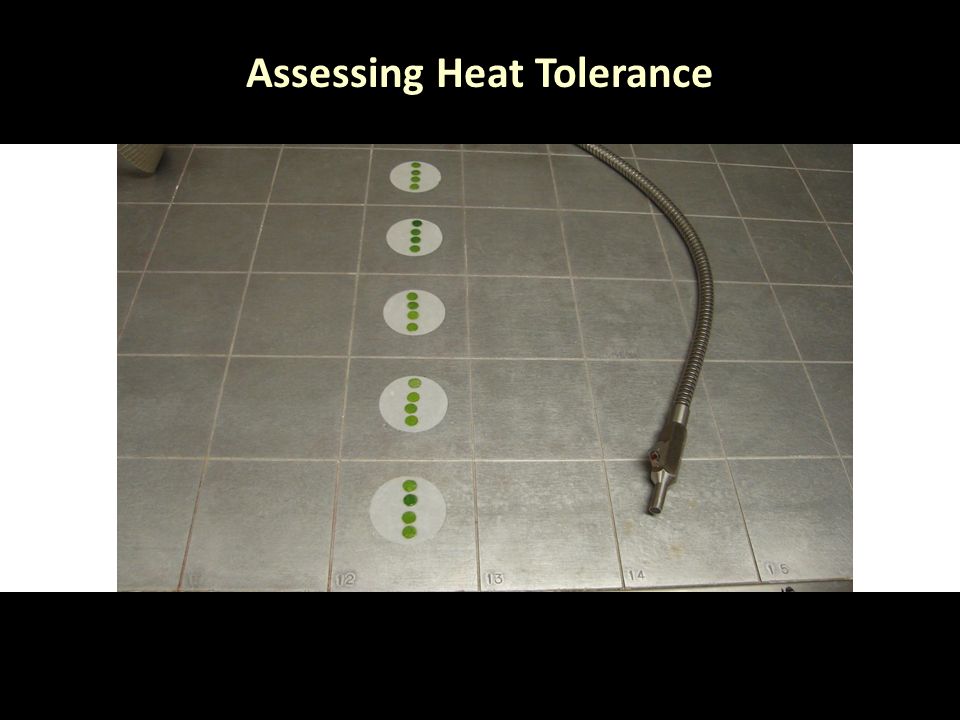
Assessing Heat Tolerance

26
T 15 as a Common Heat Tolerance Threshold

27
Overview of Heat Tolerance Work Seasonal and Genotypic Differences (J. Plant Physiol., 2013) Stage of Plant Development (J. Agron. Crop Sci., in press) Thermotolerance and yield stability Leaf Development
 Stage of Plant Development (J. Agron. Crop Sci., in press) Thermotolerance and yield stability Leaf Development.")
28
RESEARCH FOCUS 3 Seedling Vigor

29
Multi-Location Seedling Vigor Trial Current work focusing on fatty acid saturation & seedling response to temperature. J. Cotton Sci. 2014

30
QUESTIONS?

Similar presentations


, Web Topic 26.1 Abiotic stress – environmental.>")


