Download presentation
Presentation is loading. Please wait.

1
Philippine Poverty Leland Joseph R. Dela Cruz Development Studies Program School of Social Sciences Ateneo de Manila University

2
Outline of the Presentation 1. Poverty Measurements 2. Causes of Poverty 3. Poverty Sectors

3
Outline of the Presentation 1. Poverty Measurements a. Income Measures b. Perception-based Measures c. Basic Needs Measures 2. Causes of Poverty 3. Poverty Sectors

4
When is a person considered poor? A poor person is someone who earns income below the official poverty line or poverty threshold. The poverty line measures the income needed to obtain basic and non-basic needs for one year.

5
How does the government compute for the poverty line? 1. The government constructs a menu per region that satisfies basic nutritional requirements. The government computes for the cost of that menu. (ex. P43, Y104) 2. The government computes for the proportion of income that is budgeted for food using survey data. (ex. 66%) 3. The figure obtained in #1 is divided by the figure obtained in #2. (ex. P43 / 66% = P65, Y157)
 2. The government computes for the proportion of income that is budgeted for food using survey data. (ex. 66%) 3. The figure obtained in #1 is divided by the figure obtained in #2. (ex. P43 / 66% = P65, Y157).")
6
What is the NCR poverty line (2008)? P328.77 Y798.20 Family/ day* P10,000.00 Y24, 278.75 Family/ month P120,000.00 Y291,345 Family/ year* P65.76 Y159.64 Individual/ day* P2,000.00 Y4,855.75 Individual/ month* P24,000.00 Y58,269.00 Individual/ year* *Unofficial, self-computed

7
What is the Philippine poverty line (2006)? P206.29 Y500.78 Family/ day* P6,273.99 Y15,232.08 Family/ month* P75,287.85 Y182,785.00 Family/ year* P41.26 Y100.15 Individual/ day* P1,254.80 Y3,046.41 Individual/ month* P15,057.57 Y36,557.00 Individual/ year NSCB *Unofficial, self-computed

8
Poverty incidence 2006, NSCB 32.9% or 27.6 million Filipinos are poor. 32.9% of Filipinos earn less than P 15,057.57 a year (Y36,557), P 1,254.80 a month (Y3,046) and P 41.26 a day (Y100.15). 26.9% or 4.6 million Filipino families are poor. 26.9% of families earn less than P75,287.85 a year (Y182,705), P 6,273.99 a month (Y15,232.08) and P 206.29 a day (Y500.78).
, P 1, a month (Y3,046) and P a day (Y100.15). 26.9% or 4.6 million Filipino families are poor. 26.9% of families earn less than P75, a year (Y182,705), P 6, a month (Y15,232.08) and P a day (Y500.78)..")
9
Poorest Provinces (2006) NSCB Poverty Incidence Tawi-Tawi, Mindanao78.9% Zamboanga del Norte, Mindanao63.0% Maguindanao, Mindanao62.0% Apayao, Northern Luzon57.5% Surigao del Norte, Mindanao53.2% Lanao del Sur, Mindanao52.5% Northern Samar, Visayas52.2% Masbate, Southern Luzon51.0% Abra, Northern Luzon50.1% Misamis Occidental, Mindanao48.8%
 NSCB Poverty Incidence Tawi-Tawi, Mindanao78.9% Zamboanga del Norte, Mindanao63.0% Maguindanao, Mindanao62.0% Apayao, Northern Luzon57.5% Surigao del Norte, Mindanao53.2% Lanao del Sur, Mindanao52.5% Northern Samar, Visayas52.2% Masbate, Southern Luzon51.0% Abra, Northern Luzon50.1% Misamis Occidental, Mindanao48.8%")
10
Least Poor Provinces (2006) NSCB Poverty Incidence Batanes, Northern Luzon0% Rizal, Adjacent to NCR6.4% Bataan, Luzon6.8% Cavite, Adjacent to NCR7.8% Benguet, Luzon8.2% Pampanga, Adjacent to NCR8.3% Bulacan, Adjacent to NCR10.0% Laguna, Adjacent to NCR10.6% Nueva Vizcaya, Luzon12.7% Quirino, Luzon15.9%
 NSCB Poverty Incidence Batanes, Northern Luzon0% Rizal, Adjacent to NCR6.4% Bataan, Luzon6.8% Cavite, Adjacent to NCR7.8% Benguet, Luzon8.2% Pampanga, Adjacent to NCR8.3% Bulacan, Adjacent to NCR10.0% Laguna, Adjacent to NCR10.6% Nueva Vizcaya, Luzon12.7% Quirino, Luzon15.9%")
11
Poverty trends NSCB

12
Philippine Poverty Incidence: Families (Percentage) NSCB 0 5 10 15 20 25 30 35 40 45 198819911994199720002003 %
 NSCB %")
13
Philippine Poverty Incidence: Individuals (Percentage) NSCB 0 10 20 30 40 50 60 198819911994199720002003 %
 NSCB %")
14
Gini Coefficient CountryGini ratioCountryGini ratio Denmark0.247Hong Kong0.434 Japan0.249Philippines0.445 Italy0.360Mexico0.461 India0.368Guatemala0.551 U.S.A.0.408Namibia0.743 Philippine data: UNDP, 2004 as cited in Wikipedia

15
Self-Rated Poverty Pulse-Asia June 2004 October 2004 March 2005 Philippines70% Class ABC37%21%35% Class D68% 69% Class E84%87%82%

16
Self-Rated Poverty Pulse-Asia June 2004 October 2004 March 2005 NCR52%41%48% Luzon69% 66% Visayas71%82%80% Mindanao80%79%81% Rural73%83%82% Urban66%57%58%

17
Self-Rated Poverty SWS

18
Summary Official Statistics Perception- based measure Poverty Incidence 25%50-70% Poverty threshold P6,273.99 (Y15,232) a month P10,000 (Y26,623) a month
 a month P10,000 (Y26,623) a month")
19
Access to basic needs Indicator% of population With access to safe drinking water80.2% With sanitary toilet86.2% With access to electricity79.7% With own house and lot64.9% With children 6-12 years old in elementary 91.2% With children 13-16 years old in high school 36.1%

20
Informal Settlers Insecure living conditions Insecure land tenure Cramped living conditions

21
Informal Settlers Inadequate Shelter Inappropriate Living Conditions

22
Outline of the Presentation 1. Poverty Measurements a. Income Measures b. Perception-based Measures c. Basic Needs Measures 2. Causes of Poverty 3. Poverty Sectors

23
Outline of the Presentation 1. Poverty Measurements 2. Causes of Poverty a. Inequality b. Inflation c. Weak Human Capital d. Absence of Employment Opportunities e. Weak Agricultural Sector f. Poor Governance 3. Poverty Sectors

24
Outline of the Presentation 1. Poverty Measurements 2. Causes of Poverty a. Inequality b. Inflation c. Weak Human Capital d. Absence of Employment Opportunities e. Weak Agricultural Sector f. Poor Governance 3. Poverty Sectors

25
The Economy Has Been Growing

26
But poverty has not substantially decreased This may be due to unequal benefits from economic growth Unequal incomes Unequal assets

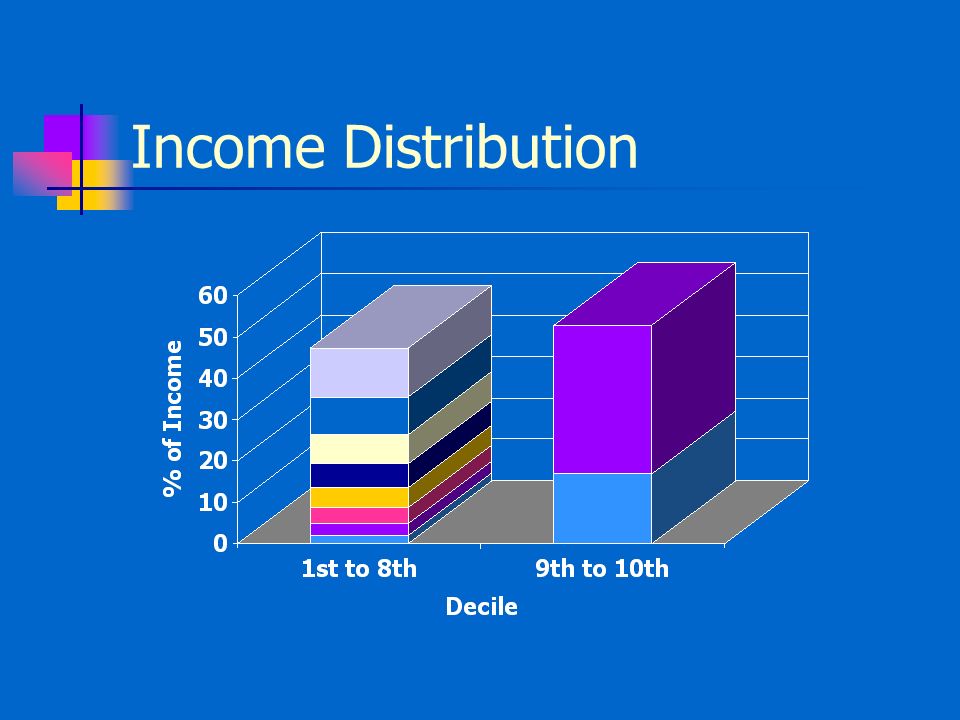
27
Income Distribution 2006, NSO

28
Income Distribution

30
Unequal Asset Distribution: Land Distribution 449 Landowners 30 Landowners 50% of land area

31
Land Distribution 449 Landowners 50% of land area 25% of land area 29 Landowners 1 Landowner

32
Outline of the Presentation 1. Poverty Measurements 2. Causes of Poverty a. Inequality b. Inflation c. Weak Human Capital Education Health d. Absence of Employment Opportunities e. Weak Agricultural Sector f. Poor Governance 3. Poverty Sectors

33
Inflation: Rice Prices

34
Self-Rated Hunger

35
Outline of the Presentation 1. Poverty Measurements 2. Causes of Poverty a. Inequality b. Inflation c. Weak Human Capital Education Health d. Absence of Employment Opportunities e. Weak Agricultural Sector f. Poor Governance 3. Poverty Sectors

36
Inadequacies at the Elementary Level Source: Basic Education Information System, DepEd

37
Inadequacies at the Secondary Level Source: Basic Education Information System, DepEd

38
National Achievement Test Scores Elementary Average: 59.94% High School Average: 46.64%

39
Third International Math and Science Survey Grade 4 Test: Philippines ranked 3 rd lowest among 25 countries (Japan ranked 3 rd highest behind Singapore and Hong Kong) Grade 8 Test: Philippines ranked 6 th lowest among 45 countries (Japan ranked 5 th highest behind Singapore, Korea, Hong Kong and Taiwan)
 Grade 8 Test: Philippines ranked 6 th lowest among 45 countries (Japan ranked 5 th highest behind Singapore, Korea, Hong Kong and Taiwan)")
40
Outline of the Presentation 1. Poverty Measurements 2. Causes of Poverty a. Inequality b. Inflation c. Weak Human Capital Education Health d. Absence of Employment Opportunities e. Weak Agricultural Sector f. Poor Governance 3. Poverty Sectors

41
Health Personnel by Location RuralUrban Midwives~30%~60% Nurses~20%~80% Dentists~10%~90% Doctors 62% migrate to other countries ~10%~90% Source: Dr. Merceditas Santos-Tuano, former Executive Director, Healthdev Institute

42
Child Delivery Attendants (2003, NDHS)
")
43
Child Delivery Attendants by Income Quintiles (2003, NDHS)
")
44
Location of Child Delivery (2003, NDHS)
")
45
Location of Child Delivery by Income Quintile (2003, NDHS)
")
46
Outline of the Presentation 1. Poverty Measurements 2. Causes of Poverty a. Inequality b. Inflation c. Weak Human Capital Education Health d. Absence of Employment Opportunities e. Weak Agricultural Sector f. Poor Governance 3. Poverty Sectors

47
More than 8 million Filipinos are working in other countries

48
Destination of Overseas Filipino Workers

50
Employment Abroad

51
Outline of the Presentation 1. Poverty Measurements 2. Causes of Poverty a. Inequality b. Inflation c. Weak Human Capital Education Health d. Absence of Employment Opportunities e. Weak Agricultural Sector f. Poor Governance 3. Poverty Sectors

52
Outline of the Presentation 1. Poverty Measurements 2. Causes of Poverty a. Inequality b. Weak Human Capital Education Health c. Absence of Employment Opportunities d. Weak Agricultural Sector e. Poor Governance 3. Poverty Sectors a) Landless Rural Workers b) Indigenous People c) Fisherfolk d) Small Farmers e) Microentrepreneurs f) Laborers
 Landless Rural Workers b) Indigenous People c) Fisherfolk d) Small Farmers e) Microentrepreneurs f) Laborers.")
53
Landless Rural Farmers No productive assets of their own Forced to sell their labor to work on other people’s farms Land reform has not really helped

54
Indigenous Peoples Official estimates at 12 million Filipinos A large proportion are in Mindanao, Cordillera Autonomous Region

55
Indigenous People Threats to Land Tenure Lack of access to basic services Internal Displacement

56
Fisherfolk Environmental Degradation Competition from Commercial Fishermen

57
Fisherfolk Access to Credit Access to Markets

58
Microentrepreneurs Access to Credit Access to Markets Harassment

59
Laborers Contractualization Violations of Labor Standards Working conditions Payment

60
Small owner cultivators Access to credit Access to markets

61
Outline of the Presentation 1. Poverty Measurements 2. Causes of Poverty 3. Poverty Sectors

62
Philippine Poverty Leland Joseph R. Dela Cruz Director, Development Studies Program Ateneo de Manila University

Similar presentations

 Department of Environment and Natural Resources Manila Observatory 14 April 2005.>")


 Indicators on Employment, Philippines: 1999-2010 (In percent) GOAL 1: ERADICATE EXTREME POVERTY AND HUNGER Target 1.B:>")


>")

