Download presentation
Presentation is loading. Please wait.

1
Measurement of Farm Incomes Economics of Food Markets Lecture 4 Alan Matthews

2
Lecture objectives Identifying concerns about farm income –The resources/returns square Measuring farm incomes –Macroeconomic sources –Microeconomic (survey) sources Assessing farm incomes in Ireland –Farm household living standards –Are farmers poor? –What about returns to farming? Distribution of support to farming

3
Farm income concerns Dimensions of the farm income problem –poverty (income adequacy), comparability (income parity), income instability Income adequacy – are farmers poor? Income parity – do farmers earn less than the going rate on the resources they employ? Income stability – are farm incomes particularly volatile? Parity-- Welfare Greater than parityLess than parity Above the poverty line Well-structured commercial farms Large but low- yielding farms Below the poverty line Productive small farms with limited resources Marginal farms, both poor and inefficient

4
Uses of farm income statistics To measure trends in farm income over time To make welfare comparisons between farmer and nonfarm populations To estimate the number of farmers living in poverty To examine the efficiency of resource use in agriculture

5
Sources of data on farm incomes Macroeconomic –Economic accounts for agriculture –Combine with data on sources of labour input (LFS vs AWU) –Limited to averages/useful for showing trends over time Microeconomic –National farm surveys (Teagasc) –Household budget surveys (CSO) –Good for showing differentiation within the sector/may not be fully representative
 –Limited to averages/useful for showing trends over time Microeconomic –National farm surveys (Teagasc) –Household budget surveys (CSO) –Good for showing differentiation within the sector/may not be fully representative")
6
Eurostat Income Indicators Operating surplus

7
Producer price: Price received by the farmer, also called the farmgate or ex- farm price Basic price: The producer price plus any subsidies directly linked the product Note that the Single Farm Payment is no longer linked to production Source: Department of Agriculture and Food Annual Report 2006

8
Source: Department of Agriculture and Food, Annual Review and Outlook 2005-06 Note: Double payment of DPs in 2005 because of changeover to Single Farm Payment

9
Source: Department of Agriculture and Food, Annual Review and Outlook 2005-06

10
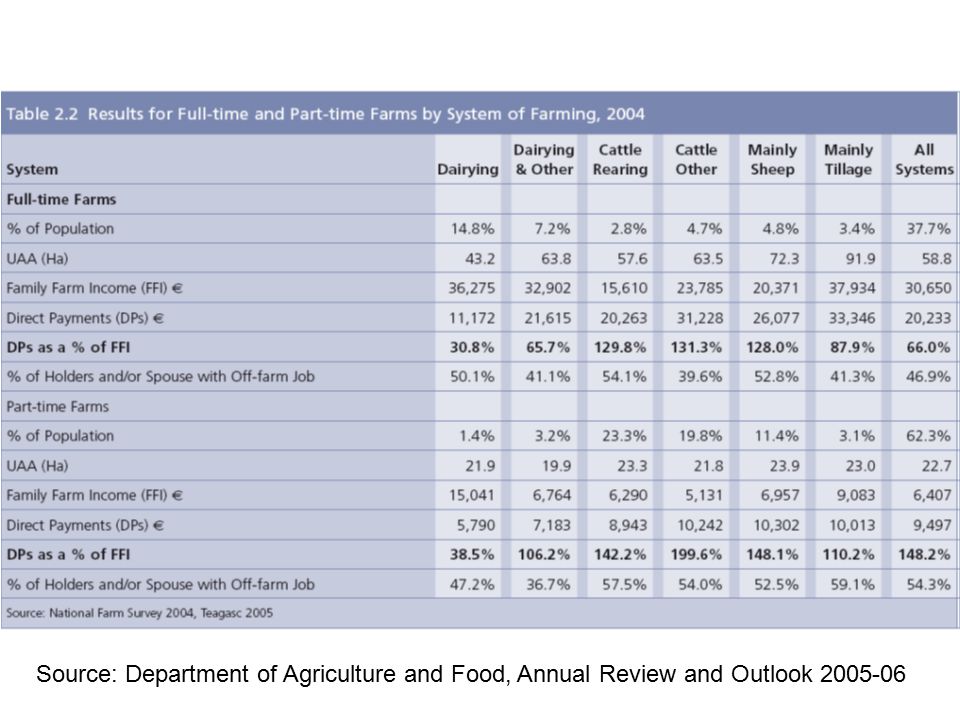
Limitations of the macroeconomic measure imprecision over numbers at work in the industry (Labour Force Survey vs. Farm Structures Survey sources) not all farmers are solely dependent on farming for their livelihood. A high proportion of farm household income now comes from off-farm sources (Household Budget Survey source) ignoring wealth and capital gains effects gives a misleading impression of economic status farming is not a homogeneous industry. Contains a wide range of farm sizes and types (Teagasc National Farm Survey). Incomes in cattle farming in Ireland are particularly low.
 not all farmers are solely dependent on farming for their livelihood. A high proportion of farm household income now comes from off-farm sources (Household Budget Survey source) ignoring wealth and capital gains effects gives a misleading impression of economic status farming is not a homogeneous industry. Contains a wide range of farm sizes and types (Teagasc National Farm Survey). Incomes in cattle farming in Ireland are particularly low..")
11
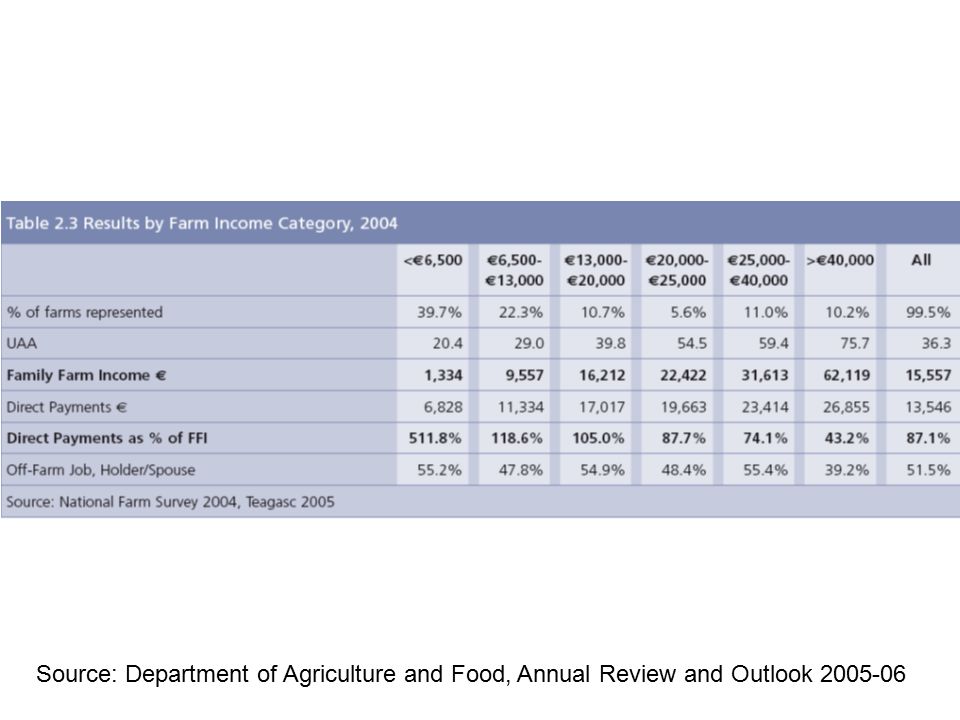
Microeconomic (survey) data on farm incomes Drawn from the Teagasc National Farm Survey –Allows us to measure the heterogeneity of incomes within farming, by farm size or farm system or region –Deals only with income from farming Drawn from the Household Budget Survey –Allows us to measure the total household income of farm families –Note distinction between the ‘narrow’ and ‘broad’ definitions of a farm household
 data on farm incomes Drawn from the Teagasc National Farm Survey –Allows us to measure the heterogeneity of incomes within farming, by farm size or farm system or region –Deals only with income from farming Drawn from the Household Budget Survey –Allows us to measure the total household income of farm families –Note distinction between the ‘narrow’ and ‘broad’ definitions of a farm household")
12
Source: Department of Agriculture and Food, Annual Review and Outlook 2005-06

15
Household budget survey data Broad definition of farm households –All households (including urban households) which have an income from farming Narrow definition of farm households –Households in which the head of household is a farmer or head of household is a retired farmer and there is at least one other farmer in the household
 which have an income from farming Narrow definition of farm households –Households in which the head of household is a farmer or head of household is a retired farmer and there is at least one other farmer in the household")
16
Source: Department of Agriculture and Food, Annual Review and Outlook 2005-06

17
Comparing farm and nonfarm incomes crude approach based on calculation of a disparity index - ratio of average agricultural incomes to average earnings in rest of economy Average farm income vs. average industrial earnings Income from farming vs. total household income?

18
Percentage of farm household income from all sources, per cent 19731980198719941999/ 2000 Farming70.158.354.251.339.0 Other direct income 19.126.317.637.050.3 Transfer payments 10.815.228.311.710.6 Gross income 100 Source: Matthews 2004, in O’Hagan and Newman

19
Comparison urban-rural household incomes, 2004 (repeated)
")
20
Absolute levels of farmer incomes - measuring the extent of poverty Two issues –what is the relative importance of poverty (risk, incidence and severity) among farmers as compared to other social groups –identifying the characteristics of farm households in poverty Defining the poverty line –whether to look only at financial income or other indicators of deprivation –absolute vs. relative measures –the unit of analysis - individuals vs. households The Irish data (ESRI surveys) show considerable farm poverty, mainly older farmers on smaller holdings in west of country
 show considerable farm poverty, mainly older farmers on smaller holdings in west of country.")
21
Risk of poverty (relative income measure) Source: Department of Agriculture and Food Annual Review and Outlook 2005-06
 Source: Department of Agriculture and Food Annual Review and Outlook")
22
Risk of poverty (consistent poverty measure) Source: Department of Agriculture and Food Annual Review and Outlook 2005-06
 Source: Department of Agriculture and Food Annual Review and Outlook")
23
Are farmers underpaid? Idea is to compare returns to farm labour or capital with returns elsewhere in the economy Total return to farming is a return to farmer’s own labour, own labour plus management input Applying standard rates of return more than exhausts the available factor income Conclusion is that, even if farmers may not be poor, their resources are not being used very productively.

24
The distribution of government support – how well targeted? Support to farmers provided both directly and through market price support – easiest to measure distributional effects of direct payments DPs in EU often said to follow an 80/20 rule DPs in Ireland also go mainly to the better off farmers, but this conclusion can vary by scheme.

25
Distribution of direct payments at EU25 level Payment class (euro) % of total beneficiaries % of total payments <1,25062.80%4.90% >1,250 and <5,00018.66%10.48% >5,000 and < 100,000 18.20%70.28% > 100,000 and < 200,000 0.25%7.20% > 300,0000.04%4.89%
 % of total beneficiaries % of total payments <1, %4.90% >1,250 and <5, %10.48% >5,000 and < 100, %70.28% > 100,000 and < 200, %7.20% > 300, %4.89%")
26
Source: Department of Agriculture and Food, Annual Review and Outlook 2005-06

27
Measuring and assessing farm incomes - summary Farm problem concerns emerge from the direction and pace of the economic adjustment required of the sector widening differentiation in the farm sector (greater polarisation of farm size, greater access to off-farm income sources) makes drawing inferences from ‘average’ farm incomes increasingly anachronistic different measures of farm income are available and can be useful depending on the purpose in hand assessing the adequacy of farm incomes complicated by the huge degree of existing government support serious problems of farm (and rural) poverty persist
 makes drawing inferences from ‘average’ farm incomes increasingly anachronistic different measures of farm income are available and can be useful depending on the purpose in hand assessing the adequacy of farm incomes complicated by the huge degree of existing government support serious problems of farm (and rural) poverty persist")
28
Recommended readings OECD Policy brief Department of Agriculture and Food chapter Matthews Farm incomes monograph Hill and OECD reports

Similar presentations

 - EMPLOYMENT INDICATORS.>")


