Download presentation
Presentation is loading. Please wait.

1
1 Air Pollution

2
2 THE AIR AROUND US Air pollution-physical or chemical changes brought about by natural processes or human activities that result in the decrease of air quality ~147 million metric tons released annually in the U.S. by human activities. –Worldwide emissions total around 2 billion metric tons. Improved air quality in developed countries, while air quality in developing world is getting worse.

3
3 NATURAL SOURCES OF AIR POLLUTION Natural Fires - Smoke Volcanoes - Ash and acidic components Sea Spray - Sulfur Bacterial Metabolism - Methane Dust Pollen

4
4 HUMAN-CAUSED AIR POLLUTION Primary Pollutants – emitted directly into air from a point source Secondary Pollutants – form in air when primary pollutants react or interact

5
5 Major Air Pollutants Carbon monoxide (CO) Nitrogen dioxides (NO 2 ) Ozone (O3) Particulate matter (PM-10, PM-2.5) Sulfur dioxide (SO 2 ) Lead (Pb) Greenhouse gases (CO 2 and others)
 Nitrogen dioxides (NO 2 ) Ozone (O3) Particulate matter (PM-10, PM-2.5) Sulfur dioxide (SO 2 ) Lead (Pb) Greenhouse gases (CO 2 and others)")
6
6 Carbon Monoxides Annual emissions: 7-8 billion tons –60% comes from auto exhaust –Sources: incomplete combustion of fossil fuels –Health effects: reduces ability of blood to bring oxygen to body cells and tissues, headaches, respiratory irritant

7
7 Sulfur Dioxides Annual emissions: 114 million metric tons –90% released by humans in urban areas –Natural sources: sea spray, volcanic fumes –Human sources: –Human sources: burning high sulfur coal or oil, smelting or metals, paper manufacture –Negative effects: Breathing problems, may cause permanent damage to lungs Combines with water vapor in the air to produce sulfuric acid –damage trees and lakes –eat away stone used in buildings, statues, monuments, etc.

8
8 Sulfur Dioxide Impacts: Acidic deposition of H 2 SO 4 Pure water pH = 5.6 Source: Ref. (3)
")
9
9 Particulate Matter Annual emissions: 362 millions tons –Natural sources Dust, volcanic ash, pollen, spores –Human sources Smoke, dust, soot, asbestos, factories, unpaved roads, plowing, lint, burning fields –Negative effects Reduces visibility Nose and throat irritation, lung damage, bronchitis, early death Property damage

10
10 Particulate Matter Impacts: Visibility at Shenandoah Nat’l Park Source: Ref. (2)
")
11
11 Nitrogen Oxides Annual emissions: 230 million tons –60% released by humans –Natural sources: forest fires, volcanoes, lightning, bacteria in soil –Human sources: –Human sources: fossil fuels combustion, power plants, –Negative effects: Forms nitric acid in air –Brown haze Respiratory irritant

12
12 Metals Metals –Annual emissions of lead: 2 million tons –Lead, mercury, nickel, etc. –Human Sources: Paint, gasoline, coal burning power plants, waste incinerators –Effects: accumulates in tissue; affects kidneys, liver and nervous system (children most susceptible); mental retardation; possible carcinogen; 20% of inner city kids have high levels
; mental retardation; possible carcinogen; 20% of inner city kids have high levels.")
13
13 Halogens Halogens (Fluorine, Chlorine, Bromine) –CFC’s –Human Sources: Coolants in refrigerators and air conditioners Propellants in aerosol cans
 –CFC’s –Human Sources: Coolants in refrigerators and air conditioners Propellants in aerosol cans")
14
14 VOCs Volatile organic compounds (smog formers) –Source – from solvent vapors gasoline, formaldehyde, acetone, benzene –Health Effects Respiratory damage May cause cancer
 –Source – from solvent vapors gasoline, formaldehyde, acetone, benzene –Health Effects Respiratory damage May cause cancer")
15
15 Ozone (Ground Level) Principal component of photochemical smog Source: chemical reaction of sunlight with primary pollutants emitted from vehicular, industrial and coal emissions – –NOx + VOCs + sunlight -> NOx + O 3 Health Effects - breathing problems, reduced lung function, asthma, irritates eyes, stuffy nose Environmental Effects - ozone can damage plants and trees; smog can cause reduced visibility
 Principal component of photochemical smog Source: chemical reaction of sunlight with primary pollutants emitted from vehicular, industrial and coal emissions – –NOx + VOCs + sunlight -> NOx + O 3 Health Effects - breathing problems, reduced lung function, asthma, irritates eyes, stuffy nose Environmental Effects - ozone can damage plants and trees; smog can cause reduced visibility")
16
16 Tropospheric ozone Source: Ref. (9) This photo shows haze – ozone is invisible but haze commonly occurs at the same time as high ozone levels.
 This photo shows haze – ozone is invisible but haze commonly occurs at the same time as high ozone levels..")
17
17 Frequency & Severity of Air Pollution Depend on: –Local climate and topography –Population density –Amount of industry –Fuels used in industry, heating and transportation

18
18 Temperature Inversions Occurs when a stable layer of warm air overlay cooler air near the ground –Usually happens at night since ground loses heat quickly

19
19

20
20 Heat Islands Heat islands-Urban development creates warm, stable air masses over large cities. –Sparse vegetation and dark surfaces –Concentrates pollutants in a “dust dome”. Rural areas downwind from major industrial areas often have significantly decreased visibility and increased rainfall.

21
21 Stratospheric Ozone Discovered in late 1970s that stratospheric ozone levels were dropping rapidly during September and October. –Occurring since at least 1960. –Human causes: releasing chlorine containing molecules (CFC’s) into the atmosphere Aerosol spray cans (up until 1978) Refrigerants Solvents
 into the atmosphere Aerosol spray cans (up until 1978) Refrigerants Solvents.")
22
22 Destruction of Stratospheric Ozone CFCs persist up in the atmosphere for decades Models indicate that 75-85% of the observed ozone losses in the stratosphere since 1976 are the result of ozone depleting chemicals released in the early 1950s

23
23 Stratospheric Ozone Winds isolate Antarctic air and allows stratospheric temperatures to drop and create ice crystals at high altitudes. –ozone and chlorine molecules are absorbed on the surfaces of these ice particles. When sun returns in the spring and provides energy chlorine molecules are released

24
24

25
25 Harmful effects of UV radiation Skin cancer Cataracts and sun burning Adverse impact on crops and animals Alters photochemical reaction rates Increases smog and surface layer ozone Degradation of paints and plastic material

26
26 Montreal Protocol An international treaty designed to protect the ozone layer Phasing out production of number of substances believed to be responsible for ozone depletion Effective January 1, 1989 –Amended in ‘90, ‘92, and ‘97 As a result CFC production fell 85%

27
27 Global Warming…What is it? Global Warming refers to an average increase in the Earth's temperature, –Which in turn causes changes in climate –Caused by the GREENHOUSE EFFECT

28
28

29
29 Greenhouse Gases The greenhouse gases contribute to holding heat inside our atmosphere. They include: –carbon dioxide (CO 2 ) – methane (CH 4 ) – nitrous oxide (N 2 O) –chlorofluorocarbons (CFCs) –ozone (O 3 ) –water vapor Problems arise when too much of the gases are present; therefore trapping more heat than is necessary.
 – methane (CH 4 ) – nitrous oxide (N 2 O) –chlorofluorocarbons (CFCs) –ozone (O 3 ) –water vapor Problems arise when too much of the gases are present; therefore trapping more heat than is necessary..")
30
30 Current Evidence CO 2 and temperature –Measured by analyzing radioisotopes in rocks, fossils, ocean sediments, ice cores

31
31

32
32

33
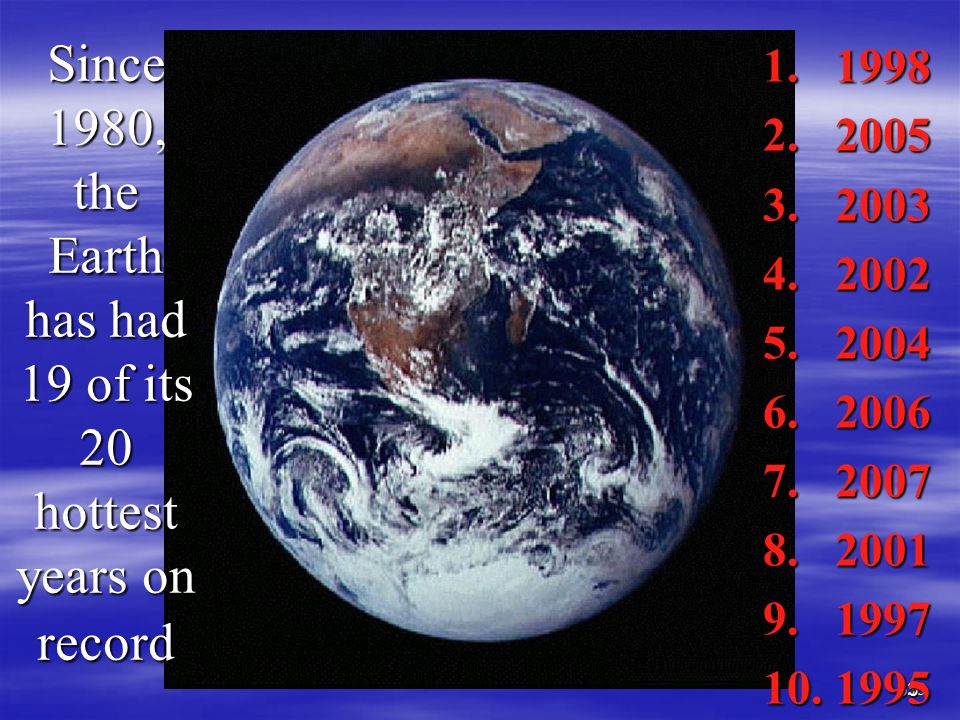
33 Since 1980, the Earth has had 19 of its 20 hottest years on record 1. 1998 2. 2005 3. 2003 4. 2002 5. 2004 6. 2006 7. 2007 8. 2001 9. 1997 10. 1995
34
34 http://web.mit.edu/12.000/www/m2011/finalwebsite/graphics/climate/tempmap1.png

35
35 Evidence CO 2 and Temperature Glaciers

36
36

37
37 Glaciers Have been shrinking throughout the 20th CenturyHave been shrinking throughout the 20th Century Loss of glaciers in South America and Asia glaciers is particularly rapid and will threaten the water supplies of millions of peopleLoss of glaciers in South America and Asia glaciers is particularly rapid and will threaten the water supplies of millions of people

38
38 Evidence CO 2 and Temperature Glaciers Polar Ice –Arctic, Antarctic, Greenland

39
39 Arctic Ice Perennial ice may be 10 or more feet thick New ice is only one to seven feet thick Since 1970 à 10% loss of ice cover per decade

40
40 Sept. 21, 1979 and Sept. 14, 2007

41
41 Energy and the Greenhouse Effect Surfaces that reflect energy have a high albedo (Reflectivity). –Fresh clean snow 90% –Dark soil 3% –Net average of earth 30%

42
42 Albedo Effect

43
43

44
44

45
45

46
46 Permafrost Where soil over 1-meter down never thawsWhere soil over 1-meter down never thaws About 10% of Earth’s surface has permafrostAbout 10% of Earth’s surface has permafrost Tundra and taiga are characterized by extreme coldTundra and taiga are characterized by extreme cold In the last 11,000 years, the permafrost has not thawedIn the last 11,000 years, the permafrost has not thawed –None of the vegetation has decayed –Decay releases CO 2 and methane

47
47 Permafrost Alaska permafrost temperature has increased 0.5° to 1.5° C since 1980, Serious effects include –f–f–f–forest damage –s–s–s–sinking roads and buildings –e–e–e–eroding tundra riverbanks –c–c–c–changes in tundra vegetation –i–i–i–increased carbon dioxide and methane emissions from thawed peat.

48
48 http://benmuse.typepad.com/ben_muse/images/2007/10/10/sinkhole_5.png

49
49 http://www.global-greenhouse-warming.com/images/PermafrostDrunkenForest.jpg

50
50 Permafrost A University of Alaska at Fairbanks team found that the permafrost gave off five times as much methane as previously estimatedA University of Alaska at Fairbanks team found that the permafrost gave off five times as much methane as previously estimated Defrosting could release nearly 1,000 gigatons of carbon stored and hasten global warming.Defrosting could release nearly 1,000 gigatons of carbon stored and hasten global warming. –10 to 25% increase in global warming

51
51 Evidence CO 2 and Temperature Glaciers Polar Ice –Arctic –Antarctic –Greenland Weather Severity

52
52 Droughts The 1999-2002 national drought was one of the three most extensive droughts in the last 40 years In 2002, the Western United States experienced its second worst wildfire season in the last 50 years; more than 7 million acres burned The period from April through June of 1998 was the driest three-month period in 104 years in Florida, Texas, and Louisiana

53
53

54
54

55
55 Objective and Warmup: 1/31/11 Objective: –Determine the consequences of global climate change. Warmup: – As our earth warms, what will happen to the biomes of the world?

56
56 Evidence CO 2 and TemperatureCO 2 and Temperature GlaciersGlaciers Polar IcePolar Ice –Arctic –Antarctic –Greenland Weather SeverityWeather Severity Biome ChangesBiome Changes

57
57

58
58 Oceans absorb CO 2 CO 2 in water makes Carbonic AcidCO 2 in water makes Carbonic Acid Increased CO 2 especially in cold waterIncreased CO 2 especially in cold water As cold deep ocean currents (abyssal) resurface they are release CO 2As cold deep ocean currents (abyssal) resurface they are release CO 2 Greater acidity of oceans is bleaching coralGreater acidity of oceans is bleaching coral
 resurface they are release CO 2As cold deep ocean currents (abyssal) resurface they are release CO 2 Greater acidity of oceans is bleaching coralGreater acidity of oceans is bleaching coral")
59
59 Consequence Cold EuropeCold Europe

60
60 Antarctica Cold water melting from Antarctica's ice cap and icebergs falls to the ocean floor and surges northward, affecting worldwide circulation. Cold water melting from Antarctica's ice cap and icebergs falls to the ocean floor and surges northward, affecting worldwide circulation. Greenland

61
61 Consequence Cold EuropeCold Europe Increased SmogIncreased Smog

62
62

63
63

64
64 Consequence Cold EuropeCold Europe Increased SmogIncreased Smog Spread of Tropical Disease sSpread of Tropical Disease s

65
65

66
66 Consequence Cold EuropeCold Europe Increased SmogIncreased Smog Spread of Tropical DiseasesSpread of Tropical Diseases Changes in BiodiversityChanges in Biodiversity

67
67 Changes in Biodiversity "It is not the strongest of the species that survive, nor the most intelligent, but the most responsive to change." Charles Darwin, 1835 Charles Darwin, 1835

68
68 Changes in Biodiversity Biomes Shift of Alpine biomes up mountains and further North/South

69
69

70
70 Changes in Biodiversity Die-offs Coral bleaching die-offs of up to 50% in the Indian Ocean Biomes Shift of Alpine biomes up mountains and further North/South

71
71 Dire prediction for world's coral reefs POSTED: 1404 GMT (2204 HKT), October 25, 2006 CHARLOTTE AMALIE, U.S. Virgin Islands (AP) Researchers fear more than half the world's coral reefs could die in less than 25 years and say global warming may at least be partly to blame. Sea temperatures are rising, weakening the reefs' resistance to increased pollutants, such as runoff from construction sites and toxins from boat paints. The fragile reefs are hosts to countless marine plants and animals. "Think of it as a high school chemistry class," said Billy Causey, the Caribbean and Gulf Mexico director of the National Oceanic and Atmospheric Administration. "You mix some chemicals together and nothing happens. You crank up the Bunsen burner and all of a sudden things start bubbling around. That's what's happening. That global Bunsen burner is cranking up." Causey was one of some 200 private and government researchers from the Caribbean, Florida and U.S. Pacific islands who gathered in St. Thomas for a meeting of the NOAA's U.S. Coral Reef Task Force. Last year's coral loss in the Caribbean waters supports predictions that 60 percent of the world's coral could die within a quarter century, said Tyler Smith of the University of the Virgin Islands. "Given current rates of degradation of reef habitats, this is a plausible prediction," Smith said. More than 47 percent of the coral in underwater study sites covering 31 acres around the U.S. Virgin Islands died after sea temperatures exceeded the norm for three months in 2005, said Jeff Miller, a scientist with the Virgin Islands National Park. The unusual warm water can stress coral, causing it to lose its pigment and making it more vulnerable to disease. This year, Caribbean coral narrowly avoided another widespread episode of bleaching when sea temperatures briefly surpassed levels considered healthy for reefs. Up to 30 percent of the world's coral reefs have died in the last 50 years, and another 30 percent are severely damaged, said Smith, who studies coral health in the U.S. Virgin Islands and collaborates with researchers globally. "U.S. Virgin Islands coral today is likely at its lowest levels in recorded history," Smith said. The researchers said global warming was a potential cause of the abnormally high sea temperatures but was not the only suspect in the reefs' demise. What causes disease in coral can be hard to pinpoint and could be a combination of things. Other threats include silt runoff from construction sites, which prevents the coral from getting enough sunlight, and a record increase in fleshy, green algae, which competes with coral for sunlight. "Climate change is an important factor that is influencing coral reefs worldwide," said Mark Eakin, director of NOAA's Coral Reef Watch. "It adds to the other problems that we are having."
 Researchers fear more than half the world s coral reefs could die in less than 25 years and say global warming may at least be partly to blame. Sea temperatures are rising, weakening the reefs resistance to increased pollutants, such as runoff from construction sites and toxins from boat paints. The fragile reefs are hosts to countless marine plants and animals. Think of it as a high school chemistry class, said Billy Causey, the Caribbean and Gulf Mexico director of the National Oceanic and Atmospheric Administration. You mix some chemicals together and nothing happens. You crank up the Bunsen burner and all of a sudden things start bubbling around. That s what s happening. That global Bunsen burner is cranking up. Causey was one of some 200 private and government researchers from the Caribbean, Florida and U.S. Pacific islands who gathered in St. Thomas for a meeting of the NOAA s U.S. Coral Reef Task Force. Last year s coral loss in the Caribbean waters supports predictions that 60 percent of the world s coral could die within a quarter century, said Tyler Smith of the University of the Virgin Islands. Given current rates of degradation of reef habitats, this is a plausible prediction, Smith said. More than 47 percent of the coral in underwater study sites covering 31 acres around the U.S. Virgin Islands died after sea temperatures exceeded the norm for three months in 2005, said Jeff Miller, a scientist with the Virgin Islands National Park. The unusual warm water can stress coral, causing it to lose its pigment and making it more vulnerable to disease. This year, Caribbean coral narrowly avoided another widespread episode of bleaching when sea temperatures briefly surpassed levels considered healthy for reefs. Up to 30 percent of the world s coral reefs have died in the last 50 years, and another 30 percent are severely damaged, said Smith, who studies coral health in the U.S. Virgin Islands and collaborates with researchers globally. U.S. Virgin Islands coral today is likely at its lowest levels in recorded history, Smith said. The researchers said global warming was a potential cause of the abnormally high sea temperatures but was not the only suspect in the reefs demise. What causes disease in coral can be hard to pinpoint and could be a combination of things. Other threats include silt runoff from construction sites, which prevents the coral from getting enough sunlight, and a record increase in fleshy, green algae, which competes with coral for sunlight. Climate change is an important factor that is influencing coral reefs worldwide, said Mark Eakin, director of NOAA s Coral Reef Watch. It adds to the other problems that we are having. .")
72
72 Ocean acidification due to increasing atmospheric carbon dioxide 30 Jun 2005 Carbon dioxide (CO 2 ) emitted to the atmosphere by human activities is being absorbed by the oceans, making them more acidic (lowering the pH the measure of acidity). Evidence indicates that emissions of carbon dioxide from human activities over the past 200 years have already led to a reduction in the average pH of surface seawater of 0.1 units and could fall by 0.5 units by the year 2100. This pH is probably lower than has been experienced for hundreds of millennia and, critically, at a rate of change probably 100 times greater than at any time over this period. The report outlines our best understanding of the impacts of these chemical changes on the oceans. The impacts will be greater for some regions and ecosystems, and will be most severe for coral reefs and the Southern Ocean. The impacts of ocean acidification on other marine organisms and ecosystems are much less certain. We recommend a major international research effort be launched into this relatively new area of research. We recommend that action needs to be taken now to reduce global emissions of CO 2 from human activities to the atmosphere to avoid the risk of irreversible damage from ocean acidification.

73
73 Acidification may also directly affect the growth and reproduction rates of fish, as well as affecting the plankton populations which they rely on for food, with potentially disastrous consequences for marine food webs. In addition, nutrient concentrations in surface waters of high-latitude regions are likely to fall, subsurface waters become less oxygenated, and phytoplankton will experience increased exposure to sunlight. This could affect multiple marine species and change the composition of biological communities in ways that are not yet understood. Probe into rising ocean acidity Tuesday, 17 August, 2004

74
74 Changes in Biodiversity Die-offs Extinctions Coral bleaching die-offs of up to 50% in the Indian Ocean Golden Toads, Harlequin Frogs,... Biomes Shift of Alpine biomes up mountains and further North/South

75
75 Global Warming Already Causing Extinctions, Scientists Say Hannah Hoag for National Geographic News November 28, 2006 National Geographic NewsNational Geographic News In Costa Rica about 2/3 of the 110 known Harlequin frog species are extinctIn Costa Rica about 2/3 of the 110 known Harlequin frog species are extinct

76
76 Global Warming Already Causing Extinctions, Scientists Say Hannah Hoag for National Geographic News November 28, 2006 National Geographic NewsNational Geographic News In Antarctica, the Adélie penguin on Litchfield Island has disappeared.In Antarctica, the Adélie penguin on Litchfield Island has disappeared.

77
77 Changes in Biodiversity Die-offs Extinctions Life Cycles Coral bleaching die-offs of up to 50% in the Indian Ocean Golden Toads, Harlequin Frogs,... Gothic marmots emerge from hibernation about a month earlier than 30 years ago Biomes Shift of Alpine biomes up mountains and further North/South

78
78 Changes in Biodiversity Die-offs Extinctions Life CyclesPhysiology Coral bleaching die-offs of up to 50% in the Indian Ocean Golden Toads, Harlequin Frogs,... Gothic marmots emerge from hibernation about a month earlier than 30 years ago The average weight of adult female polar bears has decreased by more than 20% over the last 25 years Biomes Shift of Alpine biomes up mountains and further North/South

79
79 Global Warming Already Causing Extinctions, Scientists Say Hannah Hoag for National Geographic News November 28, 2006 National Geographic NewsNational Geographic News Polar bears depend on icePolar bears depend on ice Without the ice, the polar bear will die

80
80

81
81 Changes in Biodiversity Die-offs Extinctions Life CyclesPhysiology Coral bleaching die-offs of up to 50% in the Indian Ocean Golden Toads, Harlequin Frogs,... Gothic marmots emerge from hibernation about a month earlier than 30 years ago The average weight of adult female polar bears has decreased by more than 20% over the last 25 years Biomes Shift of Alpine biomes up mountains and further North/South Migration Multiple areas affected

82
82 Routes farther North European Bee-Eaters (Merops apiaster) once very rare in Germany are now breeding regularly across the country. The Rosy-Breasted Trumpeter Finch (Rhodopechys githaginea) is one of many birds once normally confined to arid North Africa and the Middle East now found in increasingly large numbers in southern Spain.
 is one of many birds once normally confined to arid North Africa and the Middle East now found in increasingly large numbers in southern Spain..")
83
83 Habitat Changes Habitat Changes Permafrost is thawing and Arctic tundra is being replaced by forest Desertification is occurring in Africa Sea levels are rising Hurricanes are more frequent in the Caribbean Antarctic waters are getting warmer and the ice is melting affecting sea salinity

84
84 Habitat Changes There is likely to be a general shift of species towards the poles, reducing the range of species most adapted to colder waters. The Common Dolphin, a warm water species is increasing its range The White-beaked Dolphin’s range is reducing. Predators are following their prey as prey species (eg fish) change their mean latitude and/or depth.
 change their mean latitude and/or depth..")
85
85 Consequence Cold EuropeCold Europe Increased SmogIncreased Smog Spread of Tropical DiseasesSpread of Tropical Diseases Changes in BiodiversityChanges in Biodiversity Droughts and firesDroughts and fires

86
86

87
87

88
88 Consequence Cold EuropeCold Europe Increased SmogIncreased Smog Spread of Tropical DiseasesSpread of Tropical Diseases Changes in BiodiversityChanges in Biodiversity Droughts and firesDroughts and fires Sea levels riseSea levels rise

89
89

90
90 U.S. East Coast during Ice Age - 20,000 years ago (400 feet below today)
")
91
91 U.S. East Coast – if West sheet or Greenland melted (17-foot)
")
92
92 U.S. East Coast – if East sheet melted (170-foot)
")
93
93 Florida during Ice Age - 20,000 years ago (400 feet below today)
")
94
94 Florida – if West sheet or Greenland melted (17-foot rise)
")
95
95 Florida – if East sheet melted (170-foot/50m rise)
")
96
96 Positive Feedback

97
97 Positive Feedback Oceans currents and CO 2 levelsOceans currents and CO 2 levels –Cold deep resurface and emit CO 2 Permafrost meltingPermafrost melting –CO 2 and methane released by decomposition Arctic ice meltingArctic ice melting –Less reflection of sunlight – water and land heat up DesertificationDesertification –Soil dries out and releases CO 2

98
98 Why do WE need to Reduce? Global Warming is a factGlobal Warming is a fact China and India will soon surpass U.S.A. in Greenhouse gas emissionChina and India will soon surpass U.S.A. in Greenhouse gas emission If we do nothing, they will continue to do nothing (The Economist 9/9/06)If we do nothing, they will continue to do nothing (The Economist 9/9/06)
If we do nothing, they will continue to do nothing (The Economist 9/9/06).")
99
99

100
100 What can we do? Build GreenBuild Green

101
101 Build Green Build Green

102
102 What can we do? Build GreenBuild Green Use Electricity not from Fossil FuelsUse Electricity not from Fossil Fuels

103
103 Green Electricity

104
104 Deep Heat Mining http://www.dhm.ch/dhm.html and http://www.boston.com/news/globe/health_science/articles/2007/01/29/the_power_of_rocks/?p1=email_to_a_friend http://www.dhm.ch/dhm.htmlhttp://www.boston.com/news/globe/health_science/articles/2007/01/29/the_power_of_rocks/?p1=email_to_a_friend http://www.dhm.ch/dhm.htmlhttp://www.boston.com/news/globe/health_science/articles/2007/01/29/the_power_of_rocks/?p1=email_to_a_friend Geothermal energy is the only renewable source of energy which can be tapped year round and no need of storage facilitiesGeothermal energy is the only renewable source of energy which can be tapped year round and no need of storage facilities

105
105 What can we do? Build GreenBuild Green Use Electricity not from Fossil FuelsUse Electricity not from Fossil Fuels Hydrogen or Solar-Powered VehiclesHydrogen or Solar-Powered Vehicles

106
106 Hydrogen Powered Vehicles

107
107 What can we do? Build GreenBuild Green Use Electricity not from Fossil FuelsUse Electricity not from Fossil Fuels Hydrogen Powered VehiclesHydrogen Powered Vehicles Invest in Green CompaniesInvest in Green Companies

108
108 Invest Green Financial Analyst Journal Annual Return 1995 to 2003Annual Return 1995 to 2003 Portfolio of CompaniesPortfolio of Companies –Non Green Companies – 8.9% –Green Companies – 12.2%

109
109 What can we do? Build GreenBuild Green Use Electricity not from Fossil FuelsUse Electricity not from Fossil Fuels Hydrogen Powered VehiclesHydrogen Powered Vehicles Invest in GreenInvest in Green Remove the CO 2 from the AtmosphereRemove the CO 2 from the Atmosphere

110
110 Carbon Sequestration http://sequestration.mit.edu/technology_overview/index.html http://sequestration.mit.edu/technology_overview/index.html Three primary types of carbon sequestration.Three primary types of carbon sequestration. –Enhancing natural processes (Plant a tree) –Carbon dioxide capture and storage –Baking Soda
 –Carbon dioxide capture and storage –Baking Soda.")
111
111 Carbon Sequestration http://sequestration.mit.edu/technology_overview/index.html http://sequestration.mit.edu/technology_overview/index.html The Sleipner project in Norway's North Sea is the world's first commercial carbon dioxide capture and storage project Started in 1996, it sequesters about one million metric tons of carbon dioxide each year http://www.statoil.com/STATOILCOM/SVG00990.NSF/web/sleipneren?opendocument http://www.statoil.com/STATOILCOM/SVG00990.NSF/web/sleipneren?opendocument http://www.statoil.com/STATOILCOM/SVG00990.NSF/web/sleipneren?opendocument

112
112 Can Baking Soda curb Global Warming? Staff Writer, CNET News.com November 27, 2007, 4:00 AM PST “Jones, the founder and CEO of Skyonic, has come up with an industrial process called SkyMine that captures 90 percent of the carbon dioxide coming out of smoke stacks and mixes it with sodium hydroxide to make sodium bicarbonate, or baking soda. The energy required for the reaction to turn the chemicals into baking soda comes from the waste heat from the factory. The system also removes 97 percent of the heavy metals, as well as most of the sulfur and nitrogen compounds, Jones said.”

113
113

114
114 What can we do? Build GreenBuild Green Use Electricity not from Fossil FuelsUse Electricity not from Fossil Fuels Hydrogen Powered VehiclesHydrogen Powered Vehicles Invest in Green CompaniesInvest in Green Companies Remove the CO 2 from the AtmosphereRemove the CO 2 from the Atmosphere Encourage Ratification of Kyoto ProtocolEncourage Ratification of Kyoto Protocol

115
115 Goals of Kyoto Protocol Reduction of greenhouse gases to below 1990 levels: 5.2% world wide reduction on average by 2008-2012 6% for Canada by 2008-2012 When sufficient countries ratify the Protocol (at least 55 countries comprising at least 55% of emissions), Protocol comes into effect USA - 25% of emissions
, Protocol comes into effect USA - 25% of emissions")
116
116 What can we do? Build GreenBuild Green Use electricity not from fossil fuelsUse electricity not from fossil fuels Hydrogen Powered VehiclesHydrogen Powered Vehicles Invest in Green CompaniesInvest in Green Companies Remove the CO 2 from the AtmosphereRemove the CO 2 from the Atmosphere Encourage Ratification of Kyoto ProtocolEncourage Ratification of Kyoto Protocol Cut back on the eating of Red MeatCut back on the eating of Red Meat

117
117 Cattle and Methane Cattle and other ruminant animalsCattle and other ruminant animals –Methane is by-product of digestion Organisms in their stomachs break down fiber in grasses and grains they eatOrganisms in their stomachs break down fiber in grasses and grains they eat Methane is 20 to 60 times as strong of a greenhouse gas as CO 2Methane is 20 to 60 times as strong of a greenhouse gas as CO 2

118
118 Environmental Protection Agency Methane Source 2003 Fossil Fuel Production 37.6% Landfills and Wastewater Treatment 30.8% Cattle28.3% Other3.3% Total for U.S. 100%

119
119 Objective and Warmup: 2/2/11 Objective: –Analyze how the carbon cycle has been disrupted. –Identify ways society can prevent atmospheric carbon dioxide levels from continuing to rise in the future Warmup: –How do global warming and ozone depletion interact with radiation? Greenhouse gases absorb Infra-red radiation reflected from surface and release heat into lower troposphere ~95% UV radiation from sun absorbed by ozone

120
120 Objective and Warmup: 2/3/11 Objective: Warmup: –Which hemisphere (Northern or Southern) would be most effected by global warming? Why?

121
121 Acid Rain Occurs when sulfur dioxide and nitrogen oxides are emitted into the atmosphereOccurs when sulfur dioxide and nitrogen oxides are emitted into the atmosphere –Coal burning plants –Automobiles Absorbed by water droplets in cloudsAbsorbed by water droplets in clouds Precipitation cause damage toPrecipitation cause damage to –Lakes –Vegetation –Buildings

122
122 Measuring Acid Rain Measured by pH scale.Measured by pH scale. Normal rain is slightly acidic and has a pH of about 5.6 In 2000, the most acidic rain falling in the US had a pH of about 4.3.In 2000, the most acidic rain falling in the US had a pH of about 4.3.

123
123 2 Forms of Acid Rain Wet deposition-acidic rain, fog, snow and cloud vapor –Falls in downward winds areas within 4-14 days Dry deposition-acidic particles –Falls near the emission sources within 2-3 days

124
124 Causes of Acid Rain Sulfur dioxide (SO 2 ) and nitrogen oxides (NO x ) are the primary causes of acid rain.Sulfur dioxide (SO 2 ) and nitrogen oxides (NO x ) are the primary causes of acid rain. In the US, about 2/3 of all SO 2 and 1/4 of all NO x comes from electric power generation that relies on burning fossil fuels like coal.In the US, about 2/3 of all SO 2 and 1/4 of all NO x comes from electric power generation that relies on burning fossil fuels like coal.

125
125 Fossil fuels Power plants Industrial emissions Auto emissions Primary Pollutants SO 2 NO 2 Secondary Pollutants H 2 SO 4 HNO 2 sulfuric acidnitric acid soils leaching of minerals vegetation direct toxicity indirect health effects water sediments leaching aluminum acidic precipitation

126
126 Acid Rain

127
127 Increased Acidity Dry deposited particles can also be washed from trees and other surfaces by rainstorms.Dry deposited particles can also be washed from trees and other surfaces by rainstorms. The runoff water adds those acids to the acid rain, making the combination more acidic than the falling rain alone.The runoff water adds those acids to the acid rain, making the combination more acidic than the falling rain alone.

128
128 Effects of Acid Rain The strength of the effects depend on many factorsThe strength of the effects depend on many factors –How acidic the water is –The chemistry and buffering capacity of the soils involved –The types of fish, trees, and other living things that rely on the water

129
129 Effects of Acid Rain Damage to forests and soils, fish and other living things, materials, and human health. Visibility reduction Effects of acid rain are most clearly seen in the aquatic environments Generally, the young of most species are more sensitive to environmental conditions than adults.Generally, the young of most species are more sensitive to environmental conditions than adults. At pH 5, most fish eggs cannot hatch.At pH 5, most fish eggs cannot hatch. At lower pH levels, some adult fish die.At lower pH levels, some adult fish die. http://cica.indiana.edu/projects/Biology/movies.html

130
130

131
131 Buffering Capacity Acid rain primarily affects sensitive bodies of water, which are located in watersheds whose soils have a limited “buffering capacity”Acid rain primarily affects sensitive bodies of water, which are located in watersheds whose soils have a limited “buffering capacity” Lakes and streams become acidic when the water itself and its surrounding soil cannot buffer the acid rain enough to neutralize it.Lakes and streams become acidic when the water itself and its surrounding soil cannot buffer the acid rain enough to neutralize it.

132
132 In areas where buffering capacity is low, acid rain also releases aluminum from soils into lakes and streamsIn areas where buffering capacity is low, acid rain also releases aluminum from soils into lakes and streams Aluminum is highly toxic to many species of aquatic organisms.Aluminum is highly toxic to many species of aquatic organisms. http://home.earthlink.net/~photofish/fish_photos/sw10_thumb.jpg

133
133 Reducing the Threat of Outdoor Air Pollution Cut fossil fuel usage (especially coal) Transfer energy efficiency and renewable energy sources to developing countries Reduce deforestation Use sustainable agriculture Slow population growth Remove CO2 from smokestacks and vehicle emissions Need for reduction of greenhouse gases
 Transfer energy efficiency and renewable energy sources to developing countries Reduce deforestation Use sustainable agriculture Slow population growth Remove CO2 from smokestacks and vehicle emissions Need for reduction of greenhouse gases")
134
134 Indoor Air Pollution EPA found indoor concentrations of toxic air pollutants are often higher than outdoor. –People generally spend more time indoors.

135
135 Important Indoor Air pollutants Nitrogen dioxide Carbon monoxide Formaldehyde Volatile Organic Compounds (VOCs) House dust mites (and other allergens, e.g. from pets) Environmental tobacco smoke Fine particles Chlorinated organic compounds (e.g. pesticides) Asbestos and man-made mineral fibres Radon
 Environmental tobacco smoke Fine particles Chlorinated organic compounds (e.g. pesticides) Asbestos and man-made mineral fibres Radon.")
136
136 Asbestos Several different fibrous forms of silicate minerals widely used since the 1940s – –Used for fireproofing, insulation of heaters and pipes, soundproofing Negative effects: – –If breathed it can remain in lungs for years – –Can cause asbestosis – –Can cause mesothelioma

137
137Radon Radon 222- a colorless, odorless, tasteless, naturally occurring radioactive gas produced by the radioactive decay of uranium-238 Can cause lung cancer Lifetime exposure in a home responsible for 13,600 deaths a yr. Fig. 17-18 p. 436

138
138 Indoor Air Pollution Fig. 17-17 p. 434

139
139 Sick Building Syndrome Flu-like symptoms from indoor pollution a building is “sick” when at least 20% of its occupants suffer persistent symptoms that stop when they go outside –no specific illness or cause can be identified –Causes: Inadequate ventilation Chemical contaminants Biological contaminants

140
140 Reducing indoor air pollution Ban smoking or limit to well ventilated areas Set stricter formaldehyde emission standards Prevent radon infiltration Increase intake of outside air Use machines in well ventilated areas Circulate buildings air through rooftop greenhouses Use less polluting harmful cleaning agents, paints and other products

141
141 Air Pollution Prevention: Specific Air Pollution Treatment Technology Traditional –Move factory to remote location –Build taller smokestack so wind blows pollution elsewhere New – –Electrostatic precipitators: Electrostatically charged surfaces attracts particles –Biofiltration : vapors pumped through soil where microbes degrade –High-energy destruction: high-voltage electricity –Membrane separation: diffusion of organic vapors through membrane –Oxidation: High temperature combustor

142
142 Clean Air Legislation Clean Air Act 1963 –Amended in 1970: 6 criteria pollutants –Primary standard-set to protect human health –Secondary standard-set to prevent environmental and property damage In 1990: cap and trade system –companies buy and sell "emission allowances" for a particular pollutant –Government sets standards

Similar presentations


 smoke from cars and factories release the chemicals.>")