Download presentation
Presentation is loading. Please wait.

1
Journal Club 亀田メディカルセンター 糖尿病内分泌内科 Diabetes and Endocrine Department, Kameda Medical Center 松田 昌文 Matsuda, Masafumi 2008 年2月 14 日 8:20-8:50 B 棟8階 カンファレンス室

2
TOPICS

3
糖尿病腎症による透析患者が 8 万人( 264473 人中) 新規導入の4割以上が糖尿病腎症
 新規導入の4割以上が糖尿病腎症")
4
For Safety, NHLBI Changes Intensive Blood Sugar Treatment Strategy in Clinical Trial of Diabetes and Cardiovascular Disease The National Heart, Lung, and Blood Institute (NHLBI) of the National Institutes of Health has stopped one treatment within a large, ongoing North American clinical trial of diabetes and cardiovascular disease 18 months early due to safety concerns after review of available data, although the study will continue. In this trial of adults with type 2 diabetes at especially high risk for heart attack and stroke, the medical strategy to intensively lower blood glucose (sugar) below current recommendations increased the risk of death compared with a less-intensive standard treatment strategy. Study participants receiving intensive blood glucose lowering treatment will now receive the less-intensive standard treatment. The ACCORD (Action to Control Cardiovascular Risk in Diabetes) study enrolled 10,251 participants. Of these, 257 in the intensive treatment group have died, compared with 203 within the standard treatment group. This is a difference of 54 deaths, or 3 per 1,000 participants each year, over an average of almost four years of treatment. The death rates in both groups were lower than seen in similar populations in other studies.
 below current recommendations increased the risk of death compared with a less-intensive standard treatment strategy. Study participants receiving intensive blood glucose lowering treatment will now receive the less-intensive standard treatment. The ACCORD (Action to Control Cardiovascular Risk in Diabetes) study enrolled 10,251 participants. Of these, 257 in the intensive treatment group have died, compared with 203 within the standard treatment group. This is a difference of 54 deaths, or 3 per 1,000 participants each year, over an average of almost four years of treatment. The death rates in both groups were lower than seen in similar populations in other studies..")
6
N Engl J Med 2008;358:580-91. Steno-2 Study

8
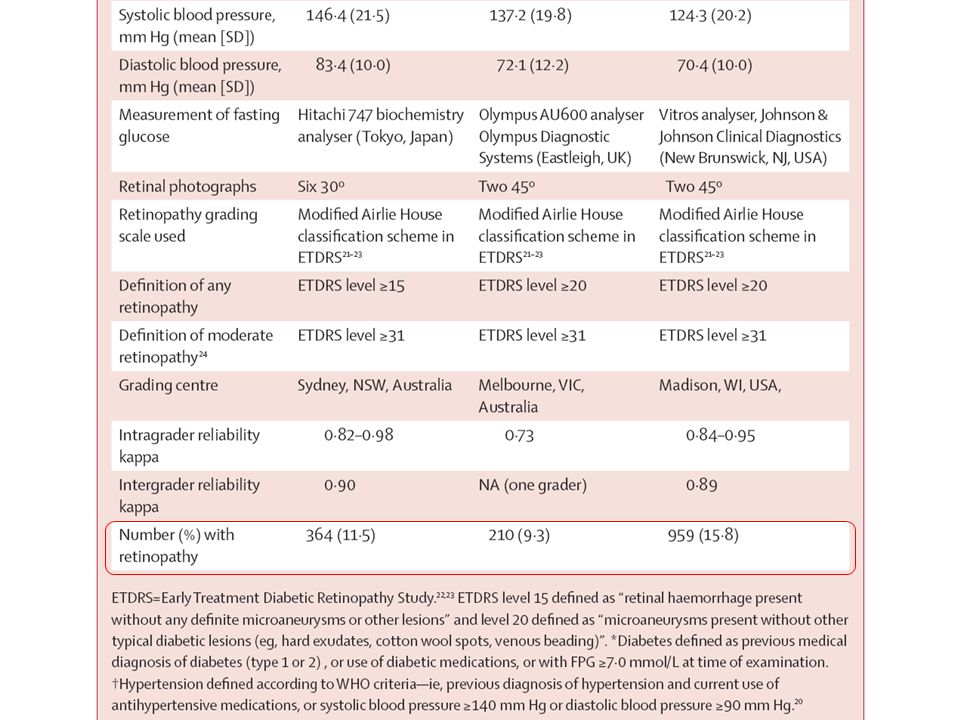
Lancet 2008; 371: 736–43 Centre for Eye Research Australia, University of Melbourne, VIC, Australia (Prof T Y Wong MD, J J Wang PhD); International Diabetes Institute, VIC, Australia (Prof T Y Wong, R J Tapp PhD, Prof P Zimmet MD, J Shaw MD); Singapore Eye Research Institute, Yong Loo Lin School of Medicine, National University of Singapore, Singapore (Prof T Y Wong); Department of Ophthalmology, Centre for Vision Research, University of Sydney, NSW, Australia (G Liew MBBS, J J Wang, Prof P Mitchell MD); Department of Epidemiology and Preventive Medicine, Monash University, VIC, Australia (R J Tapp); Graduate Studies Program in Epidemiology, School of Medicine, Federal University of Rio Grande do Sul, Porto Alegre, RS, Brazil (Prof M Ines Schmidt MD); and Department of Ophthalmology and Visual Science, University of Wisconsin, WI, USA (Prof R Klein MD, Prof B E K Klein MD) Correspondence to: Prof Tien Y Wong, Centre for Eye Research Australia, University of Melbourne, East Melbourne, VIC 3002, Australia twong@unimelb.edu.au
; International Diabetes Institute, VIC, Australia (Prof T Y Wong, R J Tapp PhD, Prof P Zimmet MD, J Shaw MD); Singapore Eye Research Institute, Yong Loo Lin School of Medicine, National University of Singapore, Singapore (Prof T Y Wong); Department of Ophthalmology, Centre for Vision Research, University of Sydney, NSW, Australia (G Liew MBBS, J J Wang, Prof P Mitchell MD); Department of Epidemiology and Preventive Medicine, Monash University, VIC, Australia (R J Tapp); Graduate Studies Program in Epidemiology, School of Medicine, Federal University of Rio Grande do Sul, Porto Alegre, RS, Brazil (Prof M Ines Schmidt MD); and Department of Ophthalmology and Visual Science, University of Wisconsin, WI, USA (Prof R Klein MD, Prof B E K Klein MD) Correspondence to: Prof Tien Y Wong, Centre for Eye Research Australia, University of Melbourne, East Melbourne, VIC 3002, Australia")
9
The WHO and American Diabetes Association criteria for diagnosing diabetes mellitus assume the presence of a glycaemic threshold with high sensitivity for identifying retinopathy. However, this assumption is based on data from three previous studies that had important limitations in detecting retinopathy. We aimed to provide updated data for the relation between fasting plasma glucose (FPG) and retinopathy, and to assess the diagnostic accuracy of current FPG thresholds in identifying both prevalent and incident retinopathy. Background
 and retinopathy, and to assess the diagnostic accuracy of current FPG thresholds in identifying both prevalent and incident retinopathy. Background.")
10
Prevalence of retinopathy by deciles of the distribution of FPG, 2-h PG, and HbA 1c in Pima Indians (A) described by McCance et al., in Egyptians (B) described by Engelgau et al., and in 40- to 74-year-old participants in NHANES III (C) (K. Flegal, National Center for Health Statistics, personal communication). The x-axis labels indicate the lower limit of each decile group. Note that these deciles and the prevalence rates of retinopathy differ considerably among the studies, especially the Egyptian study, in which diabetic subjects were oversampled. Retinopathy was ascertained by different methods in each study; therefore, the absolute prevalence rates are not comparable between studies, but their relationships with FPG, 2-h PG, and HbA 1c are very similar within each population. McCance DR, Hanson RL, Charles MA, Jacobsson LTH, Pettitt DJ, Bennett PH, Knowler WC: Comparison of tests for glycated haemoglobin and fasting and two hour plasma glucose concentrations as diagnostic methods for diabetes. BMJ 308:1323–1328, 1994[Abstract/Full Text][Abstract/Full Text] Engelgau MM, Thompson TJ, Herman WH, Boyle JP, Aubert RE, Kenny SJ, Badran A, Sous ES, Ali MA: Comparison of fasting and 2-hour glucose and HbA 1c levels for diagnosing diabetes: diagnostic criteria and Care 21 [Suppl. 2]:B1–B167, 1998 The American Diabetes Association, Alexandria, Virginia. Originally approved 1997. Modified in 1999 based on the Proceedings of the Fourth International Workshop- Conference on Gestational Diabetes Mellitus Pima Indians (cross sectional, n=960), aged 25 years or above 1,018 Egyptians > or = 20 years of age In the NHANES III, 2,821 individuals aged 40–74 years
. The x-axis labels indicate the lower limit of each decile group. Note that these deciles and the prevalence rates of retinopathy differ considerably among the studies, especially the Egyptian study, in which diabetic subjects were oversampled. Retinopathy was ascertained by different methods in each study; therefore, the absolute prevalence rates are not comparable between studies, but their relationships with FPG, 2-h PG, and HbA 1c are very similar within each population. McCance DR, Hanson RL, Charles MA, Jacobsson LTH, Pettitt DJ, Bennett PH, Knowler WC: Comparison of tests for glycated haemoglobin and fasting and two hour plasma glucose concentrations as diagnostic methods for diabetes. BMJ 308:1323–1328, 1994[Abstract/Full Text][Abstract/Full Text] Engelgau MM, Thompson TJ, Herman WH, Boyle JP, Aubert RE, Kenny SJ, Badran A, Sous ES, Ali MA: Comparison of fasting and 2-hour glucose and HbA 1c levels for diagnosing diabetes: diagnostic criteria and Care 21 [Suppl. 2]:B1–B167, 1998 The American Diabetes Association, Alexandria, Virginia. Originally approved Modified in 1999 based on the Proceedings of the Fourth International Workshop- Conference on Gestational Diabetes Mellitus Pima Indians (cross sectional, n=960), aged 25 years or above 1,018 Egyptians > or = 20 years of age In the NHANES III, 2,821 individuals aged 40–74 years.")
11
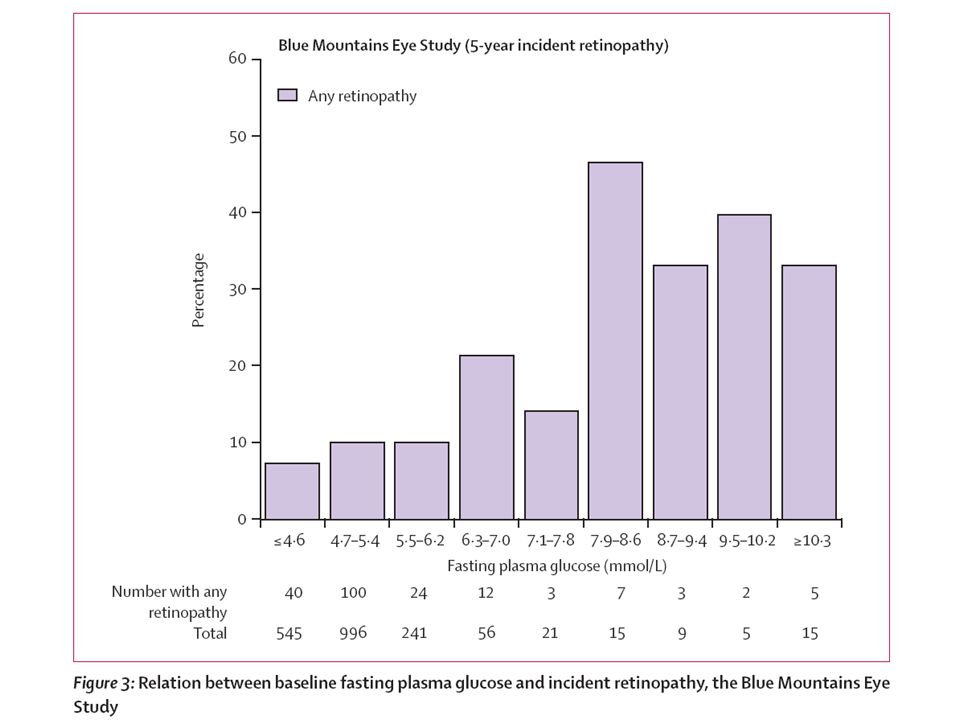
We examined the data from three cross- sectional adult populations: those in the Blue Mountains Eye Study (BMES, Australia, n=3162), the Australian Diabetes, Obesity and Lifestyle Study (AusDiab, Australia, n=2182), and the Multi-Ethnic Study of Atherosclerosis (MESA, USA, n=6079). Retinopathy was diagnosed from multiple retinal photographs of each eye, and graded according to the modified Airlie House Classification system. Plasma glucose concentrations were measured from fasting venous blood samples. Methods

14
Figure 1: Relation between fasting plasma glucose and retinopathy Intervals chosen to include the traditional diabetes cutoff s of 7 ・ 0 and 7 ・ 8 mmol/L. To convert from mmol/L to mg/dL, multiply by 18.

15
Figure 2: Receiver operating characteristic (ROC) curves for fasting plasma glucose (mmol/L) and prevalent retinopathy (A)Blue Mountains Eye Study. (B)Australian Diabetes, Obesity and Lifestyle Study. (C)Multi-Ethnic Study of Atherosclerosis.
Australian Diabetes, Obesity and Lifestyle Study. (C)Multi-Ethnic Study of Atherosclerosis..")
19
The overall prevalence of retinopathy was 11 ・ 5% in BMES (95% CI 10 ・ 4–12 ・ 6%), 9 ・ 6% in AusDiab (8 ・ 4–10 ・ 9), and 15 ・ 8% in MESA (14 ・ 9–16 ・ 7). However, we found inconsistent evidence of a uniform glycaemic threshold for prevalent and incident retinopathy, with analyses suggesting a continuous relation. The widely used diabetes FPG cutoff of 7 ・ 0 mmol/L or higher had sensitivity less than 40% (range 14 ・ 8–39 ・ 1) for detecting retinopathy, with specificity between 80 ・ 8% and 95 ・ 8%. The area under receiver operating characteristic curves for FPG and retinopathy was low and ranged from 0 ・ 56 to 0 ・ 61. Summary
 for detecting retinopathy, with specificity between 80 ・ 8% and 95 ・ 8%. The area under receiver operating characteristic curves for FPG and retinopathy was low and ranged from 0 ・ 56 to 0 ・ 61. Summary.")
20
We saw no evidence of a clear and consistent glycaemic threshold for the presence or incidence of retinopathy across different populations. The current FPG cutoff of 7 ・ 0 mmol/L used to diagnose diabetes did not accurately identify people with and without retinopathy. These findings suggest that the criteria for diagnosing diabetes could need reassessment. Conclusion: Interpretation

22
Lancet 2008; 371: 569–78 Department of Surgery, School of Cancer Studies, University of Manchester, UK (A G Renehan PhD); Evidence for Population Health Unit, University of Manchester, UK (M Tyson PhD, R F Heller MD); Institute of Social and Preventive Medicine (ISPM), University of Bern, Switzerland (M Egger MD, M Zwahlen PhD); and Department of Social Medicine, University of Bristol, UK (M Egger) Correspondence to: Dr Andrew Renehan, Department of Surgery, University of Manchester, Christie Hospital NHS Foundation Trust, Wilmslow Road, Manchester M20 4BX, UK arenehan@picr.man.ac.uk
; Evidence for Population Health Unit, University of Manchester, UK (M Tyson PhD, R F Heller MD); Institute of Social and Preventive Medicine (ISPM), University of Bern, Switzerland (M Egger MD, M Zwahlen PhD); and Department of Social Medicine, University of Bristol, UK (M Egger) Correspondence to: Dr Andrew Renehan, Department of Surgery, University of Manchester, Christie Hospital NHS Foundation Trust, Wilmslow Road, Manchester M20 4BX, UK")
23
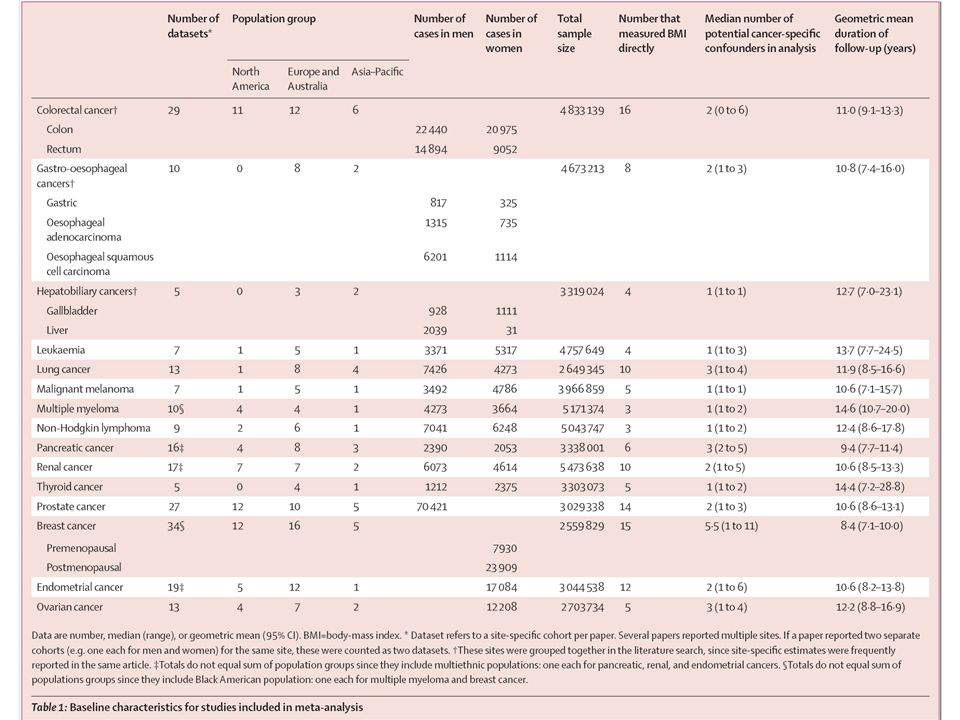
Excess bodyweight, expressed as increased body-mass index (BMI), is associated with the risk of some common adult cancers. We did a systematic review and meta-analysis to assess the strength of associations between BMI and different sites of cancer and to investigate differences in these associations between sex and ethnic groups. Background

24
参考:肥満に関連する健康障害として考慮する が,診断基準に含めない項目 1) 扁桃肥大 2) 気管支喘息 3) 胆石 4) 膵炎 5) 蛋白尿,腎機能障害 6) 子宮筋腫 7) 悪性腫瘍 ①乳癌,②胆嚢癌,③大腸癌 ,④子宮内膜癌(子宮体癌),⑤前立腺癌 8) 偽性黒色表皮腫 9) 摩擦疹,汗疹などの皮膚炎 【肥満症】 定義 肥満症とは肥満に起因ないし関連する健康障害を合併するか,その合併が予測される場合で,医学 的に減量を必要とする病態をいい,疾患単位として取り扱う。 診断 肥満と判定されたもの (BMI 25 以上 ) のうち,以下のいずれかの条件を満たすもの 1) 肥満に起因ないし関連し減量を要する(減量により改善する, または進展が防止される)健康障 害を有するもの 2) 健康障害をともないやすいハイリスク肥満 身体計測のスクリーニングにより上半身肥満を疑われ,腹部 CT 検査によって確定診断された内臓 脂肪型肥満 肥満に起因ないし関連し,減量を要する健康障 害: 1) 2型糖尿病・耐糖能障害 2) 脂質代謝異常 3) 高血圧 4) 高尿酸血症・痛風 5) 冠動脈疾患:心筋梗塞・狭心症 6) 脳梗塞:脳血栓症・一過性脳虚血発作 7) 睡眠時無呼吸症候群・ Pickwick 症候群 8) 脂肪肝 9) 整形外科的疾患:変形性関節症・腰椎症 10) 月経異常 日本肥満学会
 扁桃肥大 2) 気管支喘息 3) 胆石 4) 膵炎 5) 蛋白尿,腎機能障害 6) 子宮筋腫 7) 悪性腫瘍 ①乳癌,②胆嚢癌,③大腸癌 ,④子宮内膜癌(子宮体癌),⑤前立腺癌 8) 偽性黒色表皮腫 9) 摩擦疹,汗疹などの皮膚炎 【肥満症】 定義 肥満症とは肥満に起因ないし関連する健康障害を合併するか,その合併が予測される場合で,医学 的に減量を必要とする病態をいい,疾患単位として取り扱う。 診断 肥満と判定されたもの (BMI 25 以上 ) のうち,以下のいずれかの条件を満たすもの 1) 肥満に起因ないし関連し減量を要する(減量により改善する, または進展が防止される)健康障 害を有するもの 2) 健康障害をともないやすいハイリスク肥満 身体計測のスクリーニングにより上半身肥満を疑われ,腹部 CT 検査によって確定診断された内臓 脂肪型肥満 肥満に起因ないし関連し,減量を要する健康障 害: 1) 2型糖尿病・耐糖能障害 2) 脂質代謝異常 3) 高血圧 4) 高尿酸血症・痛風 5) 冠動脈疾患:心筋梗塞・狭心症 6) 脳梗塞:脳血栓症・一過性脳虚血発作 7) 睡眠時無呼吸症候群・ Pickwick 症候群 8) 脂肪肝 9) 整形外科的疾患:変形性関節症・腰椎症 10) 月経異常 日本肥満学会")
25
We did electronic searches on Medline and Embase (1966 to November 2007), and searched reports to identify prospective studies of incident cases of 20 cancer types. We did random-effects meta-analyses and meta-regressions of study-specific incremental estimates to determine the risk of cancer associated with a 5 kg/m 2 increase in BMI. Methods

26
Figure 1: Flow diagram of search strategy and study selection Numbers refer to datasets, rather than studies. NHL: non- Hodgkin lymphoma.

27
Figure 2: Datasets by year and population group Size of circle is proportional to sample size.

34
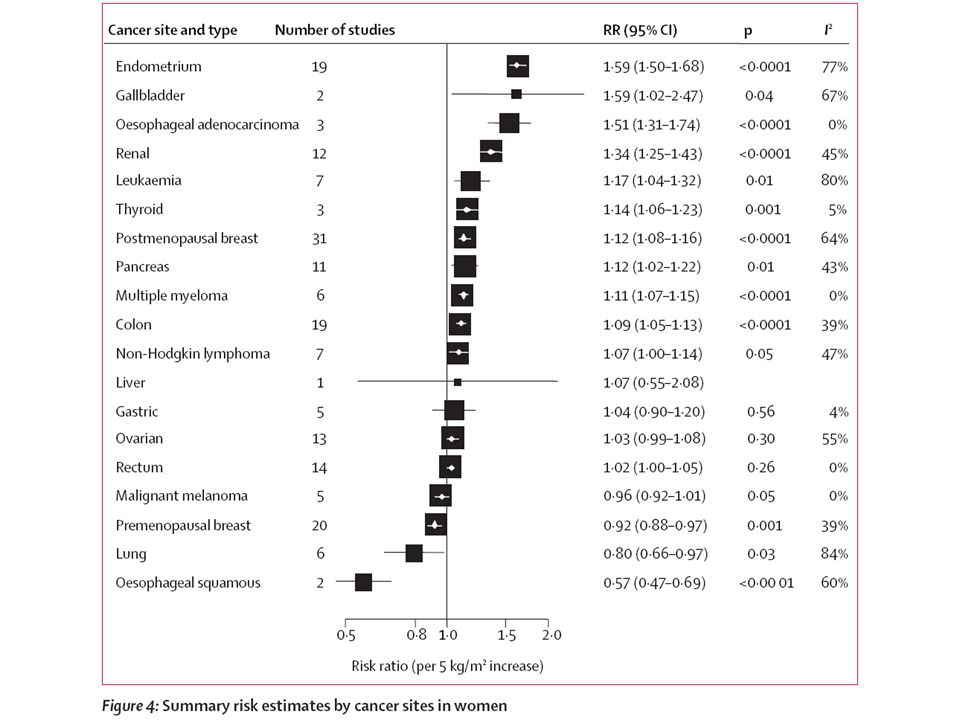
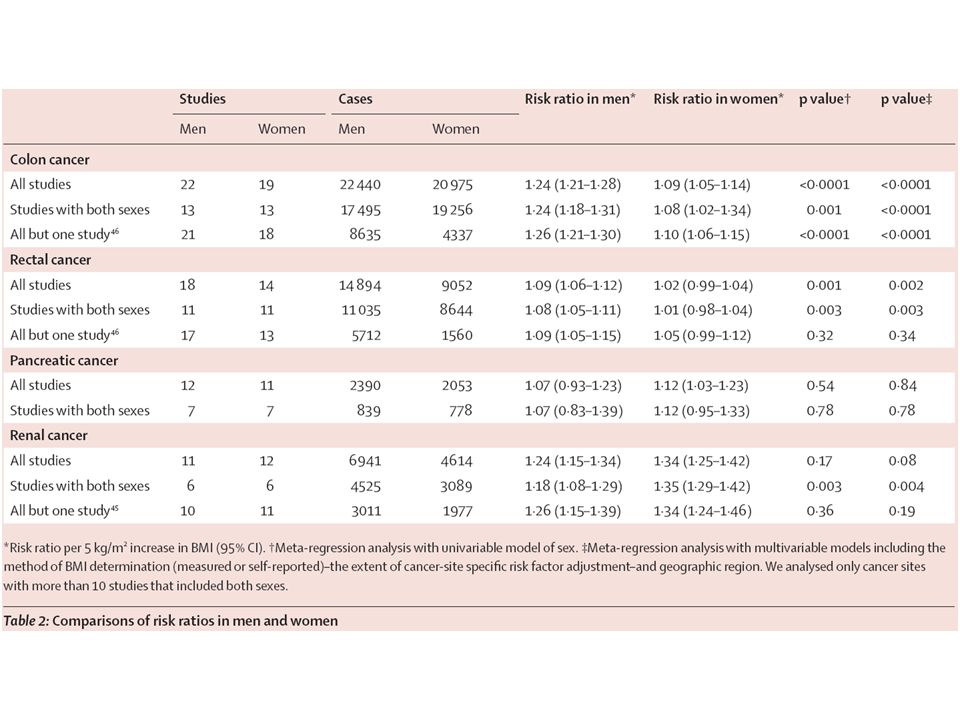
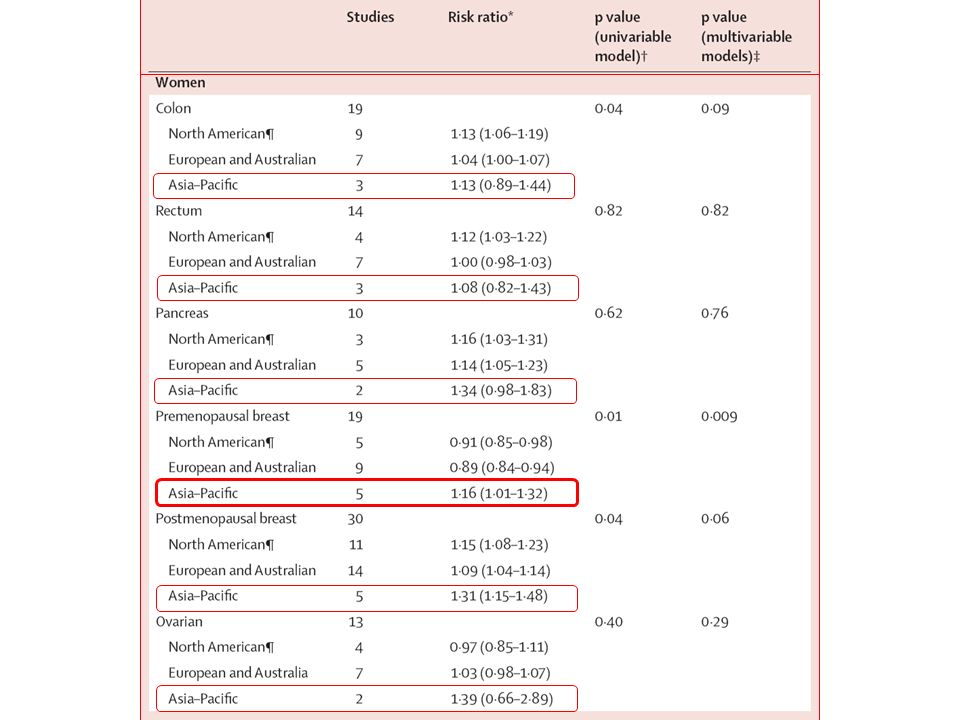
We analysed 221 datasets (141 articles), including 282 137 incident cases. In men, a 5 kg/m 2 increase in BMI was strongly associated with oesophageal adenocarcinoma (RR 1 ・ 52, p<0 ・ 0001) and with thyroid (1 ・ 33, p=0 ・ 02), colon (1 ・ 24, p<0 ・ 0001), and renal (1 ・ 24, p <0 ・ 0001) cancers. In women, we recorded strong associations between a 5 kg/m 2 increase in BMI and endometrial (1 ・ 59, p<0 ・ 0001), gallbladder (1 ・ 59, p=0.04), oesophageal adenocarcinoma (1 ・ 51, p<0 ・ 0001), and renal (1 ・ 34, p<0 ・ 0001) cancers. We noted weaker positive associations (RR <1 ・ 20) between increased BMI and rectal cancer and malignant melanoma in men; postmenopausal breast, pancreatic, thyroid, and colon cancers in women; and leukaemia, multiple myeloma, and non-Hodgkin lymphoma in both sexes. Associations were stronger in men than in women for colon (p<0 ・ 0001) cancer. Associations were generally similar in studies from North America, Europe and Australia, and the Asia–Pacific region, but we recorded stronger associations in Asia–Pacific populations between increased BMI and premenopausal (p=0 ・ 009) and postmenopausal (p=0 ・ 06) breast cancers. Summary of Findings
 and with thyroid (1 ・ 33, p=0 ・ 02), colon (1 ・ 24, p<0 ・ 0001), and renal (1 ・ 24, p <0 ・ 0001) cancers. In women, we recorded strong associations between a 5 kg/m 2 increase in BMI and endometrial (1 ・ 59, p<0 ・ 0001), gallbladder (1 ・ 59, p=0.04), oesophageal adenocarcinoma (1 ・ 51, p<0 ・ 0001), and renal (1 ・ 34, p<0 ・ 0001) cancers. We noted weaker positive associations (RR <1 ・ 20) between increased BMI and rectal cancer and malignant melanoma in men; postmenopausal breast, pancreatic, thyroid, and colon cancers in women; and leukaemia, multiple myeloma, and non-Hodgkin lymphoma in both sexes. Associations were stronger in men than in women for colon (p<0 ・ 0001) cancer. Associations were generally similar in studies from North America, Europe and Australia, and the Asia–Pacific region, but we recorded stronger associations in Asia–Pacific populations between increased BMI and premenopausal (p=0 ・ 009) and postmenopausal (p=0 ・ 06) breast cancers. Summary of Findings.")
35
Increased BMI is associated with increased risk of common and less common malignancies. For some cancer types, associations differ between sexes and populations of different ethnic origins. These epidemiological observations should inform the exploration of biological mechanisms that link obesity with cancer. Conclusion: Interpretation

Similar presentations


行列式の定義には、数学的な概念がいろいろ必要である。まずそれらを順に見ていく。>")

 を、出現から消滅まで 全天 X 線監視装置 MAXI (マキシ)で観測したところ、 新種のブラックホール新星であることが判明した。 従来のブラックホールを、 多量のガスを一気に飲み込む「肉食系」と.>")
 玉岡賀津雄(名古屋大学) 木山幸子(麗澤大学大学院生) 言語科学会第 11 回年次国際大会 (JSLS2009)>")


を体験したことにより興味を惹かれ るきっかけとなった。主な目的は、これ.>")


 の行列に対する行列式を、 次の行列式という。 行列 の行列式を とも表す。 行列式と行列の記号.>")

.>")