Download presentation
Presentation is loading. Please wait.

1
RTI: Distinguishing Reading Problems from Reading Disabilities University of Texas Sharon Vaughn

2
Special Education History in 3 slides “I am the Executive Director of Special Education in my district and have been for the last 13 years. I have witnessed what has happened in our district over time. For the previous 10 years there was a tremendous push to support all our students with disabilities in the general education classroom. While we saw many benefits from this approach, there was always the question of what makes this “specially designed instruction”. Students were referred for evaluations for special education placement only to receive more of the same general education (now with some tutoring). Thus we saw students successfully completing (passing) their classes with our supports, but not really gaining the skills necessary to function independently. As a matter of fact, I believe we created more dependence from the students and the general educators.”
. Thus we saw students successfully completing (passing) their classes with our supports, but not really gaining the skills necessary to function independently. As a matter of fact, I believe we created more dependence from the students and the general educators. .")
3
History…cont. “ Several years ago, I really started challenging staff to tell me what was special about the services they were providing. Were we remediating deficits when possible and giving the student compensatory skills if not. I didn’t like the responses in most every case. Two years ago, we pulled the research on reading instruction and programs and adopted several programs for use with students with disabilities. We are now in the second year of implementation. I have two main questions:

4
Cont. 1. What does research say is required in the form of staff development and training to give teachers adequate skills for teaching reading to struggling students? Our district uses “Balanced Literacy” with Guided Reading - an approach that places an extreme level of trust on the skill level of the teacher for success. I only found one (1) research article that stated Balanced Literacy could be highly effect – “in the hands of expert literacy instructors.” I failed to mention, our district is growing rapidly and we are opening new buildings and hiring new staff almost yearly. Many of the new teachers are inexperienced. 2. For adolescent students in our district who never received systemic, intense reading instruction at the primary and elementary grades, would the level of intensity you describe in Tier III be appropriate, or does research say it is too late to bring these students up significantly? We’re talking about many bright LD students who are reading multiple years below grade level. “
 research article that stated Balanced Literacy could be highly effect – in the hands of expert literacy instructors. I failed to mention, our district is growing rapidly and we are opening new buildings and hiring new staff almost yearly. Many of the new teachers are inexperienced. 2. For adolescent students in our district who never received systemic, intense reading instruction at the primary and elementary grades, would the level of intensity you describe in Tier III be appropriate, or does research say it is too late to bring these students up significantly. We’re talking about many bright LD students who are reading multiple years below grade level. .")
5
Cont. “What advice do you have? p.s. How do we do RTI?”

6
Where did the triangle come from? Tertiary Intervention Secondary Intervention Primary Instruction

7
Facts About Prevention & RTI 1923, Edward A. Winslow described public health as the science of preventing disease – discussed 3 levels of prevention Public Health Approach included: specifying risk factors, evaluating interventions, providing large-scale implementation, using monitoring & assessment with research to determine effectiveness.

8
RTI: What do we know the least about? Accurately differentiating and treating “difficulty” from “disability” How to address needs of older students

9
Minimal Responders Vellutino, Scanlon, and Jaccard (2003, p.117) examined follow-up data on first grade students identified as at risk and provided tutoring. They confirm “that there are small but significant numbers of children who will require intensive and individualized remedial assistance for a period of time beyond that provided by the intervention project in order for them to become functionally independent readers.”

10
Minimal Responders: 4 Years of Study Students at risk for reading problems randomly assigned to TREATMENT or COMPARISON T = researcher provided intervention C = school provided intervention

11
High and Low Responders Remained in District from Fall 1 st through Spring 2 nd High Responders received intervention in 1 st grade (10-20 weeks) – Exited Low Responders received intervention in 1 st & 2 nd grades (20 weeks each year; 40 weeks total)
 – Exited Low Responders received intervention in 1 st & 2 nd grades (20 weeks each year; 40 weeks total)")
12
Sample High Responders 34 Treatment (15 M, 19 F) 36 Comparison (22 M, 14 F) Low Responders 14 Treatment (9 M, 5 F) 24 Comparison (16 M, 8 F)
 36 Comparison (22 M, 14 F) Low Responders 14 Treatment (9 M, 5 F) 24 Comparison (16 M, 8 F)")
13
Criteria for Identifying Students At-Risk Tier II Intervention Screening Period Risk Criteria Fall First Grade NWF<13 OR PSF<10 and NWF<24 Winter First Grade NWF<30 and ORF<20 OR ORF<8 Tier III Intervention Screening Period Continued Risk Criteria Fall Second Grade ORF<27 Winter Second Grade ORF<70

14
Tier II Research Intervention Conducted in first grade Daily, 30-minute sessions in addition to Tier I instruction Small groups (4-6 students) Tutors hired and trained by research staff
 Tutors hired and trained by research staff")
15
Tier II Research Intervention (cont’d) Instruction provided: –Phonics and word recognition (15 minutes) –Fluency (5 minutes) –Passage reading and comprehension (10 minutes)
 Instruction provided: –Phonics and word recognition (15 minutes) –Fluency (5 minutes) –Passage reading and comprehension (10 minutes)")
16
Tier III Research Intervention Participated in 1 st and 2nd grade Daily, 50-minute sessions in addition to Tier I instruction Very small groups (2-4 students) Tutors hired and trained by research staff
 Tutors hired and trained by research staff")
17
Tier III Research Intervention (cont’d) Instruction provided: –Sound review (1-2 minutes) –Phonics and word recognition and vocabulary (17-25 minutes) –Fluency (5 minutes) –Passage reading and comprehension (12-20 minutes)
 Instruction provided: –Sound review (1-2 minutes) –Phonics and word recognition and vocabulary (17-25 minutes) –Fluency (5 minutes) –Passage reading and comprehension (12-20 minutes)")
18
PPVT Scores Administered Spring 1 st Grade High Responders T = 89.68 (10.39) C = 89.33 (10.44) Low Responders T = 80.93 (10.96) C = 85.67 (9.51)
 C = (10.44) Low Responders T = (10.96) C = (9.51)")
19
WRMT-Word Attack Fall 1st Grade Winter 1st Grade Spring 1st Grade Fall 2nd Grade Winter 2nd Grade Spring 2nd Grade Treatment 101.50 (11.07) 111.71 (6.39) 113.26 (7.10) 97.29 (7.65) NA105.32 (13.96) Comparison 96.15 (11.09) 108.53 (7.49) 107.89 (11.16) 103.09 (6.47) NA102.00 (11.71) High Responders:
 (6.39) (7.10) (7.65) NA (13.96) Comparison (11.09) (7.49) (11.16) (6.47) NA (11.71) High Responders:")
20
WRMT-Word Attack

22
Fall 1st Grade Winter 1st Grade Spring 1st Grade Fall 2nd Grade Winter 2nd Grade Spring 2nd Grade Treatment 89.86 (11.03) 97.14 (12.75) 101.36 (13.02) 96.50 (10.75) 99.71 (14.32) 103.79 (16.03) Comparison 86.26 (9.36) 97.33 (12.95) 97.38 (11.99) 92.33 (7.78) 95.13 (7.94) 93.33 (9.45) Low Responders:
 (12.75) (13.02) (10.75) (14.32) (16.03) Comparison (9.36) (12.95) (11.99) (7.78) (7.94) (9.45) Low Responders:")
23
WRMT-Word Attack

25
Low and High Responders:

26
WRMT-Word Identification Fall 1st Grade Winter 1st Grade Spring 1st Grade Fall 2nd Grade Winter 2nd Grade Spring 2nd Grade Treatment 100.81 (9.61) 110.47 (8.59) 112.62 (9.61) 97.71 (5.79) NA105.97 (8.39) Comparison 98.47 (9.52) 109.61 (9.03) 110.75 (10.77) 103.64 (8.78) NA102.79 (8.21) High Responders:
 (8.59) (9.61) (5.79) NA (8.39) Comparison (9.52) (9.03) (10.77) (8.78) NA (8.21) High Responders:")
27
WRMT-Word Identification

29
Fall 1st Grade Winter 1st Grade Spring 1st Grade Fall 2nd Grade Winter 2nd Grade Spring 2nd Grade Treatment 87.93 (13.13) 95.86 (12.73) 97.64 (13.84) 93.71 (11.13) 93.71 (11.14) 96.43 (10.39) Comparison 86.63 (12.51) 94.00 (13.97) 95.00 (14.52) 89.75 (12.98) 90.38 (9.43) 89.38 (9.81) Low Responders:
 (12.73) (13.84) (11.13) (11.14) (10.39) Comparison (12.51) (13.97) (14.52) (12.98) (9.43) (9.81) Low Responders:")
30
WRMT-Word Identification

32
Low and High Responders:

33
WRMT- Passage Comprehension Fall 1st Grade Winter 1st Grade Spring 1st Grade Fall 2nd Grade Winter 2nd Grade Spring 2nd Grade Treatment 91.69 (12.34) 101.97 (9.41) 104.91 (6.92) 96.71 (5.59) NA101.91 (6.44) Comparison 89.71 (11.26) 98.08 (9.41) 102.53 (7.76) 98.45 (6.35) NA99.00 (6.54) High Responders:
 (9.41) (6.92) (5.59) NA (6.44) Comparison (11.26) (9.41) (7.76) (6.35) NA99.00 (6.54) High Responders:")
34
WRMT- Passage Comprehension

36
Fall 1st Grade Winter 1st Grade Spring 1st Grade Fall 2nd Grade Winter 2nd Grade Spring 2nd Grade Treatment 83.29 (6.78) 87.00 (8.66) 91.43 (11.46) 87.64 (12.46) 93.93 (11.94) 92.00 (11.91) Comparison 79.43 (8.36) 88.00 (10.54) 89.83 (9.68) 87.13 (8.43) 87.67 (12.46) 88.58 (9.90) Low Responders:
 (8.66) (11.46) (12.46) (11.94) (11.91) Comparison (8.36) (10.54) (9.68) (8.43) (12.46) (9.90) Low Responders:")
37
WRMT- Passage Comprehension

39
Low and High Responders:

40
WRAT- Spelling Fall 1st Grade Winter 1st Grade Spring 1st Grade Fall 2nd Grade Winter 2nd Grade Spring 2nd Grade Treatment 95.21 (9.85) 102.74 (13.70) 107.44 (10.89) 92.14 (4.41) NA Comparison 91.32 (11.56) 100.19 (11.66) 105.31 (10.33) 93.45 (7.51) NA High Responders:
 (13.70) (10.89) (4.41) NA Comparison (11.56) (11.66) (10.33) (7.51) NA High Responders:")
41
WRAT- Spelling

43
Fall 1st Grade Winter 1st Grade Spring 1st Grade Fall 2nd Grade Winter 2nd Grade Spring 2nd Grade Treatment 75.07 (18.21) 86.14 (15.50) 92.71 (9.32) 84.50 (10.35) 88.43 (12.28) 91.57 (7.88) Comparison 79.04 (17.05) 91.96 (13.18) 92.83 (12.50) 84.79 (10.86) 85.13 (13.08) 87.08 (10.26) Low Responders:
 (15.50) (9.32) (10.35) (12.28) (7.88) Comparison (17.05) (13.18) (12.50) (10.86) (13.08) (10.26) Low Responders:")
44
WRAT- Spelling

46
Low and High Responders:

47
Oral Reading Fluency Fall 1st Grade Winter 1st Grade Spring 1st Grade Fall 2nd Grade Winter 2nd Grade Spring 2nd Grade Treatment NA16.26 (8.69) 42.29 (17.15) 42.15 (14.16) 70.18 (20.11) 82.12 (24.17) Comparison NA13.00 (6.85) 34.19 (15.14) 34.89 (9.88) 62.39 (19.37) 75.77 (17.51) High Responders:
 (17.15) (14.16) (20.11) (24.17) Comparison NA13.00 (6.85) (15.14) (9.88) (19.37) (17.51) High Responders:")
48
Oral Reading Fluency

50
Fall 1st Grade Winter 1st Grade Spring 1st Grade Fall 2nd Grade Winter 2nd Grade Spring 2nd Grade Treatment NA6.07 (4.67) 15.86 (7.80) 13.43 (8.84) 29.50 (13.51) 41.57 (20.97) Comparison NA4.46 (2.83) 13.17 (6.22) 11.75 (7.59) 26.54 (15.37) 31.79 (19.72) Low Responders:
 (7.80) (8.84) (13.51) (20.97) Comparison NA4.46 (2.83) (6.22) (7.59) (15.37) (19.72) Low Responders:")
51
Oral Reading Fluency

53
Low and High Responders:

54
Growth Modeling Passages Spring 1st GradeSpring 2nd Grade 1 st Passage 2 nd Passage 1 st Passage 2 nd Passage Treatment 42.09 (13.52) 44.71 (12.92) 85.21 (24.45) 84.59 (24.89) Comparison 32.77 (11.78) 34.77 (12.39) 74.93 (12.95) 73.14 (12.09) Note: Growth modeling passages were the ORF passages developed by Fuchs. Two passages administered at end of 1st, 2nd, and 3rd grades all on 1st grade level High Responders:

55
Growth Modeling Passages Spring 1st GradeSpring 2nd Grade 1 st Passage 2 nd Passage 1 st Passage 2 nd Passage Treatment 18.57 (12.57) 17.00 (12.31) 49.14 (20.78) 46.07 (17.66) Comparison 15.21 (8.87) 13.79 (9.13) 35.82 (19.66) 35.71 (19.10) Note: Growth modeling passages were the ORF passages developed by Fuchs. Two passages administered at end of 1st, 2nd, and 3rd grades all on 1st grade level Low Responders:

56
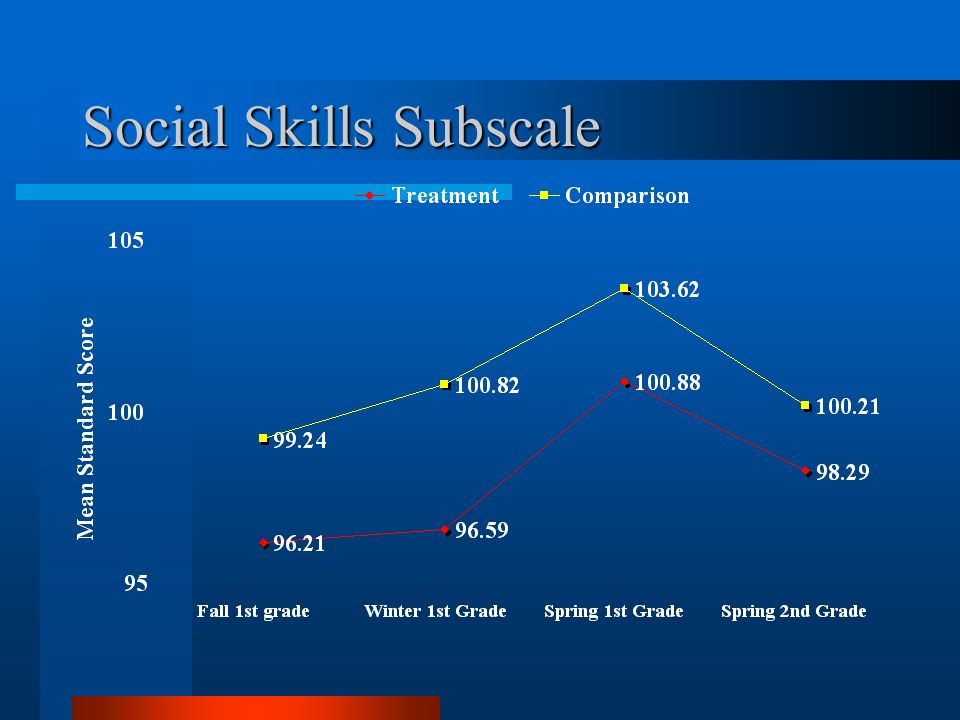
Social Skills Subscale Fall 1st Grade Winter 1st Grade Spring 1st Grade Fall 2nd Grade Winter 2nd Grade Spring 2nd Grade Treatment 96.21 (14.30) 96.59 (15.29) 100.88 (14.95) NA 98.29 (19.63) Comparison 99.24 (14.32) 100.82 (18.38) 103.62 (17.47) NA 100.21 (13.33) High Responders:
 (15.29) (14.95) NA (19.63) Comparison (14.32) (18.38) (17.47) NA (13.33) High Responders:")
57
Social Skills Subscale

59
Fall 1st Grade Winter 1st Grade Spring 1st Grade Fall 2nd Grade Winter 2nd Grade Spring 2nd Grade Treatment 95.29 (14.14) NA101.00 (22.38) 91.86 (11.37) NA90.43 (16.93) Comparison 88.96 (17.76) NA94.25 (20.28) 86.58 (14.41) NA89.79 (13.73) Low Responders:
 NA (22.38) (11.37) NA90.43 (16.93) Comparison (17.76) NA94.25 (20.28) (14.41) NA89.79 (13.73) Low Responders:")
60
Social Skills Subscale

62
Low and High Responders:

63
Social Skills Subscale Subscale sample items include: Responds appropriately to peer pressure Follows your directions Volunteers to help peers with classroom tasks Controls temper in conflict situations with adults

64
Problem Behavior Subscale Fall 1st Grade Winter 1st Grade Spring 1st Grade Fall 2nd Grade Winter 2nd Grade Spring 2nd Grade Treatment 101.93 (14.33) 105.69 (15.27) 102.35 (15.56) NA 105.74 (14.86) Comparison 101.21 (12.88) 101.68 (14.25) 99.43 (16.05) NA 97.21 (10.32) High Responders:
 (15.27) (15.56) NA (14.86) Comparison (12.88) (14.25) (16.05) NA (10.32) High Responders:")
65
Problem Behavior Subscale

67
Fall 1st Grade Winter 1st Grade Spring 1st Grade Fall 2nd Grade Winter 2nd Grade Spring 2nd Grade Treatment 103.64 (14.87) NA104.93 (14.74) 101.43 (12.08) NA106.21 (15.08) Comparison 107.33 (14.16) NA108.38 (17.10) 112.21 (14.36) NA109.04 (14.62) Low Responders:
 NA (14.74) (12.08) NA (15.08) Comparison (14.16) NA (17.10) (14.36) NA (14.62) Low Responders:")
68
Problem Behavior Subscale

70
Low and High Responders:

71
Problem Behavior Subscale Subscale sample items include: Fights with others Is easily embarrassed Acts impulsively

72
Academic Competence Subscale Fall 1st Grade Winter 1st Grade Spring 1st Grade Fall 2nd Grade Winter 2nd Grade Spring 2nd Grade Treatment 87.07 (10.56) 89.38 (8.57) 93.56 (7.66) NA 94.38 (10.19) Comparison 87.74 (10.64) 88.33 (9.20) 91.33 (9.73) NA 92.93 (8.97) High Responders:
 (8.57) (7.66) NA (10.19) Comparison (10.64) (9.20) (9.73) NA (8.97) High Responders:")
73
Academic Competence Subscale

75
Fall 1st Grade Winter 1st Grade Spring 1st Grade Fall 2nd Grade Winter 2nd Grade Spring 2nd Grade Treatment 79.00 (7.07) NA79.00 (10.37) 80.14 (7.27) NA74.43 (9.91) Comparison 78.17 (9.46) NA77.25 (8.50) 79.42 (7.38) NA76.17 (9.73) Low Responders:
 NA79.00 (10.37) (7.27) NA74.43 (9.91) Comparison (9.46) NA77.25 (8.50) (7.38) NA76.17 (9.73) Low Responders:")
76
Academic Competence Subscale

78
Low and High Responders:

79
Academic Competence Subscale Subscale sample items include: In reading, how does this child compare with other students? This child’s overall motivation to succeed academically is?

80
Gains Per Hour Intervention Word IDWord AttackRead Comp High Responders (~25 hrs.).23.16.29 Low Responders (~130 hrs.).04.12.10
 Low Responders (~130 hrs.)")
81
Costs for High and Low Responders Estimating tutors pay @ $50 per hour (high estimate allows for planning and training) High Responders: $50 X 25 hours; $50 X 50 hours; divided by # in group (5) = $250 to $500 per child Low Responders: Cost of Tier II = $500 PLUS Tier III $50 per hour X 83 hours divided by 3 = $1400 per child the second year. Tier II ($500) plus Tier III ($1400) = Approximately $1900 per child
 plus Tier III ($1400) = Approximately $1900 per child.")
82
Individual Cases

83
Juan Hispanic Male Identified with autism Continuously in district 1st-3rd grade Received Free/Reduced Lunch Services 1 st -3 rd grade Minimal school absences (2-8 days per year)
")
84
Juan PPVT Spring First GradeFall Third Grade 7784

85
Alita Hispanic female Continuously in district 1st-3rd grade (moved January 2007) Identified as “other health impaired” in third grade Received free/reduced lunch services beginning winter of first grade 9 school absences in first grade; 26 absences in second grade
 Identified as other health impaired in third grade Received free/reduced lunch services beginning winter of first grade 9 school absences in first grade; 26 absences in second grade")
86
Alita PPVT Spring First GradeFall Third Grade 7875

87
Isabel Hispanic female Continuously in district winter of first grade-3rd grade Identified with learning disability in first grade Received free/reduced lunch services 1st-3rd grade Minimal school absences (2-6 per year)
")
88
Isabel PPVT Spring First GradeFall Third Grade 8580

89
Third Grade Intervention (in progress) Daily, 50-minute sessions provided in addition to classroom reading instruction 1:1 instruction provided by tutor hired and trained by research staff
 Daily, 50-minute sessions provided in addition to classroom reading instruction 1:1 instruction provided by tutor hired and trained by research staff")
90
Third Grade Intervention (in progress) Baseline –Continue with Second Grade Intervention Alternative Intervention –Word Work (15-18 min.) –Text Reading (15-20 min.) –Comprehension (10 min.) –Fluency (5-7 min.)
 Baseline –Continue with Second Grade Intervention Alternative Intervention –Word Work (15-18 min.) –Text Reading (15-20 min.) –Comprehension (10 min.) –Fluency (5-7 min.)")
91
Juan

95
Alita

99
Isabel

103
WRMT-R Standard Scores StudentWord ID Spring 1 st Word ID Spring 2 nd Word ID Winter 3 rd Word Attack Spring 1 st Word Attack Spring 2 nd Word Attack Winter 3 rd Pass Comp Spring 1 st Pass Comp Spring 2 nd Pass Comp Winter 3 rd Alita9287--108101--88 -- Juan898799107 110608196 Isabel817781748286796770

104
SSRS Standard Scores StudentSocial Skills Spring 1 st Social Skills Spring 2 nd Problem Behavior Spring 1 st Problem Behavior Spring 2 nd Academic Competence Spring 1 st Academic Competence Spring 2 nd Alita122951031127367 Juan1308411511274 Isabel898098957965

105
Prevailing Questions Tier I is enhanced classroom instruction. Tier II is 25-50 hours of small group instruction Tier III is > 125 hours of small group instruction

106
Back to the Sp Ed Director “What advice do you have? p.s. How do we do RTI?”

Similar presentations


>")
 in Fresno Unified School District Presentation for SELPA Directors December 1 st 2005 By Sue Pellegrino, FUSD SELPA Director.>")


 Lindenhurst Schools>")


