Download presentation
Presentation is loading. Please wait.

1
The Physical Layer Lowest layer in Network Hierarchy. Physical transmission of data. –Various flavors Copper wire, fiber optic, etc... –Physical limits on transmission speed and bandwidth. Examples of how physical transmission is used in real networks.

2
Signals as functions of time We transmit signals by varying some physical property over time. –e.g. vary voltage or current The faster we can (accurately) vary this property the more data we can send per unit of time. t 0v 5v 10 010100 dt
 vary this property the more data we can send per unit of time. t 0v 5v dt.")
3
Questions concerning physical data communication What are the signaling frequency limitations of various media? –Is there an upper bound? –What if noise is introduced into the system? –What about attenuation and other factors? How does the speed of light limit us? How do we decide between various media for specific applications? We start with mathematical analysis. –Convert functions of time to functions of frequency.

4
Fourier Analysis Fourier: We can construct any continuous periodic function by a linear combination of sinusoidal functions. g(t) is a continuous function over time t. Period of g is T. Fundamental frequency f = 1/T.
 is a continuous function over time t. Period of g is T. Fundamental frequency f = 1/T..")
5
The Fourier transform Constant or “ DC ” term Frequency or “ AC ” terms. Sine and cosine amplitudes. nth harmonics

6
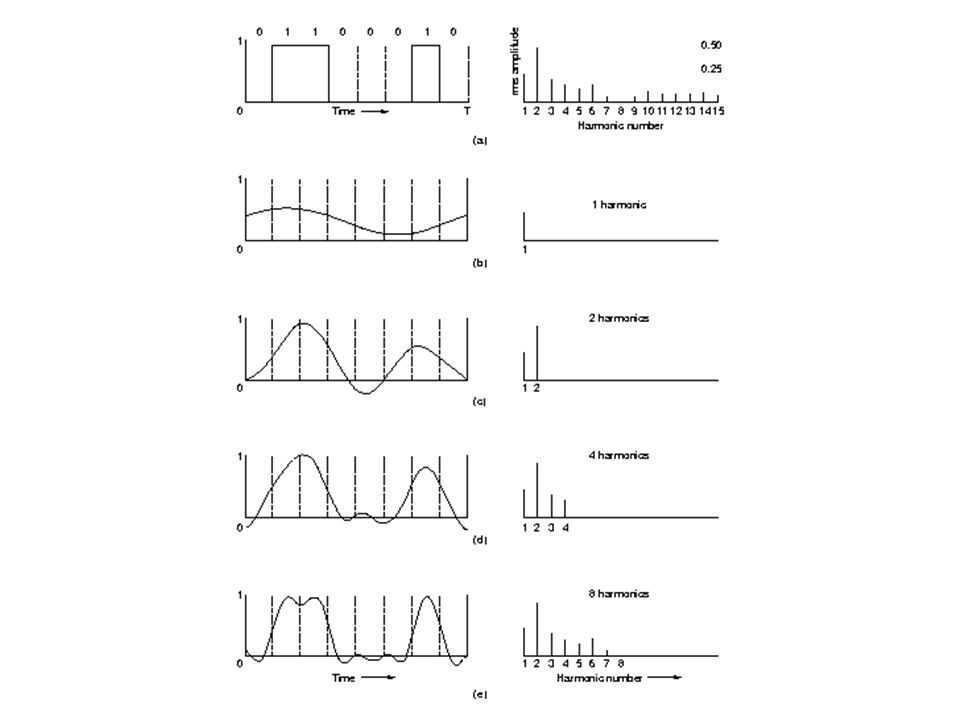
Example analysis for transmitting 8 bits of data Transmitting the ASCII character ‘ b ’ which is 01100010 in binary. The magnitude of the amplitudes a n and b n are used to compute the “ energy ” of the signal at the corresponding frequency.

8
Representing the signal with only low frequency values Cutoff frequency –Only transmit amplitudes from 0 to f c. –Why? What happens when we only use the first few harmonics to reconstruct our signal? The time T we want to use depends on… –The encoding method –The signaling speed (rate at which voltage can change).
..")
9
Harmonics versus data rates Baud: Changes (i.e. signaling elements) per second. –Note: each change may be represented by more than 1 bit. Given: bit rate = b bits/sec Frequency of 1st harmonic b/8 Hz. Voice grade line cutoff frequency ~3000 Hz. Highest harmonic passed through –3000/(b/8) = 24,000/b
 = 24,000/b.")
10
Harmonics vs. data rate table

11
Limited bandwidth Digital signal consists of many frequency components. Only those components that are within the bandwidth of the transmission medium are received. The larger the bandwidth of the medium… –the more larger frequency components are passed; –the more “ faithful ” the reproduction of the original signal at the receiving end.

12
The Nyquist rate Given: –Transmission medium with bandwidth H (a low pass filter may have been used to cancel out higher frequency terms). –V discrete signal levels (V = 2 for binary signal). –Noiseless channel. Wanted: –Determine the maximum data rate of this transmission medium. Solution (Nyquist, 1924) –maximum data rate = 2 H log 2 V bps Conclusion: We can reconstruct a binary signal with 2H samples per second. More samples are pointless
. –Noiseless channel. Wanted: –Determine the maximum data rate of this transmission medium. Solution (Nyquist, 1924) –maximum data rate = 2 H log 2 V bps Conclusion: We can reconstruct a binary signal with 2H samples per second. More samples are pointless.")
13
Nyquist example Example Problem –A modem to be used with a PSTN uses a modulation scheme with 8 levels per signalling element. If the bandwidth of the PSTN is 3100 Hz, deduce the Nyquist maximum data transfer rate. Data rate = 2 H log 2 V bps = (2)(3100)(3) = 18600 bps
(3100)(3) = bps.")
14
Delay Distortion The rate of propagation of a sinusoidal signal along a transmission line varies with the frequency of the signal. –Signals with certain frequencies may arrive late and causing delay distortion of the received signal. Also known as intersymbol interference. Each bit is sampled at its nominal center. Distortion can lead to incorrect interpretation of the signal as the bit rate increases.

15
Noise In the presence of noise, the bit rate may be severely reduced. –In the absence of a signal, a channel will ideally have zero electrical signal present. –In practice, there are “ random perturbations ” on the line which are known as line noise. –In the limit, an attenuated signal is reduced to line noise. How much “ signal ” is signal, and how much is noise?

16
Signal to Noise ratio An important parameter associated with a transmission medium is the signal-to-noise ratio (typically measured in decibels dB). SNR = 10 log 10 (S/N) dB S = signal power N = noise power High SNR is good. Low SNR is bad.
 dB S = signal power N = noise power High SNR is good. Low SNR is bad..")
17
Shannon-Hartley Law Maximum data rate of a noisy channel. Data rate = H log 2 (1 + S/N) bps Based on Gaussian noise model. Example: Assuming that a PSTN has a bandwidth of 3000 Hz and a typical SNR of 20 dB. Determine the max theoretical data rate that can be achieved. 20 dB = 10 log 10 (S/N), S/N = 100 Date rate = H log 2 (1 + S/N) bps = 3000 log 2 (1 + 100) = 19963 bps In a physical environment there will always be noise.
 bps Based on Gaussian noise model. Example: Assuming that a PSTN has a bandwidth of 3000 Hz and a typical SNR of 20 dB. Determine the max theoretical data rate that can be achieved. 20 dB = 10 log 10 (S/N), S/N = 100 Date rate = H log 2 (1 + S/N) bps = 3000 log 2 ( ) = bps In a physical environment there will always be noise..")
18
Attenuation As a signal propagates along a transmission line its amplitude decreases. This is known as signal attenuation. –Fixes: Use short cables. Use amplifiers (repeaters) to boost the signal. –Attenuation increases as a function of frequency. Therefore, amplifiers are designed to adjust for this. Equalizers equalize the attenuation across a band of frequencies.
 to boost the signal. –Attenuation increases as a function of frequency. Therefore, amplifiers are designed to adjust for this. Equalizers equalize the attenuation across a band of frequencies..")
Similar presentations

 Perbandingan antara sinyal analog dan digital.>")
>")


 We can carry digital values over analog.>")


 Advanced Computer Networks.>")


 Data, Signal.>")