Download presentation
Presentation is loading. Please wait.

1
Gender attitudes: acceptance or choice Ko Oudhof Statistics Netherlands

2
UNECE/CES-work session gender statistics 2004 Steps Attitudes and measurement Theory of Hakim What’s the problem? Research design Results Conclusions

3
UNECE/CES-work session gender statistics 2004 Attitudes (common elements in most definitions) Oriented on object, person, institution or event Evaluative component Cognitive component Affective component Stable condition or construct Intermediary between object stimulus and behavioural response: consistency
 Oriented on object, person, institution or event Evaluative component Cognitive component Affective component Stable condition or construct Intermediary between object stimulus and behavioural response: consistency")
4
UNECE/CES-work session gender statistics 2004 Hakim - preference theory Publication: Work-Lifestyle Choices in 21st Century (2000) etc. Heterogeneity of lifestyles of women possible because of new scenario – Contraceptive revolution – Equal opportunities revolution – Expansion white collar occupations – More jobs for secondary earners –Subjective elements in lifestyle choices more important Three groups of preferences (of women) – home-centred – work-centred – adaptive
 – home-centred – work-centred – adaptive.")
5
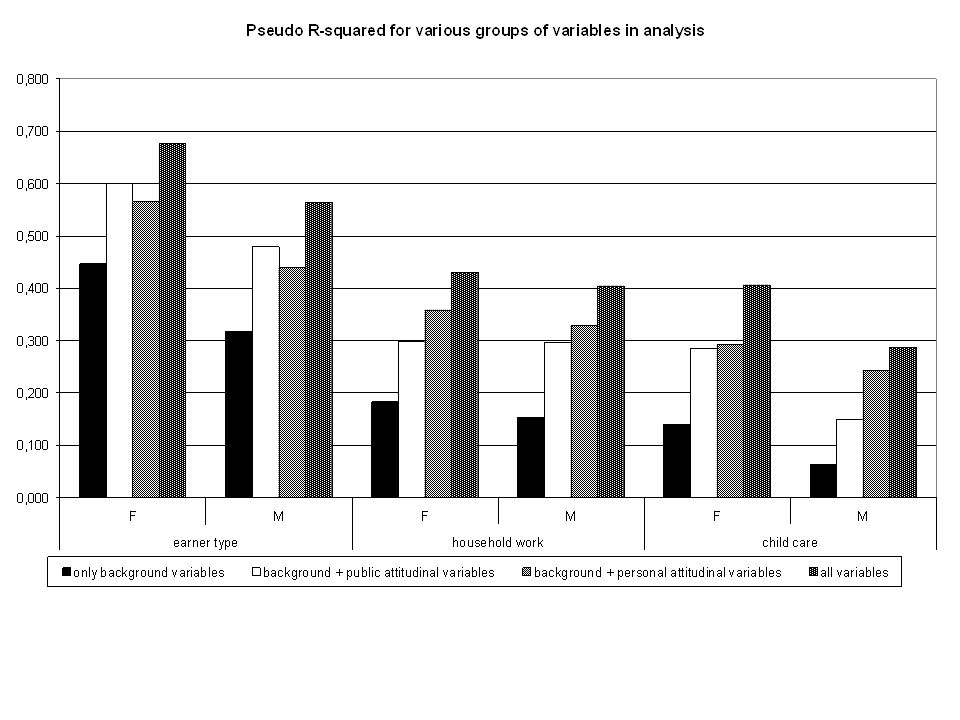
UNECE/CES-work session gender statistics 2004

6
Hakim on attitude measurement Preferences versus attitudes Subjective factor too often ignored More holistic approach (?) Researchers should measure more often values and attitudes by fewer questions Low predictability of behavior from attitudes Main reason: in attitude measurement public beliefs are confused with personal goals
 Researchers should measure more often values and attitudes by fewer questions Low predictability of behavior from attitudes Main reason: in attitude measurement public beliefs are confused with personal goals")
7
UNECE/CES-work session gender statistics 2004 Public moral versus personal preferences One should not discriminate xxx Which neighbour will you prefer…xxx or yyy People should use more often public transport From now on I will go to my work by public transport Women and men should divide paid work equally I/ my wife will go looking for a job tomorrow Men should do more housework From now on I/my husband will do ……

8
UNECE/CES-work session gender statistics 2004 Testing public versus personal Both man and woman should contribute to the family income Man should earn the money, the woman should take care of household and family Men should do a larger part of the household chores than nowadays How we should divide our tasks at home has been subject of discussion I prefer to be the one who is working outside the home and will be responsible for the household income My partner thinks it's important that we divide paid work and caring tasks equally among ourselves

9
UNECE/CES-work session gender statistics 2004 Testing criterion Assuming that persons in different situations will differ in relevant attitudes concerning that situation: which items will distinguish (explain, predict) better? Paid work Housework Child care All three: today + tomorrow

10
UNECE/CES-work session gender statistics 2004 Earner types Typology of division of household work Typology of division of child care Permanent earnerlessPermanently doing everything Earnerless but change wantedPermanently doing greater part Permanent single earner Doing everything but wanting less Permanent one and a half earners Doing greater part but wanting less Permanent half and half earnersPermanently equally divided Permanent double earnersPermanently doing less Single earner but more earners wantedDoing less but wanting more One and a half earners but half and half earners wantedDoing nothing but wanting more Double earners but less wanted Other

12
UNECE/CES-work session gender statistics 2004 Multinomial logistic regression In logit analysis dependent is binary – having job (yes/no) odd (yes)=p/p-1 When independent is binary (m=1/f=0) –Odd (men)=p1/1-p1 and odd(women)=p2/1-p2 –Odd ratio (men/women) = (p1/1-p1)/(p2/1-p2) When independent is multinomial –Dummies: odd ratio is relative to reference category When dependent is multinomial – Dummies: odd ratio is relative to reference category When independent is interval –Coefficient is change in odds by change per unit So, odds ratio = 1 means (relatively) no effect
 odd (yes)=p/p-1 When independent is binary (m=1/f=0) –Odd (men)=p1/1-p1 and odd(women)=p2/1-p2 –Odd ratio (men/women) = (p1/1-p1)/(p2/1-p2) When independent is multinomial –Dummies: odd ratio is relative to reference category When dependent is multinomial – Dummies: odd ratio is relative to reference category When independent is interval –Coefficient is change in odds by change per unit So, odds ratio = 1 means (relatively) no effect")
14
UNECE/CES-work session gender statistics 2004 Analysis of items No assumptions on level of categories (as in PC or factoranalysis) HOMALS-analysis indicates –Ordinality in scale in public items –contrasts between neutral categories and one or two extreme categories in personal items –Interpretation difficult: a) different situations in which issues are not very relevant b) preference less important than arrangements by mutual agreement
 HOMALS-analysis indicates –Ordinality in scale in public items –contrasts between neutral categories and one or two extreme categories in personal items –Interpretation difficult: a) different situations in which issues are not very relevant b) preference less important than arrangements by mutual agreement")
15
Characterisation of dimension (low versus high) paid work to be divided versus paid work might be men's task (pub.op.work-dim1)pw1 X division paid work is more or less an issue versus statements not applicable (pers.op.work-dim.1)iw10,19 X experiencing hardly pressure on division paid work versus experiencing pressure (pers.op.work-dim.2)iw2-0,200,00 X women should do housework versus equal division tasks (pub.op.hhwork-dim.1)ph1-0,85-0,180,16 X few hesitations in opinion versus maybe child care should be women's task (pub.op.child care-dim.1)pc10,35-0,05-0,12-0,34 X child care is women's task versus not agreeing (pub.op.child care-dim2)pc2-0,28-0,090,010,330,00 X division child care no clear issue versus statements on division child care not applicable (pers.op.child care-dim.1)ic10,130,980,12-0,13-0,08-0,07 X experiencing hardly any pressure on division tasks versus experiencing pressure (pers.op.child care-dim.2)ic2-0,23-0,130,970,19-0,130,030,00 X pw1iw1iw2ph1pc1pc2ic1ic2 overlap of majority of items p<.01
 paid work to be divided versus paid work might be men s task (pub.op.work-dim1)pw1 X division paid work is more or less an issue versus statements not applicable (pers.op.work-dim.1)iw10,19 X experiencing hardly pressure on division paid work versus experiencing pressure (pers.op.work-dim.2)iw2-0,200,00 X women should do housework versus equal division tasks (pub.op.hhwork-dim.1)ph1-0,85-0,180,16 X few hesitations in opinion versus maybe child care should be women s task (pub.op.child care-dim.1)pc10,35-0,05-0,12-0,34 X child care is women s task versus not agreeing (pub.op.child care-dim2)pc2-0,28-0,090,010,330,00 X division child care no clear issue versus statements on division child care not applicable (pers.op.child care-dim.1)ic10,130,980,12-0,13-0,08-0,07 X experiencing hardly any pressure on division tasks versus experiencing pressure (pers.op.child care-dim.2)ic2-0,23-0,130,970,19-0,130,030,00 X pw1iw1iw2ph1pc1pc2ic1ic2 overlap of majority of items p<.01")
16
UNECE/CES-work session gender statistics 2004 Conclusions Effect public as well as personal items Shortcomings in quality of items and answering categories: attitudes? Comparibility of public and personal items? Other relevant factors in personal choices? Conceptual issue: Choices on paid work and homework as one-dimensional problem?

17
UNECE/CES-work session gender statistics 2004 Care Career High 35% Medium 40% Low 25% High 25% ???? Mixed (Work- centred/adaptive) typical work- centered Medium 40% Mixed (home- centred/adaptive ) adaptive type Mixed (Work- centred/adaptiv e) Low 35% typical home- centered Mixed (home- centred/adaptive) ???? Hakim’s model disaggregated in two dimensions
 typical work- centered Medium 40% Mixed (home- centred/adaptive ) adaptive type Mixed (Work- centred/adaptiv e) Low 35% typical home- centered Mixed (home- centred/adaptive) . Hakim’s model disaggregated in two dimensions.")
Similar presentations


 concepts Explain the characteristics and power of the.>")

