Download presentation
Presentation is loading. Please wait.

1
© 2011 Pearson Education, Inc. Weather Patterns and Severe Weather Chapter 19

2
© 2011 Pearson Education, Inc. Air masses Characteristics Large body of air 1600 km (1000 miles) or more across Perhaps several kilometers thick Similar temperature at any given altitude Similar moisture at any given altitude Move and affect a large portion of a continent
 or more across Perhaps several kilometers thick Similar temperature at any given altitude Similar moisture at any given altitude Move and affect a large portion of a continent.")
3
© 2011 Pearson Education, Inc. A Cold Canadian Air Mass

4
© 2011 Pearson Education, Inc. Source region—The area where an air mass acquires its properties Classification of an air mass Two criteria are used to classify air masses By the latitude of the source region Polar (P) and Arctic (A) High latitudes Cold to very cold
 and Arctic (A) High latitudes Cold to very cold.")
5
© 2011 Pearson Education, Inc. Classification of an air mass Two criteria are used to classify air masses By the latitude of the source region Tropical (T) Low latitudes Warm By the nature of the surface in the source region Continental (c) Form over land Likely to be dry
 Low latitudes Warm By the nature of the surface in the source region Continental (c) Form over land Likely to be dry.")
6
© 2011 Pearson Education, Inc. Classification of an air mass By the nature of the surface in the source region Maritime (m) Form over water Humid air Four basic types of air masses Continental polar (cP) Continental tropical (cT) Maritime polar (mP) Maritime tropical (mT)
 Form over water Humid air Four basic types of air masses Continental polar (cP) Continental tropical (cT) Maritime polar (mP) Maritime tropical (mT).")
7
© 2011 Pearson Education, Inc. Air masses and source region

8
© 2011 Pearson Education, Inc. Air masses and weather cP and mT air masses are the most important air masses in North America, especially east of the Rockies North America (east of the Rocky Mountains) Continental polar (cP) From northern Canada and interior of Alaska Winter—Brings cold, dry air Summer—Brings cool relief
 Continental polar (cP) From northern Canada and interior of Alaska Winter—Brings cold, dry air Summer—Brings cool relief.")
9
© 2011 Pearson Education, Inc. Air masses and weather North America (east of the Rocky Mountains) Continental polar (cP) Responsible for lake-effect snows cP air mass crosses the Great Lakes Air picks up moisture from the lakes Snow occurs on the leeward shores of the lakes
 Continental polar (cP) Responsible for lake-effect snows cP air mass crosses the Great Lakes Air picks up moisture from the lakes Snow occurs on the leeward shores of the lakes.")
10
© 2011 Pearson Education, Inc.

11
Air masses and weather North America (east of the Rocky Mountains) Maritime tropical (mT) From the Gulf of Mexico and the Atlantic Ocean Warm, moist, unstable air Brings precipitation to the eastern United States
 Maritime tropical (mT) From the Gulf of Mexico and the Atlantic Ocean Warm, moist, unstable air Brings precipitation to the eastern United States")
12
© 2011 Pearson Education, Inc. Air masses and weather North America (east of the Rocky Mountains) Continental tropical (cT) Southwest and Mexico Hot, dry Seldom important outside the source region
 Continental tropical (cT) Southwest and Mexico Hot, dry Seldom important outside the source region.")
13
© 2011 Pearson Education, Inc. Air masses and weather Maritime polar (mP) Brings precipitation to the western mountains Occasional influence in the northeastern United States causes the Northeaster in New England with its cold temperatures and snow
 Brings precipitation to the western mountains Occasional influence in the northeastern United States causes the Northeaster in New England with its cold temperatures and snow.")
14
© 2011 Pearson Education, Inc. Fronts Boundary that separates air masses of different densities Air masses retain their identities Warmer, less dense air forced aloft Cooler, denser air acts as wedge

15
© 2011 Pearson Education, Inc. Types of fronts Warm front Warm air replaces cooler air Shown on a map by a line with red semicircles Small slope (1:200) Clouds become lower as the front nears Slow rate of advance Light-to-moderate precipitation
 Clouds become lower as the front nears Slow rate of advance Light-to-moderate precipitation.")
16
© 2011 Pearson Education, Inc. Warm front

17
© 2011 Pearson Education, Inc. Types of fronts Cold front Cold air replaces warm air Shown on a map by a line with blue triangles Twice as steep (1:100) as warm fronts Advances faster than a warm front Associated weather is more violent than a warm front Intensity of precipitation is greater Duration of precipitation is shorter
 as warm fronts Advances faster than a warm front Associated weather is more violent than a warm front Intensity of precipitation is greater Duration of precipitation is shorter.")
18
© 2011 Pearson Education, Inc. Types of fronts Cold front Weather behind the front is dominated by Cold air mass Subsiding air Clearing conditions

19
© 2011 Pearson Education, Inc. Cold front

20
© 2011 Pearson Education, Inc. Types of fronts Stationary front Flow of air on both sides of the front is almost parallel to the line of the front Surface position of the front does not move Occluded front Active cold front overtakes a warm front Cold air wedges the warm air upward Weather is often complex Precipitation is associated with warm air being forced aloft

21
© 2011 Pearson Education, Inc. Formation of an occluded front

22
© 2011 Pearson Education, Inc. Middle-Latitude cyclone Primary weather producer in the middle latitudes Idealized weather Middle-latitude cyclones move eastward across the United States First signs of their approach are in the western sky Require two to four days to pass over a region

23
© 2011 Pearson Education, Inc.

24
Idealized weather Largest weather contrasts occur in the spring and winter Changes in weather associated with the passage of a middle-latitude cyclone Changes depend on the path of the storm

25
© 2011 Pearson Education, Inc. Idealized weather Changes in weather Weather associated with fronts Warm front Clouds become lower and thicker Light precipitation After the passage of a warm front winds become more southerly and temperatures warm

26
© 2011 Pearson Education, Inc. Idealized weather Changes in weather Weather associated with fronts Cold front Wall of dark clouds Heavy precipitation—hail and occasional tornadoes After the passage of a cold front winds become more northerly, skies clear, and temperatures drop

27
© 2011 Pearson Education, Inc. Cloud patterns of typical mature middle- latitude cyclone

28
© 2011 Pearson Education, Inc. Role of air aloft Cyclones and anticyclones Generated by upper-level air flow Maintained by upper-level air flow Typically are found adjacent to one another

29
© 2011 Pearson Education, Inc.

30
Thunderstorms Features Cumulonimbus clouds Heavy rainfall Lightning Occasional hail Occurrence 2000 in progress at any one time 100,000 per year in the United States Most frequent in Florida and eastern Gulf Coast region

31
© 2011 Pearson Education, Inc. Average number of days per year with thunderstorms

32
© 2011 Pearson Education, Inc. Average annual lightning flashes per square km

33
© 2011 Pearson Education, Inc. Stages of development All thunderstorms require Warm air Moist air Instability (lifting) High surface temperatures Most common in the afternoon and early evening
 High surface temperatures Most common in the afternoon and early evening.")
34
© 2011 Pearson Education, Inc. Stages of development Require continuous supply of warm air and moisture Each surge causes air to rise higher Updrafts and downdrafts form Eventually precipitation forms Gusty winds, lightning, hail Heavy precipitation Cooling effect of precipitation marks the end of thunderstorm activity

35
© 2011 Pearson Education, Inc. Stages in the development of a thunderstorm

36
© 2011 Pearson Education, Inc. Tornadoes Local storm of short duration Features Rotating column of air that extends down from a cumulonimbus cloud Low pressures inside causes the air to rush into Winds approach 480 kilometers (300 miles) per hour Smaller suction vortices can form inside stronger tornadoes
 per hour Smaller suction vortices can form inside stronger tornadoes.")
37
© 2011 Pearson Education, Inc.

38
Occurrence and development Average of 770 each year in the United States Most frequent from April through June Associated with thunderstorms Exact cause is not known Formation of tornadoes Occur most often along a cold front Associated with huge thunderstorms called supercells Mesocyclone - vertical cylinder of rotating air, typically 2 to 6 miles across, that develops in the updraft of a severe thunderstorm

39
© 2011 Pearson Education, Inc. mygeoscienceplace.com animation Tornado Formation

40
© 2011 Pearson Education, Inc. Annual tornado incidence per 10,000 square miles

41
© 2011 Pearson Education, Inc. Characteristics Diameter between 150 and 600 meters (500 and 2000 feet) Speed across landscape is about 45 kilometers (30 miles) per hour Cut about a 10 kilometers (6 miles) long path Maximum winds range beyond 500 kilometers (310 miles) per hour Intensity measured by the Fujita intensity scale
 Speed across landscape is about 45 kilometers (30 miles) per hour Cut about a 10 kilometers (6 miles) long path Maximum winds range beyond 500 kilometers (310 miles) per hour Intensity measured by the Fujita intensity scale.")
42
© 2011 Pearson Education, Inc.

43
Tornado forecasting Difficult to forecast Tornado watch To alert the public to the possibility of tornadoes Issued when the conditions are favorable Covers 65,000 square kilometers (25,000 square miles)
")
44
© 2011 Pearson Education, Inc. Tornado forecasting Tornado warning is issued when a tornado is sighted or is indicated by weather radar Use of Doppler radar helps increase the accuracy by detecting the air motion

45
© 2011 Pearson Education, Inc. Hurricanes Most violent storms on Earth To be called a hurricanehurricane Wind speed in excess of 119 kilometers (74 miles) per hour Rotary cyclonic circulation Profile Form between the latitudes of 5 degrees and 20 degrees
 per hour Rotary cyclonic circulation Profile Form between the latitudes of 5 degrees and 20 degrees.")
46
© 2011 Pearson Education, Inc.

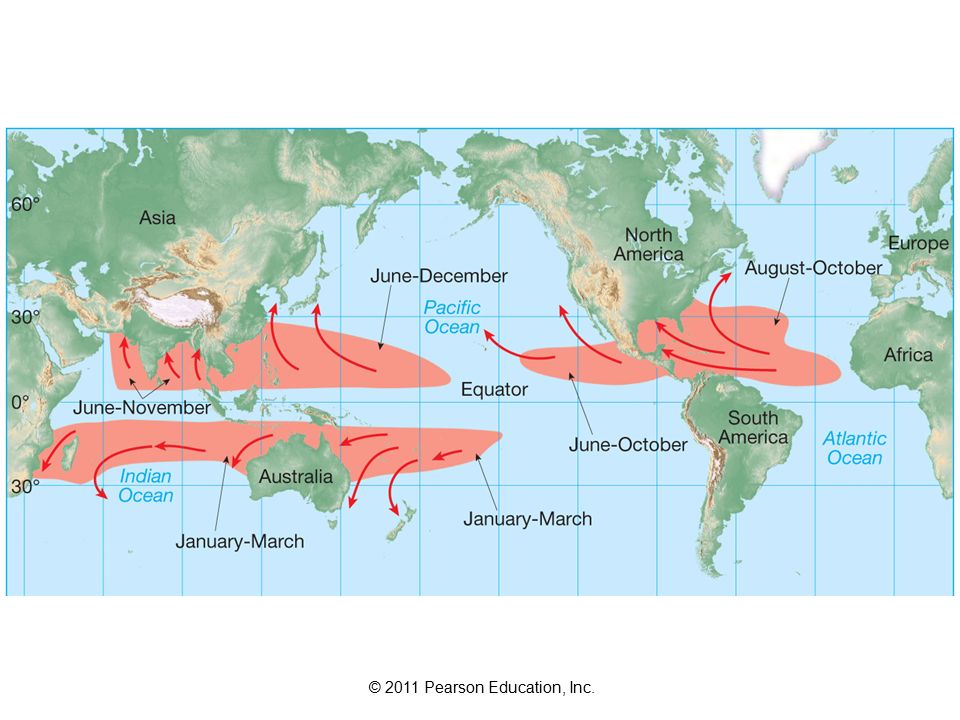
48
Profile Known as Typhoons in the western Pacific Cyclones in the Indian Ocean North Pacific has the greatest number per year Parts of a hurricane Eyewall Near the center Rising air Intense convective activity

49
© 2011 Pearson Education, Inc. Hurricanes Profile Parts of a hurricane Eyewall Wall of cumulonimbus clouds Greatest wind speeds Heaviest rainfall

50
© 2011 Pearson Education, Inc. Hurricanes Profile Parts of a hurricane Eye At the very center About 20 kilometers (12.5 miles) diameter Precipitation ceases Winds subsides Air gradually descends and heats by compression Warmest part of the storm
 diameter Precipitation ceases Winds subsides Air gradually descends and heats by compression Warmest part of the storm.")
51
© 2011 Pearson Education, Inc. Cross section of a hurricane

52
© 2011 Pearson Education, Inc.

53
Profile Wind speeds reach 300 kilometers per hour Generate 50-foot waves at sea Hurricane formation and decay Form in all tropical waters except the South Atlantic and Eastern South Pacific

54
© 2011 Pearson Education, Inc. Hurricane formation and decay Energy comes from condensing water vapor Develop most often in late summer when warm water temperatures provide energy and moisture Tropical depression—Winds do not exceed 61 kilometers (38 miles) per hour Tropical storm—Winds between 61 to 119 kilometers (38 and 74 miles) per hour
 per hour Tropical storm—Winds between 61 to 119 kilometers (38 and 74 miles) per hour.")
55
© 2011 Pearson Education, Inc. Hurricane formation and decay Diminish in intensity whenever They move over cooler ocean water They move onto land The large-scale flow aloft is unfavorable

56
© 2011 Pearson Education, Inc. Hurricane destruction Factors that affect amount of hurricane damage Strength of storm (the most important factor) Size and population density of the area affected Shape of the ocean bottom near the shore Saffir-Simpson scale ranks the relative intensities of hurricanes
 Size and population density of the area affected Shape of the ocean bottom near the shore Saffir-Simpson scale ranks the relative intensities of hurricanes.")
57
© 2011 Pearson Education, Inc. Hurricane destruction Categories of hurricane damage Storm surge—Large dome of water 65 to 80 kilometers (40 to 50 miles) wide sweeps across the coast where eye makes landfall Wind damage Inland flooding from torrential rains
 wide sweeps across the coast where eye makes landfall Wind damage Inland flooding from torrential rains.")
58
© 2011 Pearson Education, Inc.

59
Tracking Hurricanes

60
© 2011 Pearson Education, Inc.

61
Questions?

Similar presentations


 or more across Perhaps several.>")


