Download presentation
Presentation is loading. Please wait.

1
Summary Five numbers summary, percentiles, mean Box plot, modified box plot Robust statistic – mean, median, trimmed mean outlier Measures of variability range, IQR, average absolute deviation, variation and standard deviation Average distance between each data value and the mean is zero.

2
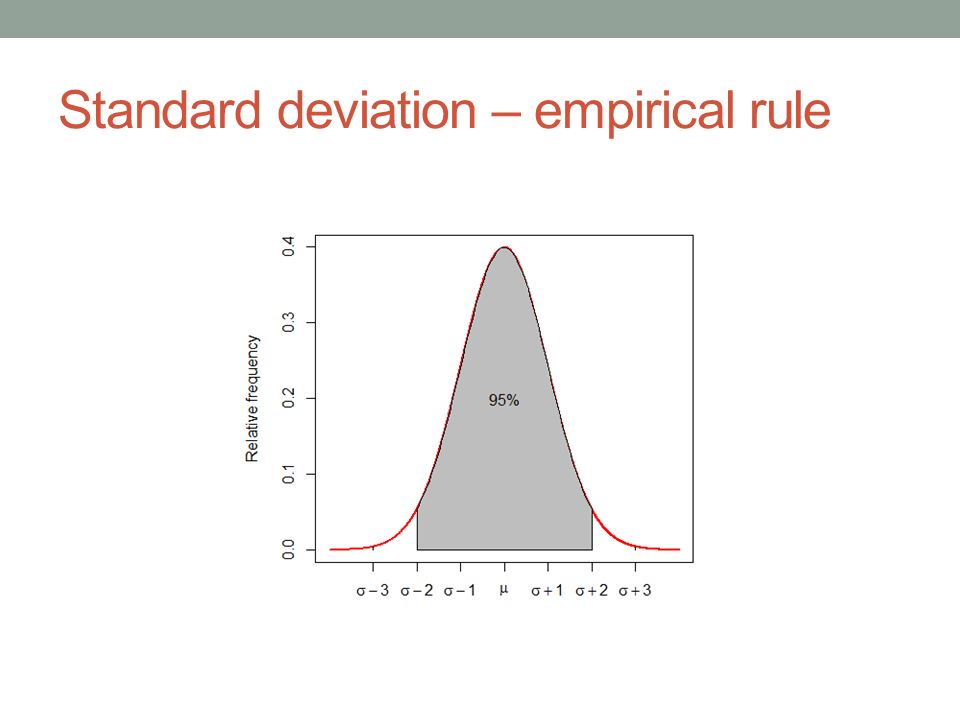
Standard deviation – empirical rule

5
population (census) vs. sample parameter (population) vs. statistic (sample)
 vs. sample parameter (population) vs. statistic (sample)")
6
Bias, sampling

7
SRS sampling with replacement Generates independent samples. Two sample values are independent if that what we get on the first one doesn't affect what we get on the second. sampling without replacement Deliberately avoid choosing any member of the population more than once. This type of sampling is not independent, however it is more common. The error is small as long as 1. the sample is large 2. the sample size is no more than 10% of population size

9
Bessel’s game Sample Sample average Sample variance (n-1)Sample variance (n) 0,2121 0,4284 2,0121 2,4321 4,0284 4,2321 0,0000 2,2200 4,4400 average
Sample variance (n) 0,2121 0,4284 2,0121 2,4321 4,0284 4,2321 0,0000 2,2200 4,4400 average")
10
Histogram revision Distribution – the pattern of values in the data Histogram – visualizing the distribution We can see whether the data tend to be close to the particular value whether the data varies a lot or a little about the most common values whether that variation tends to be more above or below the common values whether there are unusually large or small values in the data

11
Life expectancy data – histogram Use interactive histogram applet to generate histogram with bin size of 10, starting at 40. life expectancy frequency

12
Life expectancy data – histogram life expectancy frequency

13
Making conclusions from a histogram What all you can tell for life expectancy data? how many modes? where is the mode? symmetric, left skewed or right skewed? outliers – yes or no? life expectancy frequency

14
Making conclusions from a histogram Where is the mode, the median, the mean? life expectancy frequency

15
Min. Q1 Median Q3 Max. 47.79 64.67 73.24 76.65 83.39 Five numbers summary What is the position of the mean and the median?

17
symmetric, left or rigt skewed?

18
STANDARDIZING normování

19
Playing chess Pretend I am a chess player. Which of the following tells you most about how good I am: 1. My rating is 1800. 2. 8110 th place among world competitive chess players. 3. Ranked higher than 88% of competitive chess players.

20
Distribution Distribution of scores in one particular year We should use relative frequencies and convert all absolute frequencies to proportions.

21
Height data – absolute frequencies http://wiki.stat.ucla.edu/socr/index.php/SOCR_Data_Dinov_020108_HeightsWeights

22
Height data – relative frequencies

24
What proportion of values is between 170 cm and 173.75 cm? 30%

25
Height data – relative frequencies What proportion of values is between 170 cm and 175 cm? We can’t tell for certain.

26
How should we modify data/histogram to allow us a more detail? 1. Adding more value to the dataset 2. Increasing the bin size 3. A smaller bin size

27
Height data – relative frequencies What proportion of values is between 170 cm and 175 cm? 36%

28
Height data – relative frequencies

29
Decreasing bin size Check out what happens with the smallest bin size for Physics Test Scores from http://quarknet.fnal.gov/cosmics/histo.shtml. http://quarknet.fnal.gov/cosmics/histo.shtml

30
Height

31
Height data – relative frequencies

32
Normal distribution recall the empirical rule 68-95-99.7

33
Empirical rule 0 +1+2+3-2 -3 3 4 5 6 2 1 0

34
Z Z – number of standard deviations away from the mean If the Z-value is 1, how many percent are less than that value? cca 84 % 0 +1+2+3-2 -3

35
Who is more popular? Let’s demonstrate the importance of Z-scores with the following example.

36
Who is more popular s.d. = 36 s.d. = 60 Z = -3.53 Z = -2.57

37
Standardizing

38
Formula

39
Quiz What does a negative Z-score mean? 1. The original value is negative. 2. The original value is less than mean. 3. The original value is less than 0. 4. The original value minus the mean is negative.

40
Quiz II If we standardize a distribution by converting every value to a Z-score, what will be the new mean of this standardized distribution? If we standardize a distribution by converting every value to a Z-score, what will be the new standard deviation of this standardized distribution?

41
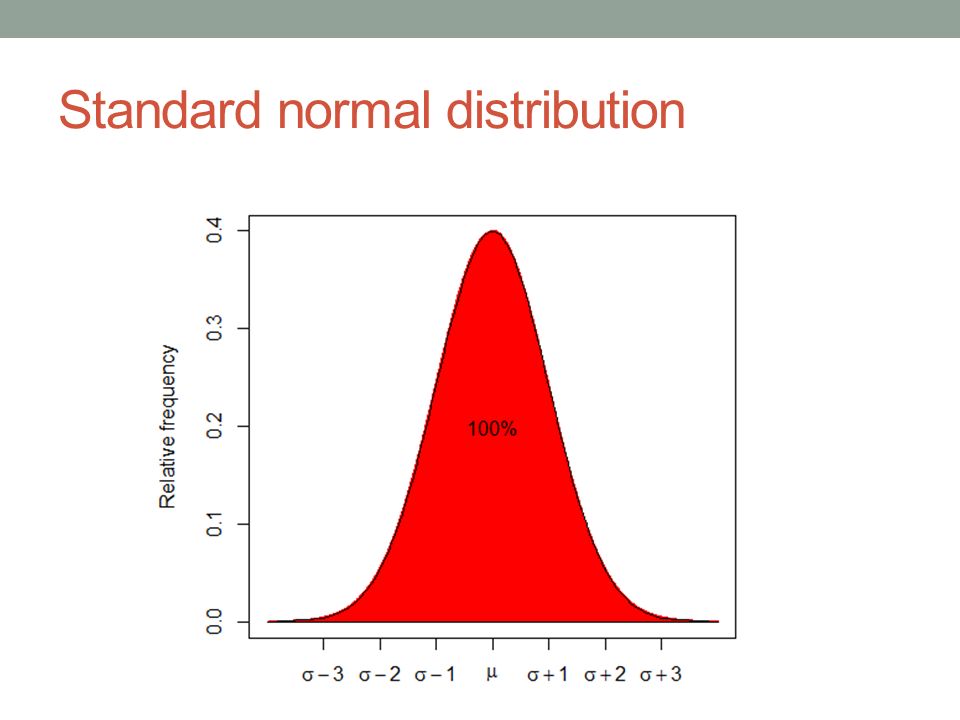
Standard normal distribution

43
Meaning of relative frequencies 52324 13433 1 2 2 3 3 3 3 4 4 5

44
Histogram of these data

45
Probability density function Probability density function (PDF) Hustota pravděpodobnosti
 Hustota pravděpodobnosti")
46
Standard normal distribution

Similar presentations