Download presentation
Presentation is loading. Please wait.

1
Fatigue & Driving: Who is At Risk A Laboratory and Field Perspective Christopher L. Drake, PhD Wake Up Michigan! September 20, 2007 Christopher Drake, PhD, D.ABSM Senior Bioscientific Staff Henry Ford Hospital Sleep Center Assistant Professor Wayne State University College of Medicine

2
The Sleep Facts Adult sleep need is 8.2 per 24 hours, with little variability (homeostatic “set point”) Impairment in performance occurs with as little as 2 hours less per night. Sleep debt from restricting sleep to 5-6 hours a night accumulates with time, and awareness of sleepiness declines. Circadian timing has a major impact on performance, and is not addressed in many service guidelines (i.e., truckers, aviation)
")
3
Consequences of Sleep Loss
Behavioral/Mood Sleepiness Psychomotor Impairment Accidents Decreased Work Productivity Reduced Quality of Life Deficits in Learning/Memory Stimulant Seeking Alcohol Interaction Mood Effects Lack of Awareness Physiologic Hypoxemia Insulin Resistance Sympathetic Activity Blunted Arousal Response (hypoxemia, C02, EEG)
")
4
The Scope of the Problem
Estimates by US National Highway Traffic Safety Administration 1-4% of highway crashes caused by sleepiness Principal cause in 100,000 police-reported crashes 4% of all fatal accidents caused by sleepiness A drowsy driver operating a motor vehicle at 60 mph in the right-hand lane (12’ wide) of a divided highway with a breakdown lane (11’ wide) can drift off the road at ~4° angle in less than 4 seconds The motor vehicle accident figures from the NHTSA include crashes that occur between midnight and 6 AM, involve a single vehicle and a sober driver traveling alone, with the car leaving the roadway without any attempt to avoid the crash. Thus these figures are underestimates because they do not include crashes involving daytime hours, multiple vehicles, alcohol, passengers, or evasive maneuvers. National Highway Traffic Safety Administration Available at:
 of a divided highway with a breakdown lane (11’ wide) can drift off the road at ~4° angle in less than 4 seconds. The motor vehicle accident figures from the NHTSA include crashes that occur between midnight and 6 AM, involve a single vehicle and a sober driver traveling alone, with the car leaving the roadway without any attempt to avoid the crash. Thus these figures are underestimates because they do not include crashes involving daytime hours, multiple vehicles, alcohol, passengers, or evasive maneuvers. National Highway Traffic Safety Administration Available at:")
6
Causes of Excessive Daytime Sleepiness
Reduced Sleep at Night Reduced Sleep Length Reduced Sleep Continuity Circadian Phase CNS acting Drugs CNS Diseases

7
Reported Total Sleep Time (Ages 18-23)
Terman & Hocking, 1913 Roth, et al, 2003 (unpubl) Reported Total Sleep Time (hrs/night) Survey Year
 Reported Total Sleep Time. (hrs/night) Survey Year.")
8
Mean Reported Nightly Total Sleep Time (2-weeks)
6.8 hrs/nt N=3283 10% 15% 8% Percent 6% 4% 2% 180 240 300 360 420 480 540 600 660 Nightly Total Sleep Time (min) Drake et al., 2002
 Drake et al.,")
9
Sleepiness accumulates over time
4h TIB 6h TIB Experiments on chronic restriction of sleep from 1-2 weeks reveal cumulative increases in lapse rates in a sleep-dose response manner. 8h TIB 3h TIB A. Van Dongen HPA et al. Sleep ;26: Belenky G et al. J. Sleep Res ;12:1-12. Review: Dinges DF et al. Chronic Sleep Restriction. In: Kryger MH et al. (Ed.) Principles and Practice of Sleep Medicine W.B. Saunders, Philadelphia, PA, 2005, but that only lasts for several days, over time even 6 hrs of sleep will accumulate to produce impairment after 2 weeks that seemingly minor sleep loss will produce extreme decrements in performance similar to 1-2 nights of total sleep loss. 5h TIB 7h TIB 9h TIB
 Principles and Practice of Sleep Medicine W.B. Saunders, Philadelphia, PA, 2005, but that only lasts for several days, over time even 6 hrs of sleep will accumulate to produce impairment after 2 weeks that seemingly minor sleep loss will produce extreme decrements in performance similar to 1-2 nights of total sleep loss. 5h TIB. 7h TIB. 9h TIB.")
11
Vehicle Accident Data No. of Accidents 1200 1100 1000 900 800 700 600
International Data N = 6052 1200 1100 1000 900 800 700 600 500 400 300 200 100 No. of Accidents In the US everyone has a driving record so it is one of the things we can get very accurate data on across the day. Here is the distribution of car accidents Midnight 6 AM Noon 6 PM Midnight Mitler MM, et al. Sleep

12
Overlay of Vehicle Accident Data, Performance Errors, and Circadian Rhythms
These data are exactly overlaping and they coiencide with the Circadian cycle measure of body temperature and other physiol. Parameters that have a circadian pattern Midnight 6 AM Noon 6 PM

13
Populations at High Risk Of Sleepiness/Fatigue Related Accidents
Transportation workers Medical staff Young males Shift workers Patients with chronic psychiatric disease Patients with chronic medical disease People with sleep disorders are not the only ones who are at risk for excessive sleepiness. Other groups are also at heightened risk for excessive sleepiness, and include: Transportation workers such as truck and train drivers Commuters who spend excessive time traveling to and from work Shift workers, especially individuals who work night shifts Medical staff who work long extended hours Patients with chronic psychiatric disease Young men Patients with chronic medical disease Together, these at-risk groups make up a fairly large segment of the population, even without taking into account people with sleep disorders.

14
Relationship between sleepiness & Accidents
Approximately 27% of drivers who have lost consciousness behind the wheel fell asleep as opposed to fainting, seizure, heart attack, etc. Importantly, this 27% accounted for 83% of the fatalities. Parsons, 1986 QJM.

15
Extended Work Shifts and Risk for Motor Vehicle Accidents Among Interns
Nonextended Shifts (<24 h) Extended Shifts (≥24 h) 0 Extended Shifts 1-4 Extended Shifts >4 Extended Shifts * * 3.7 * 5.9 * Odds Ratio (95% CI) Odds Ratio (95% CI) 2.4 * * 1.8 1.7 EXTENDED WORK SHIFTS AND THE RISK OF MOTOR VEHICLE CRASHES AMONG INTERNS BACKGROUND: Long work hours and work shifts of an extended duration (> or =24 hours) remain a hallmark of medical education in the United States. Yet their effect on health and safety has not been evaluated with the use of validated measures. METHODS: We conducted a prospective nationwide, Web-based survey in which 2,737 residents in their first postgraduate year (interns) completed 17,003 monthly reports that provided detailed information about work hours, work shifts of an extended duration, documented motor vehicle crashes, near-miss incidents, and incidents involving involuntary sleeping. RESULTS: The odds ratios for reporting a motor vehicle crash and for reporting a near-miss incident after an extended work shift, as compared with a shift that was not of extended duration, were 2.3 (95 percent confidence interval, 1.6 to 3.3) and 5.9 (95 percent confidence interval, 5.4 to 6.3), respectively. In a prospective analysis, every extended work shift that was scheduled in a month increased the monthly risk of a motor vehicle crash by 9.1 percent (95 percent confidence interval, 3.4 to 14.7 percent) and increased the monthly risk of a crash during the commute from work by 16.2 percent (95 percent confidence interval, 7.8 to 24.7 percent). In months in which interns worked five or more extended shifts, the risk that they would fall asleep while driving or while stopped in traffic was significantly increased (odds ratios, 2.39 [95 percent confidence interval, 2.31 to 2.46] and 3.69 [95 percent confidence interval, 3.60 to 3.77], respectively). CONCLUSIONS: Extended-duration work shifts, which are currently sanctioned by the Accreditation Council for Graduate Medical Education, pose safety hazards for interns. These results have implications for medical residency programs, which routinely schedule physicians to work more than 24 consecutive hours. Copyright 2005 Massachusetts Medical Society. 2.3 1.0 1.0 1.0 1.0 Crashes Near-miss Incidents Driving Stopped Nod Off or Fall Asleep *P <0.05 vs nonextended shifts or no extended shifts. Barger LK, et al. N Engl J Med. 2005;352: 15
 Extended Shifts (≥24 h) 0 Extended Shifts. 1-4 Extended Shifts. >4 Extended Shifts. * * 3.7. * 5.9. * Odds Ratio (95% CI) Odds Ratio (95% CI) 2.4. * * EXTENDED WORK SHIFTS AND THE RISK OF MOTOR VEHICLE CRASHES AMONG INTERNS. BACKGROUND: Long work hours and work shifts of an extended duration (> or =24 hours) remain a hallmark of medical education in the United States. Yet their effect on health and safety has not been evaluated with the use of validated measures. METHODS: We conducted a prospective nationwide, Web-based survey in which 2,737 residents in their first postgraduate year (interns) completed 17,003 monthly reports that provided detailed information about work hours, work shifts of an extended duration, documented motor vehicle crashes, near-miss incidents, and incidents involving involuntary sleeping. RESULTS: The odds ratios for reporting a motor vehicle crash and for reporting a near-miss incident after an extended work shift, as compared with a shift that was not of extended duration, were 2.3 (95 percent confidence interval, 1.6 to 3.3) and 5.9 (95 percent confidence interval, 5.4 to 6.3), respectively. In a prospective analysis, every extended work shift that was scheduled in a month increased the monthly risk of a motor vehicle crash by 9.1 percent (95 percent confidence interval, 3.4 to 14.7 percent) and increased the monthly risk of a crash during the commute from work by 16.2 percent (95 percent confidence interval, 7.8 to 24.7 percent). In months in which interns worked five or more extended shifts, the risk that they would fall asleep while driving or while stopped in traffic was significantly increased (odds ratios, 2.39 [95 percent confidence interval, 2.31 to 2.46] and 3.69 [95 percent confidence interval, 3.60 to 3.77], respectively). CONCLUSIONS: Extended-duration work shifts, which are currently sanctioned by the Accreditation Council for Graduate Medical Education, pose safety hazards for interns. These results have implications for medical residency programs, which routinely schedule physicians to work more than 24 consecutive hours. Copyright 2005 Massachusetts Medical Society Crashes. Near-miss Incidents. Driving. Stopped. Nod Off or Fall Asleep. *P <0.05 vs nonextended shifts or no extended shifts. Barger LK, et al. N Engl J Med. 2005;352:")
16
Obstructive Sleep Apnea
Courtesy of Dr. Jonathan R.L. Schwartz. University of Oklahoma Health Sciences Center.

18
Excessive Sleepiness and Driving Collisions, Costs and Fatalities
Consequences of OSAS 810K collisions $15.9 billion in collision costs 1,400 fatalities Estimated cost-savings with CPAP treatment Prevent >500K collisions Reduce collision costs by $11.1 billion Save nearly 1,000 lives Meta-Analysis of 6 studies: Risk of MVC is greater in drivers with OSAS than drivers without OSAS Findley, 1998 Barbe, 1998 Teran-Santos, 1999 Hortsmann, 2000 Lioberes, 2000 Excessive sleepiness also threatens the health and even life of those with this symptom. Sassani et al found that drivers with obstructive sleep apnea syndrome were at greater risk for motor vehicle accidents and related mortality than were healthy drivers, and had higher associated collision costs. The investigators determined that while the annual cost of treating sleep apnea patients is approximately $3.18 billion, including screening costs, collision costs for accidents caused by sleep apnea patients amounted to approximately $15.9 billion annually. These collision costs could be reduced annually by $11.1 billion following the institution of CPAP treatment, assuming a 70 percent effectiveness rate. Sassani A, et al. Sleep 2004;27(3): George, 2001 Fixed Combined 0.5 1 2 5 10 Odds Ratio CPAP, continuous positive airway pressure; MVC, motor-vehicle collision; OSAS, obstructive sleep apnea syndrome. Sassani A, et al. Sleep. 2004;27(3):
: George, Fixed Combined Odds Ratio. CPAP, continuous positive airway pressure; MVC, motor-vehicle collision; OSAS, obstructive sleep apnea syndrome. Sassani A, et al. Sleep. 2004;27(3):")
19
Car Crashes in Sleep Apnea Patients
0.6 0.5 0.4 Crashes/Driver/5-Year (Millions) 0.3 0.2 0.1 Car crashes in sleep apnea patients All Drivers (N=3.7) Mild Apnea (N=16) Moderate Apnea (N=17) Severe Apnea (N=13) Findley LJ et al. N Engl J Med 1989.
 Car crashes in sleep apnea patients. All Drivers (N=3.7) Mild Apnea (N=16) Moderate Apnea (N=17) Severe Apnea (N=13) Findley LJ et al. N Engl J Med")
20
Epidemiology Established OSA=5% 95% of patients with clinically significant and treatable OSA remain undiagnosed

21
Hours of Sleep and Equivalent Blood Alcohol Level for Sedative Effects
Legal Intoxication† BrEC, %* As measured on the Multiple Sleep Latency Test, which is an objective test administered in a sleep clinic, people who slept less than or equal to 4 hours a night were as sedated as people who had a blood alcohol concentration greater than the legal limit. Getting the following hours of sleep per night is similar to consuming the following number of 12-oz beers: 6 h sleep ≈ 2 to 3 beers 4 h sleep ≈ 5 to 6 beers, the ethanol content of which is considered above the legal intoxication limit in many states 2 h sleep ≈ 7 to 8 beers 0 h sleep ≈ 10 to 11 beers Roehrs T, et al. Sleep. 2003;26: Sleep time (hours in bed) *Approximate breath ethanol concentration (BrEC) at peak; †Above 0.05% for legal intoxication in many states. N=32 healthy subjects without prior sleep deprivation and with 85% sleep efficiency. Sleep loss group (n=12) was tested in all 4 conditions, with 3 to 7 days of recovery time between tests, and compared with ethanol group (n=20). Roehrs T, et al. Sleep. 2003;26:
 *Approximate breath ethanol concentration (BrEC) at peak; †Above 0.05% for legal intoxication in many states. N=32 healthy subjects without prior sleep deprivation and with 85% sleep efficiency. Sleep loss group (n=12) was tested in all 4 conditions, with 3 to 7 days of recovery time between tests, and compared with ethanol group (n=20). Roehrs T, et al. Sleep. 2003;26:")
22
Combined Effects Sleep deprivation is often combined with other impairment (e.g., alcohol) and these combined effects can be devastating to driver performance
 and these combined effects can be devastating to driver performance.")
23
Driving Simulator Data

24
Sleep-Alcohol Interaction (Driving Simulator—AM)
40 Placebo 35 Ethanol 30 25 Off-Road Deviations 20 15 10 5 8 HR 4 HR Time in Bed (Mean [SEM]) Roehrs, et al. Alcohol Clin Exp Res 1994;18:154.
 Roehrs, et al. Alcohol Clin Exp Res 1994;18:154.")
25
Sleep Deprivation Is Associated With Decreased Cortical Activity
18FDG PET Study of Healthy, Sleep-Deprived Adults, Showing Decreased Metabolism in the Thalamus, Prefrontal Cortex, and Inferior Parietal Cortex Inferior parietal cortex Prefontal cortex Occipital cortex Very clearly – frontal cortex is affected most – planning, multitasking, performing novel tasks. Thalamus FDG, fluorodeoxyglucose; PET, positron emission tomography. Thomas M et al. J Sleep Res. 2000;9:335.

26
Detection of “Microsleeps” in Medical Residents
Physiologic State Sleep Wake Sleep 51% 12% Reported State Wake 49% 88% 100% 100% Howard et al., 2002

27
Subjective vs. Objective Sleepiness During 4 nights of
“Gradual” Sleep Loss (6hrs TIB) MSLT (min) Subjective “Fatigue” Drake et al., 2001
 MSLT (min) Subjective Fatigue Drake et al.,")
29
Time in Bed and Excessive Sleepiness
18 16 14 12 R2=0.9791 10 MSLT Latency (Minutes) 8 6 4 Influence of homeostat linear increase in sleepiness with amount of sleep loss ************************************************************************ Sleep Apr;16(3): Related Articles, Links Level of sleepiness and total sleep time following various time in bed conditions. Rosenthal L, Roehrs TA, Rosen A, Roth T. Sleep Disorders and Research Center, Henry Ford Hospital, Detroit, Michigan. The effects of various time in bed (TIB) conditions on daytime sleepiness and total sleep time (during a 24-hour enforced bedtime) were investigated. Thirty-two healthy male subjects participated in the study. Subjects were assigned to one of four groups to balance average screening multiple sleep latency tests (MSLT). Subjects were randomly assigned to spend 8, 6, 4 or 0 hours time in bed. They underwent the same TIB condition twice with at least 7 days between the two sessions. Following their assigned time in bed conditions, subjects were counterbalanced to have a standard MSLT and a 24-hour enforced bedtime protocol. To assess the effect of TIB on the MSLT, the sleep latencies were submitted to a four (TIB condition) by four (nap test) multivariate analysis of variance. The sleep latencies were shorter for those subjects in the 0-hours condition when compared to the other three conditions. Also, the sleep latencies of those subjects in the 4- and 6-hour conditions were comparable but different from those of subjects in the 8- and 0-hour TIB conditions. To assess the effect of TIB on the 24-hour enforced bedtime, the total sleep time during this period was submitted to a six (4-hour block) by four (TIB condition) multivariate analysis of variance. Subjects slept more following 0 hours TIB when compared to the other three conditions. There were no statistically significant differences between the 8-, 6- and 4-hour TIB conditions. Across conditions, subjects slept more during the first 4 hours when compared to blocks 2, 3, 4 and 5. Blocks 1 and 6 were comparable.(ABSTRACT TRUNCATED AT 250 WORDS) Publication Types: Clinical Trial Randomized Controlled Trial PMID: [PubMed - indexed for MEDLINE] 2 8 6 4 Time in Bed (Hours) * standard deviation; MSLT = Multiple Sleep Latency Test; Rosenthal L et al. (1993), Sleep 16(3):
 Influence of homeostat linear increase in sleepiness with amount of sleep loss. ************************************************************************ Sleep Apr;16(3): Related Articles, Links. Level of sleepiness and total sleep time following various time in bed conditions. Rosenthal L, Roehrs TA, Rosen A, Roth T. Sleep Disorders and Research Center, Henry Ford Hospital, Detroit, Michigan. The effects of various time in bed (TIB) conditions on daytime sleepiness and total sleep time (during a 24-hour enforced bedtime) were investigated. Thirty-two healthy male subjects participated in the study. Subjects were assigned to one of four groups to balance average screening multiple sleep latency tests (MSLT). Subjects were randomly assigned to spend 8, 6, 4 or 0 hours time in bed. They underwent the same TIB condition twice with at least 7 days between the two sessions. Following their assigned time in bed conditions, subjects were counterbalanced to have a standard MSLT and a 24-hour enforced bedtime protocol. To assess the effect of TIB on the MSLT, the sleep latencies were submitted to a four (TIB condition) by four (nap test) multivariate analysis of variance. The sleep latencies were shorter for those subjects in the 0-hours condition when compared to the other three conditions. Also, the sleep latencies of those subjects in the 4- and 6-hour conditions were comparable but different from those of subjects in the 8- and 0-hour TIB conditions. To assess the effect of TIB on the 24-hour enforced bedtime, the total sleep time during this period was submitted to a six (4-hour block) by four (TIB condition) multivariate analysis of variance. Subjects slept more following 0 hours TIB when compared to the other three conditions. There were no statistically significant differences between the 8-, 6- and 4-hour TIB conditions. Across conditions, subjects slept more during the first 4 hours when compared to blocks 2, 3, 4 and 5. Blocks 1 and 6 were comparable.(ABSTRACT TRUNCATED AT 250 WORDS) Publication Types: Clinical Trial. Randomized Controlled Trial. PMID: [PubMed - indexed for MEDLINE] Time in Bed (Hours) * standard deviation; MSLT = Multiple Sleep Latency Test; Rosenthal L et al. (1993), Sleep 16(3):")
30
Crashes and the MSLT (10 year prevalence)
% N=345 SEVERE MODERATE ALERT Multiple Sleep Latency Test Groups Cochran-Armitage Trend Test, p = .048 Drake et al., prelim. data

31
Severe Injury Accidents Only
* * N=69 % subjects with crash N=204 N=345 < 5 5-10 >10 SEVERE MODERATE ALERT Multiple Sleep Latency Test Groups * p < .05; Cochran-Armitage, p = .028 Severe injury accidents were those which “prevent normal activities and require hospitalization”

32
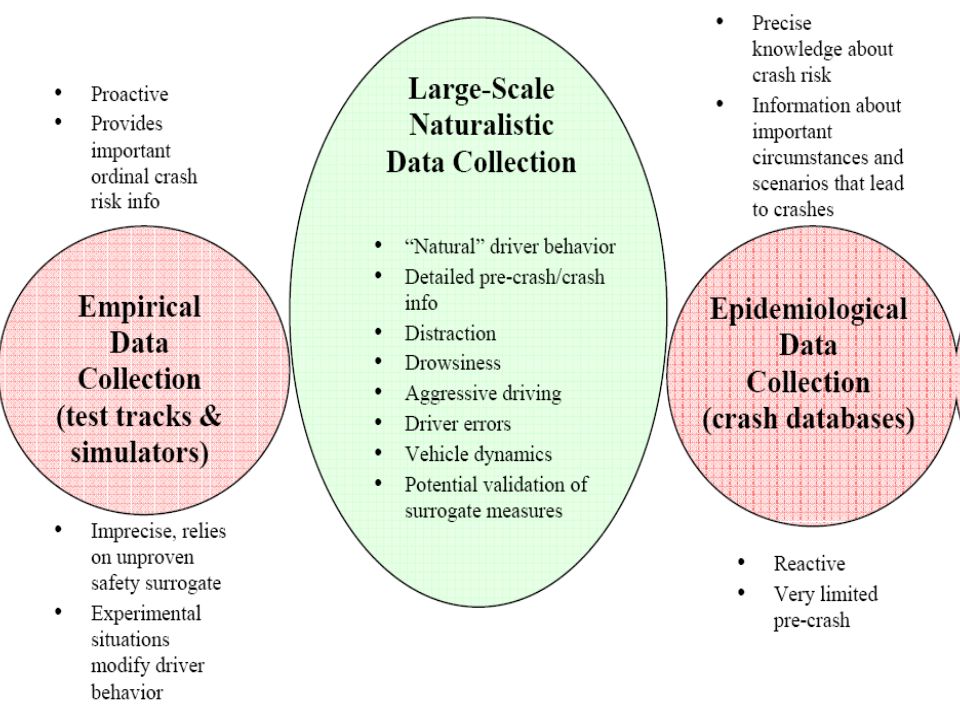
100-Car Study: Crashes and Near-crashes

33
100-Car Study Drowsiness also appears to affect crashes and collisions at much higher rates than is reported using existing crash databases. Drowsiness was a contributing factor in 12 percent of all crashes and 10 percent of near- crashes, while most current database estimates place drowsiness-related crashes at approximately 2 to 4 percent of total crashes.

34
Summary Sleep need is ~8 hours per 24
Sleepiness can be measured physiologically Reduced sleep below 6 hrs/nt = Excessive sleepiness Detection of sleepiness/fatigue and judgment is impaired with chronic sleep loss Many segments of the population are at increased risk The extent of sleep-related accidents is probably underestimated Countermeasures = “sleep” not “rest”

Similar presentations


 Explain How Sleep Cycles, Hours and Circadian Rhythm Disturbances Can Develop Into Short- Term, Cumulative and Chronic Effects on Performance.>")


 Explain How Sleep Cycles, Hours and Circadian Rhythm Disturbances Can Develop Into Short- Term, Cumulative and.>")


 Impacting Workplace Safety and Cost.>")


