Download presentation
Presentation is loading. Please wait.

1
Chapter 4 Sensation and Perception

2
Sensation and Perception: The Distinction
Sensation : stimulation of sense organs Perception: selection, organization, and interpretation of sensory input Psychophysics = the study of how physical stimuli are translated into psychological experience Sensation and perception are hard to separate, because people automatically start organizing incoming sensory stimulation the moment it arrives. For theory and research, however, the distinction between the two is useful. Sensation is the stimulation of sense organs…for example absorbing energy from light by the eyes. Perception is the selection, organization, and interpretation of sensory input…translating the sensory input into something meaningful. Look at a photo of a rose in your text, your eyes sense the light reflecting from the page; what you perceive, however, is the picture of the rose. Psychophysics is the study of how physical stimuli are translated into psychological experience, thus psychologists in this area are interested mainly in sensation and perception.

3
Figure 4.1 The distinction between sensation and perception. Sensation involves the stimulation of sensory organs, whereas perception involves the processing and interpretation of sensory input. The two processes merge at the point where sensory receptors convert physical energy into neural impulses.

4
Psychophysics: Basic Concepts
Sensation begins with a detectable stimulus Fechner: the concept of the threshold Absolute threshold: detected 50% of the time. Just noticeable difference (JND): smallest difference detectable Weber’s law: size of JND proportional to size of initial stimulus Sensation begins with a detectable stimulus…but what counts as detectable depends on who or what is doing the detecting. Gustav Fechner (1860) questioned, for any given sense, what is the weakest detectable stimulus? The concept of the threshold is implicit in Fechner’s question. A threshold is defined in the text as a dividing point between energy levels that do and do not have a detectable effect…example, automatic lights turn on when a threshold is reached. An absolute threshold is the minimal amount of stimulation that an organism can detect…depend on the boundaries of an organism’s sensory capabilities…researchers discovered, however, that there is no single stimulus intensity that results in a jump from no detection to 100% detection every time…thus researchers use the concept of the absolute threshold…the stimulus intensity that can be detected 50% of the time. Fechner was also interested in the smallest difference in the amount of stimulation that a specific sense can detect…the just noticeable difference (JND): smallest difference detectable. Research on the JND by Ernst Weber illustrated that the size of a JND is a constant proportion of the size of the initial stimulus…in general, as stimuli increase in magnitude, the JND becomes larger.
: smallest difference detectable. Weber’s law: size of JND proportional to size of initial stimulus. Sensation begins with a detectable stimulus…but what counts as detectable depends on who or what is doing the detecting. Gustav Fechner (1860) questioned, for any given sense, what is the weakest detectable stimulus The concept of the threshold is implicit in Fechner’s question. A threshold is defined in the text as a dividing point between energy levels that do and do not have a detectable effect…example, automatic lights turn on when a threshold is reached. An absolute threshold is the minimal amount of stimulation that an organism can detect…depend on the boundaries of an organism’s sensory capabilities…researchers discovered, however, that there is no single stimulus intensity that results in a jump from no detection to 100% detection every time…thus researchers use the concept of the absolute threshold…the stimulus intensity that can be detected 50% of the time. Fechner was also interested in the smallest difference in the amount of stimulation that a specific sense can detect…the just noticeable difference (JND): smallest difference detectable. Research on the JND by Ernst Weber illustrated that the size of a JND is a constant proportion of the size of the initial stimulus…in general, as stimuli increase in magnitude, the JND becomes larger.")
5
Figure 4.2 The absolute threshold. If absolute thresholds were truly absolute, then at threshold intensity the probability of detecting a stimulus would jump from 0 to 100%, as graphed here in blue. In reality, the chances of detecting a stimulus increase gradually with stimulus intensity, as shown in red. Accordingly, an “absolute” threshold is defined as the intensity level at which the probability of detection is 50%.

6
Psychophysics: Concepts and Issues
Psychophysical scaling: Fechner’s Law Signal-detection Theory: Sensory processes + decision processes Subliminal perception: Existence vs. practical effects Sensory Adaptation: Decline in sensitivity Being asked if one light that has twice the energy of another is twice as bright is an example of scaling. Fechner’s Law asserts that larger and larger increases in stimulus intensity are required to produce JNDs in the magnitude of sensation. Signal detection theory holds that the detection of sensory information is influenced by two things…1) noise in the system (irrelevant stimuli in the environment that elicit neural activity) and 2) decision making processes. Signal detection theory was important in that it emphasized factors other than stimulus intensity influencing detectability (in contrast to Fechner’s ideas). Many researchers, using very different methods, have demonstrated that perception can occur without awareness. Many people believe that advertisers attempt to place subliminal messages in ads, while others say that people are just reading things into ads, like seeing familiar shapes in the clouds. Regardless, research shows that the effects of subliminal perception are relatively weak and of little practical impact. Prolonged stimulation may lead to sensory adaptation, or a decline in sensitivity to the stimulus…you don’t smell the skunk that sprayed you yesterday, but everyone else does…the pool is only cold at first…etc.
 noise in the system (irrelevant stimuli in the environment that elicit neural activity) and 2) decision making processes. Signal detection theory was important in that it emphasized factors other than stimulus intensity influencing detectability (in contrast to Fechner’s ideas). Many researchers, using very different methods, have demonstrated that perception can occur without awareness. Many people believe that advertisers attempt to place subliminal messages in ads, while others say that people are just reading things into ads, like seeing familiar shapes in the clouds. Regardless, research shows that the effects of subliminal perception are relatively weak and of little practical impact. Prolonged stimulation may lead to sensory adaptation, or a decline in sensitivity to the stimulus…you don’t smell the skunk that sprayed you yesterday, but everyone else does…the pool is only cold at first…etc.")
7
Figure 4.3 Possible outcomes in signal-detection theory. Four outcomes are possible in attempting to detect the presence of weak signals. The criterion you set for how confident you want to feel before reporting a signal will affect your responding. For example, if you require high confidence before reporting a signal, you will minimize false alarms, but you’ll be more likely to miss some signals.

8
Light = electromagnetic radiation Amplitude: perception of brightness
Vision: The Stimulus Light = electromagnetic radiation Amplitude: perception of brightness Wavelength: perception of color purity: mix of wavelengths perception of saturation, or richness of colors. Light is electromagnetic radiation that travels as a wave…the wave travels quickly…the speed of light. Light waves vary in height or amplitude (which affects brightness) and in wavelength (which affects color) or distance between peaks. Light can also vary in its purity, which has to do with how many different wavelengths are mixed together. Purity influences the perception of saturation, or richness of colors.
 and in wavelength (which affects color) or distance between peaks. Light can also vary in its purity, which has to do with how many different wavelengths are mixed together. Purity influences the perception of saturation, or richness of colors.")
9
Figure 4.5 Light, the physical stimulus for vision. (a) Light waves vary in amplitude and wavelength. (b) Within the spectrum of visible light, amplitude (corresponding to physical intensity) affects mainly the experience of brightness. Wavelength affects mainly the experience of color, and purity is the key determinant of saturation. (c) If white light (such as sunlight) passes through a prism, the prism separates the light into its component wavelengths, creating a rainbow of colors. However, visible light is only the narrow band of wavelengths to which human eyes happen to be sensitive.
 Light waves vary in amplitude and wavelength. (b) Within the spectrum of visible light, amplitude (corresponding to physical intensity) affects mainly the experience of brightness. Wavelength affects mainly the experience of color, and purity is the key determinant of saturation. (c) If white light (such as sunlight) passes through a prism, the prism separates the light into its component wavelengths, creating a rainbow of colors. However, visible light is only the narrow band of wavelengths to which human eyes happen to be sensitive.")
10
The Eye: Converting Light Into Neural Impulses
The eye: housing and channeling Components: Cornea: where light enters the eye Lens: focuses the light rays on the retina Iris: colored ring of muscle, constricts or dilates via amount of light Pupil: regulates amount of light The eye has two main purposes, providing a “house” for the neural tissue that receives light, the retina, and channeling light toward the retina. The eye is composed of the cornea, a transparent window where light enters the eye, the lens, which is a crystalline structure that lies right behind the cornea and focuses the light rays on the retina. The iris is the colored ring of muscle around the pupil (the black center of the eye), which constricts or dilates depending on the amount of light present in the environment and changes the size of the pupil. The size of the pupil regulates the amount of light by constricting to let in less light and vice versa.
, which constricts or dilates depending on the amount of light present in the environment and changes the size of the pupil. The size of the pupil regulates the amount of light by constricting to let in less light and vice versa.")
11
Light and the Eye Please choose the button below that corresponds to the type of operating system you are using:

13
The Retina: An Extension of the CNS
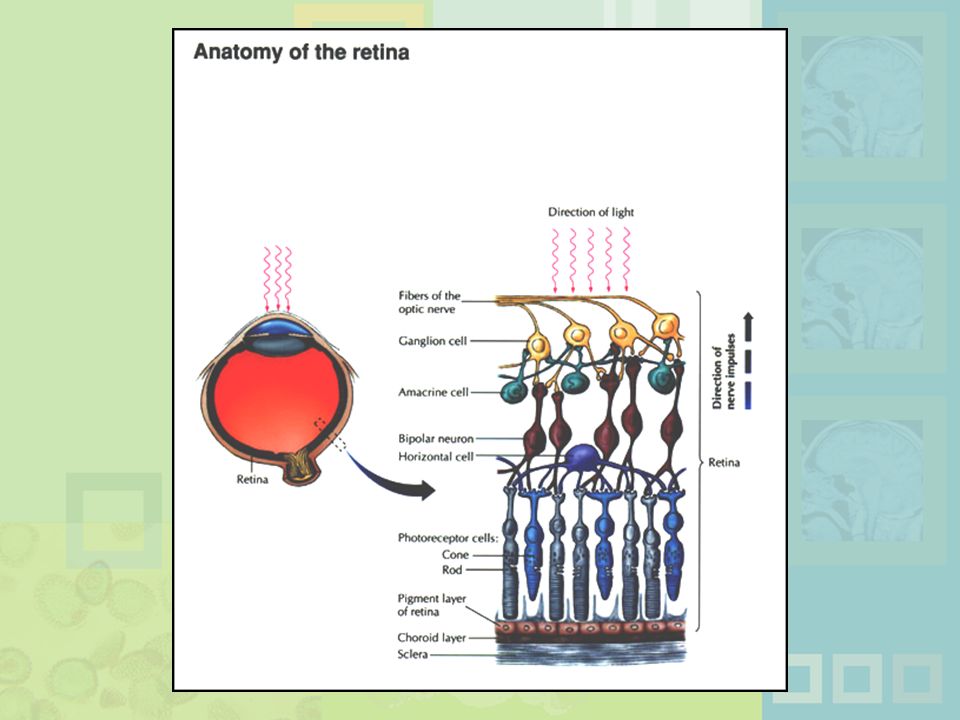
Retina: absorbs light, processes images, and sends information to the brain Optic disk: where the optic nerve leaves the eye/ blind spot Receptor cells: Rods: black and white/ low light vision Cones: color and daylight vision Adaptation: becoming more or less sensitive to light as needed The retina is a piece of neural tissue that lines the back of the eye…it absorbs light, processes images, and sends information to the brain. Axons from the retina to the brain converge at the optic disk, a hole in the retina where the optic nerve leaves the eye. If an image falls on this hole, it can’t be seen…the blind spot. The visual receptor cells in the axon are the rods (for black and white and low light vision) and the cones (for color and daylight vision). Adaptation, or becoming more or less sensitive to light as needed, occurs in partly due to chemical changes in the rods and cones.
 and the cones (for color and daylight vision). Adaptation, or becoming more or less sensitive to light as needed, occurs in partly due to chemical changes in the rods and cones.")
15
Figure 4.9 The distribution of rods and cones. (a) The names for rods and cones are based on their shape. As you can see here, rods are a little more elongated and cones are stubbier. (b) This chart shows how rods and cones are distributed in the retina. The eye on top shows some of the locations (in degrees relative to the fovea) that are listed along the bottom of the chart. As the purple graph shows, most of the cones are concentrated in the fovea. The density of the rods, graphed in red, is greatest just outside each side of the fovea and then declines toward the periphery. There are no receptors of either type in the blind spot, which is why it is the blind spot. (Source: Adapted from Lindsay & Norman, 1977)
 The names for rods and cones are based on their shape. As you can see here, rods are a little more elongated and cones are stubbier. (b) This chart shows how rods and cones are distributed in the retina. The eye on top shows some of the locations (in degrees relative to the fovea) that are listed along the bottom of the chart. As the purple graph shows, most of the cones are concentrated in the fovea. The density of the rods, graphed in red, is greatest just outside each side of the fovea and then declines toward the periphery. There are no receptors of either type in the blind spot, which is why it is the blind spot. (Source: Adapted from Lindsay & Norman, 1977)")
16
Figure 4.10 The process of dark adaptation. The declining thresholds over time indicate that your visual sensitivity is improving, as less and less light is required for you to be able to see. Visual sensitivity improves markedly during the first 5 to 10 minutes after entering a dark room, as the eye’s bright-light receptors (the cones) rapidly adapt to low light levels. However, the cones’ adaptation, which is plotted in purple, soon reaches its limit, and further improvement comes from the rods’ adaptation, which is plotted in red. The rods adapt more slowly than the cones, but they are capable of far greater visual sensitivity in low levels of light.
 rapidly adapt to low light levels. However, the cones’ adaptation, which is plotted in purple, soon reaches its limit, and further improvement comes from the rods’ adaptation, which is plotted in red. The rods adapt more slowly than the cones, but they are capable of far greater visual sensitivity in low levels of light.")
17
The Retina and the Brain: Visual Information Processing
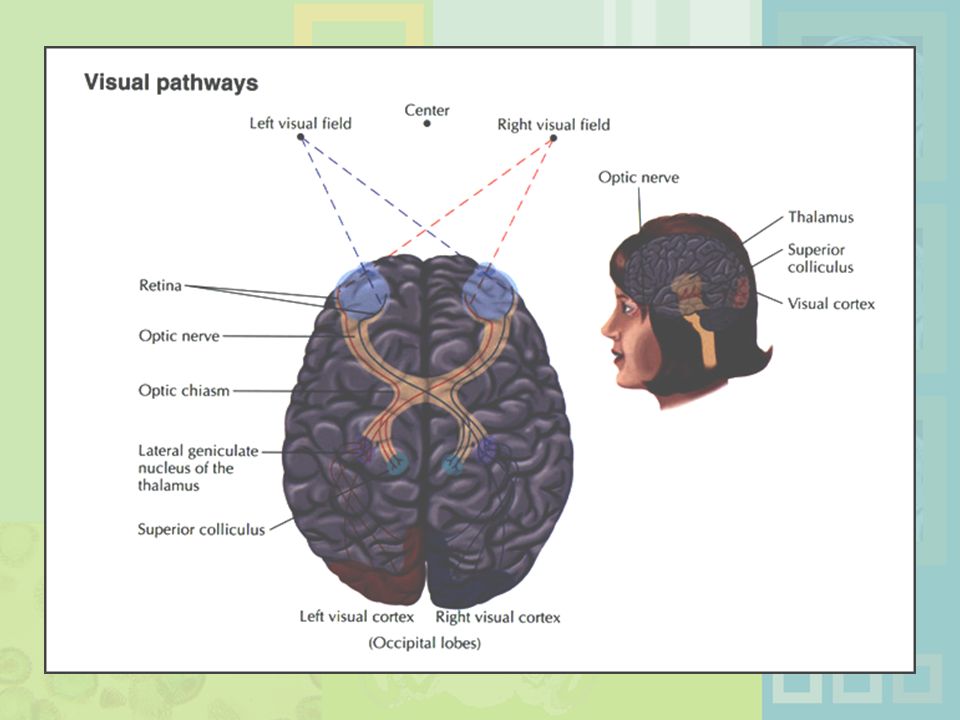
Light -> rods and cones -> neural signals -> bipolar cells -> ganglion cells -> optic nerve -> optic chiasm -> opposite half brain -> Main pathway: lateral geniculate nucleus (thalamus) -> primary visual cortex (occipital lobe) magnocellular: where parvocellular: what Second pathway: superior colliculus ->thalamus -> primary visual cortex The Retina and the Brain: Visual Information Processing Light striking the rods and cones triggers neural signals to move to bipolar cells then to ganglion cells, then along the optic nerve to the optic chiasm, where the optic nerves from the inside half of each eye cross over and project to the opposite half brain. This crossing ensures that signals from both eyes go to both hemispheres of the brain. After the crossing, 2 visual pathway exist. The main pathway goes through the lateral geniculate nucleus in the thalamus and on to the primary visual cortex in the occipital lobe. The other goes through the superior colliculus to the thalamus and on to the primary visual cortex. The main visual pathway is subdivided into two subspecialty pathways, the magnocellular channel, which processes information having to do with motion and depth (the where pathway), and the parvocellular channel (the what pathway), which processes information having to do with color, form and texture..
 -> primary visual cortex (occipital lobe) magnocellular: where. parvocellular: what. Second pathway: superior colliculus ->thalamus -> primary visual cortex. The Retina and the Brain: Visual Information Processing. Light striking the rods and cones triggers neural signals to move to bipolar cells then to ganglion cells, then along the optic nerve to the optic chiasm, where the optic nerves from the inside half of each eye cross over and project to the opposite half brain. This crossing ensures that signals from both eyes go to both hemispheres of the brain. After the crossing, 2 visual pathway exist. The main pathway goes through the lateral geniculate nucleus in the thalamus and on to the primary visual cortex in the occipital lobe. The other goes through the superior colliculus to the thalamus and on to the primary visual cortex. The main visual pathway is subdivided into two subspecialty pathways, the magnocellular channel, which processes information having to do with motion and depth (the where pathway), and the parvocellular channel (the what pathway), which processes information having to do with color, form and texture..")
19
Figure 4.7 The human eye. Light passes through the cornea, pupil, and lens and falls on the light-sensitive surface of the retina, where images of objects are reflected upside down. The closeup shows the several layers of cells in the retina. The cells closest to the back of the eye (the rods and cones) are the receptor cells that actually detect light. The intervening layers of cells receive signals from the rods and cones and form circuits that begin the process of analyzing incoming information before it is sent to the brain. These cells feed into many optic fibers, all of which head toward the “hole” in the retina where the optic nerve leaves the eye—the point known as the optic disk (which corresponds to the blind spot).
 are the receptor cells that actually detect light. The intervening layers of cells receive signals from the rods and cones and form circuits that begin the process of analyzing incoming information before it is sent to the brain. These cells feed into many optic fibers, all of which head toward the hole in the retina where the optic nerve leaves the eye—the point known as the optic disk (which corresponds to the blind spot).")
20
Figure 4.12 Visual pathways through the brain. (a) Input from the right half of the visual field strikes the left side of each retina and is transmitted to the left hemisphere (shown in red). Input from the left half of the visual field strikes the right side of each retina and is transmitted to the right hemisphere (shown in green). The nerve fibers from each eye meet at the optic chiasm, where fibers from the inside half of each retina cross over to the opposite side of the brain. After reaching the optic chiasm, the major visual pathway projects through the lateral geniculate nucleus in the thalamus and onto the primary visual cortex (shown with solid lines). A second pathway detours through the superior colliculus and then projects through the thalamus and onto the primary visual cortex (shown with dotted lines). (b) This inset shows a vertical view of how the optic pathways project through the thalamus and onto the visual cortex in the back of the brain (the two pathways mapped out in diagram (a) are virtually indistinguishable from this angle).
 Input from the right half of the visual field strikes the left side of each retina and is transmitted to the left hemisphere (shown in red). Input from the left half of the visual field strikes the right side of each retina and is transmitted to the right hemisphere (shown in green). The nerve fibers from each eye meet at the optic chiasm, where fibers from the inside half of each retina cross over to the opposite side of the brain. After reaching the optic chiasm, the major visual pathway projects through the lateral geniculate nucleus in the thalamus and onto the primary visual cortex (shown with solid lines). A second pathway detours through the superior colliculus and then projects through the thalamus and onto the primary visual cortex (shown with dotted lines). (b) This inset shows a vertical view of how the optic pathways project through the thalamus and onto the visual cortex in the back of the brain (the two pathways mapped out in diagram (a) are virtually indistinguishable from this angle).")
21
Figure 4.14 Visual pathways from the primary visual cortex. Cortical processing of visual input is begun in the primary visual cortex. From there, signals are shuttled through the secondary visual cortex and onward to a variety of other areas in the cortex along a number of pathways. Two prominent pathways are highlighted here. The magnocellular, or “where pathway,” which processes information about motion and depth, moves on to areas of the parietal lobe. The parvocellular, or “what pathway,” which processes information about color, form, and texture, moves on to areas of the temporal lobe.

22
Hubel and Wiesel: Feature Detectors and the Nobel Prize
Early 1960’s: Hubel and Wiesel Microelectrode recording of axons in primary visual cortex of animals Discovered feature detectors: neurons that respond selectively to lines, edges, etc. Groundbreaking research: Nobel Prize in 1981. Later research: cells specific to faces in the temporal lobes of monkeys and humans Hubel and Wiesel: Feature Detectors and the Nobel Prize In the early 1960’s H and W started research using microelectrode recording of axons in primary visual cortex of animals…initially they had little success getting neurons to fire by having the cats look at flashing spots of light. Accidentally, they introduced a straight line light…rapid firing occurred in the visual cortex. They went on to discover that the visual cortex has feature detectors in it, neurons that respond selectively to very specific features of complex stimuli…lines, edges, etc. This was groundbreaking research, which won them the Nobel Prize in 1981. Later research has demonstrated that there are cells in the temporal lobes of monkeys and humans (along the visual pathway) that specifically respond to pictures of faces…grandmother cells.
 that specifically respond to pictures of faces…grandmother cells.")
23
Figure 4.13 Hubel and Wiesel’s procedure for studying the activity of neurons in the visual cortex. As the cat is shown various stimuli, a microelectrode records the firing of a neuron in the cat’s visual cortex. The figure shows the electrical responses of a simple cell apparently “programmed” to respond to lines oriented vertically.

24
Wavelength determines color Longer = red / shorter = violet
Basics of Color Vision Wavelength determines color Longer = red / shorter = violet Amplitude determines brightness Purity determines saturation Color is a largely a function of wavelength Lights with the longest wavelengths appear red, while those with the shortest appear violet Amplitude is related to brightness and purity to saturation of color.

25
Figure 4.6 Saturation. Variations in saturation are difficult to describe, but you can see examples for two colors here.

26
Figure 4.17 Additive versus subtractive color mixing. Lights mix additively because all the wavelengths contained in each light reach the eye. If red, blue, and green lights are projected onto a white screen, they produce the colors shown on the left, with white at the intersection of all three lights. If paints of the same three colors were combined in the same way, the subtractive mixture would produce the colors shown on the right, with black at the intersection of all three colors.

27
Figure 4.16 Subtractive color mixing. Paint pigments selectively reflect specific wavelengths that give rise to particular colors, as you can see here for blue and yellow, which both also reflect back a little green. When we mix blue and yellow paint, the mixture absorbs all the colors that blue and yellow absorbed individually. The mixture is subtractive because more wavelengths are removed than by each paint alone. The yellow paint in the mixture absorbs the wavelengths associated with blue and the blue paint in the mixture absorbs the wavelengths associated with yellow. The only wavelengths left to be reflected back are some of those associated with green, so the mixture is seen as green.

28
Figure 4.18 Complementary colors. Colors opposite each other on this color circle are complements, or “opposites.” Additively mixing complementary colors produces gray. Opponent process principles help explain this effect as well as the other peculiarities of complementary colors noted in the text.

29
Theories of Color Vision
Trichromatic theory - Young and Helmholtz Receptors for red, green, blue – color mixing Opponent Process theory – Hering 3 pairs of antagonistic colors red/green, blue/yellow, black/white Current perspective: both theories necessary Young and Helmholtz, in the mid 1800’s came up with the first theory of color vision…trichromatic theory. This theory holds that the human eye has three types of receptors with differing sensitivities to different light wavelengths…one for red, one for green, and one for blue. All colors can be seen, according to this theory, because of color mixing. But what about yellow? Is it just reddish-green? Edward Hering, in 1878, proposed opponent process theory…which holds that color perception depends on receptors that make antagonistic responses to three pairs of colors…red on-green off, yellow on-blue off, black on-white off. This not only takes care of yellow, but also explains the phenomenon of complimentary afterimages… While researchers argued about which was right for almost a century, most psychologists now agree that it takes both theories to explain color vision.

31
Figure 4.11 Receptive fields in the retina and lateral antagonism. Visual cells’ receptive fields in the retina are often circular with a center-surround arrangement, so that light striking the center of the field produces the opposite result of light striking the surround. In the receptive field depicted here, light in the center produces excitatory effects (symbolized by blue at the synapse) and increased firing in the visual cell, whereas light in the surround produces inhibitory effects (symbolized by red at the synapse) and decreased firing. However, the arrangement in other receptive fields may be just the opposite. Note that no light (a) and light in both center and surround (d) produce similar baseline rates of firing. This visual cell is more sensitive to contrast than to absolute levels of light. In (b) and (c) there is a contrast between the light falling on the center versus the surround, producing increased or decreased activity in the visual cell.
 and increased firing in the visual cell, whereas light in the surround produces inhibitory effects (symbolized by red at the synapse) and decreased firing. However, the arrangement in other receptive fields may be just the opposite. Note that no light (a) and light in both center and surround (d) produce similar baseline rates of firing. This visual cell is more sensitive to contrast than to absolute levels of light. In (b) and (c) there is a contrast between the light falling on the center versus the surround, producing increased or decreased activity in the visual cell.")
32
Figure 4.19 Demonstration of a complementary afterimage. Stare at the dot in the center of the flower for at least 60 seconds, then quickly shift your gaze to the dot in the white rectangle. You should see an afterimage of the flower—but in complementary colors.

33
Figure 4.20 Three types of cones. Research has identified three types of cones that show varied sensitivity to different wavelengths of light. As the graph shows, these three types of cones correspond only roughly to the red, green, and blue receptors predicted by trichromatic theory, so it is more accurate to refer to them as cones sensitive to short, medium, and long wavelengths.

34
Figure 4.21 Explaining color perception. Contemporary theories of color vision include aspects of both the trichromatic and opponent process theories. As predicted by trichromatic theory, there are three types of receptors for color: cones sensitive to short, medium, and long wavelengths. However, these cones are organized into receptive fields that excite or inhibit the firing of higher-level visual cells in the retina, thalamus, and cortex. As predicted by opponent process theory, some of these cells respond in antagonistic ways to blue versus yellow, red versus green, and black versus white when lights of these colors stimulate their receptive fields.

35
Perceiving Forms, Patterns, and Objects
Reversible figures and perceptual sets Feature detection theory - bottom-up processing. Form perception - top-down processing Gestalt psychologists: the whole is more than the sum of its parts Reversible figures and perceptual sets demonstrate that the same visual stimulus can result in very different perceptions According to feature detection theory, people detect specific elements in stimuli and build the up into recognizable forms…bottom-up processing. Form perception also involves top-down processing…clearly emphasized by the Gestalt psychologists, who demonstrated that the whole is more than the sum of its parts.

36
Figure 4.23 Feature analysis in form perception. One vigorously debated theory of form perception is that the brain has cells that respond to specific aspects or features of stimuli, such as lines and angles. Neurons functioning as higher-level analyzers then respond to input from these “feature detectors.” The more input each analyzer receives, the more active it becomes. Finally, other neurons weigh signals from these analyzers and make a “decision” about the stimulus. In this way perception of a form is arrived at by assembling elements from the bottom up.

37
Figure 4.24 Bottom-up versus top-down processing. As explained in these diagrams, bottom-up processing progresses from individual elements to whole elements, whereas top-down processing progresses from the whole to the individual elements.

38
Principles of Perception
Gestalt principles of form perception: figure-ground, proximity, similarity , continuity, closure, and simplicity Recent research: Distal (stimuli outside the body) vs. proximal (stimulus energies impinging on sensory receptors) stimuli. Perceptual hypotheses Context The Gestalt principles of form perception include figure-ground, proximity, similarity, continuity, closure, and simplicity. The Gestalt emphasis is still felt in the study of perception, as they had useful insights that have stood the test of time, raised important issues, etc. More recently, researchers have focused on the way we distinguish between distal (stimuli outside the body) and proximal (stimulus energies impinging on sensory receptors) stimuli. People may develop perceptual hypotheses about the distal stimulus that may be responsible for the proximal stimulus…the effects of context, etc.
 vs. proximal (stimulus energies impinging on sensory receptors) stimuli. Perceptual hypotheses. Context. The Gestalt principles of form perception include figure-ground, proximity, similarity, continuity, closure, and simplicity. The Gestalt emphasis is still felt in the study of perception, as they had useful insights that have stood the test of time, raised important issues, etc. More recently, researchers have focused on the way we distinguish between distal (stimuli outside the body) and proximal (stimulus energies impinging on sensory receptors) stimuli. People may develop perceptual hypotheses about the distal stimulus that may be responsible for the proximal stimulus…the effects of context, etc.")
39
Figure 4.22 A poster for a trained seal act. Or is it? The picture is an ambiguous figure, which can be interpreted as either of two scenes, as explained in the text.

40
Figure 4.25 The principle of figure and ground. Whether you see two faces or a vase depends on which part of this drawing you see as figure and which as background. Although this reversible drawing allows you to switch back and forth between two ways of organizing your perception, you can’t perceive the drawing both ways at once.

41
Figure 4.26 Gestalt principles of perceptual organization. Gestalt principles help explain how people subjectively organize perception. (a) Proximity: These dots might well be organized in vertical columns rather than horizontal rows, but because of proximity (the dots are closer together horizontally), they tend to be perceived in rows. (b) Closure: Even though the figures are incomplete, you fill in the blanks and see a circle and a dog. (c) Similarity: Because of similarity of color, you see dots organized into the number 2 instead of a random array. If you did not group similar elements, you wouldn’t see the number 2 here. (d) Simplicity: You could view this as a complicated 11-sided figure, but given the preference for simplicity, you are more likely to see it as a rectangle and a triangle. (e) Continuity: You tend to group these dots in a way that produces a smooth path rather than an abrupt shift in direction. (f) Common Region: Although all eight dots shown here share a variety of similarities, they are grouped in pairs that share regions. (g) Connectedness: Although all eight dots shown here are similar, they are grouped in pairs that are connected.
 Proximity: These dots might well be organized in vertical columns rather than horizontal rows, but because of proximity (the dots are closer together horizontally), they tend to be perceived in rows. (b) Closure: Even though the figures are incomplete, you fill in the blanks and see a circle and a dog. (c) Similarity: Because of similarity of color, you see dots organized into the number 2 instead of a random array. If you did not group similar elements, you wouldn’t see the number 2 here. (d) Simplicity: You could view this as a complicated 11-sided figure, but given the preference for simplicity, you are more likely to see it as a rectangle and a triangle. (e) Continuity: You tend to group these dots in a way that produces a smooth path rather than an abrupt shift in direction. (f) Common Region: Although all eight dots shown here share a variety of similarities, they are grouped in pairs that share regions. (g) Connectedness: Although all eight dots shown here are similar, they are grouped in pairs that are connected.")
42
Figure 4.27 Distal and proximal stimuli. Proximal stimuli are often distorted, shifting representations of distal stimuli in the real world. If you look directly down at a small, square piece of paper on a desk (a), the distal stimulus (the paper) and the proximal stimulus (the image projected on your retina) will both be square. But as you move the paper away on the desktop, as shown in (b) and (c), the square distal stimulus projects an increasingly trapezoidal image on your retina, making the proximal stimulus more and more distorted. Nevertheless, you continue to perceive a square.
, the distal stimulus (the paper) and the proximal stimulus (the image projected on your retina) will both be square. But as you move the paper away on the desktop, as shown in (b) and (c), the square distal stimulus projects an increasingly trapezoidal image on your retina, making the proximal stimulus more and more distorted. Nevertheless, you continue to perceive a square.")
43
Figure 4.28 A famous reversible figure. What do you see?

44
Figure 4.29 Unambiguous drawings of the reversible figure. These versions of the reversible figure in Figure 4.28 have been redrawn slightly to make the young woman more apparent on the left and the old woman more apparent on the right.

45
Figure 4.31 Context effects. The context in which a stimulus is seen can affect your perceptual hypotheses.

46
Figure 4.30 The Necker cube. The tinted surface of this reversible figure can become either the front or the back of the cube.

47
Depth and Distance Perception
Binocular cues – clues from both eyes together retinal disparity convergence Monocular cues – clues from a single eye motion parallax accommodation pictorial depth cues Depth perception involves interpretation of visual cues that indicate how near or far away something is. Two types of clues are used to make judgments of distance, monocular cues (clues from a single eye) and binocular cues (clues from both eyes together). Binocular cues include retinal disparity (objects within 25 feet project images to slightly different locations on the left and right retinas; thus each eye sees a slightly different view of the object) and convergence, feeling the eyes converge toward each other as they focus on a target. Monocular cues may involves motion parallax (having images of objects at different distances moving across the retina at different rates), as well as feeling the accommodation or change in the shape of the lens as the eye focuses. Other monocular cues are pictorial depth cues…cues about distance that can be given in a flat picture.
 and binocular cues (clues from both eyes together). Binocular cues include retinal disparity (objects within 25 feet project images to slightly different locations on the left and right retinas; thus each eye sees a slightly different view of the object) and convergence, feeling the eyes converge toward each other as they focus on a target. Monocular cues may involves motion parallax (having images of objects at different distances moving across the retina at different rates), as well as feeling the accommodation or change in the shape of the lens as the eye focuses. Other monocular cues are pictorial depth cues…cues about distance that can be given in a flat picture.")
48
Figure 4.25 Convergence and Depth Perception. One binocular depth cue is convergence. The more you have to converge your eyes together to focus on an object, the closer the object must be.

50
Stability in the Perceptual World: Perceptual Constancies
Perceptual constancies – stable perceptions amid changing stimuli Size Shape Brightness Hue Location in space Perceptual constancies are tendencies to experience a stable perception in the face of continually changing stimuli. For example, when a person walks toward you they get larger perceptually…do you think they are growing. No. Constancies for size, shape, brightness, hue, and location in space have been shown.

52
Optical Illusions: The Power of Misleading Cues
Optical Illusions - discrepancy between visual appearance and physical reality. Famous optical illusions: Muller-Lyer Illusion, Ponzo Illusion, Poggendorf Illusion, Upside-down T illusion, and Zollner illusion, the Ames Room, and impossible figures Cultural differences: Perceptual hypotheses at work Optical Illusions involve an apparently inexplicable discrepancy between the appearance of a visual stimulus and its physical reality. Famous optical illusions include those listed. Cultural differences in susceptibility to illusions such as Muller-Lyer and Poggendorf demonstrate the importance of perceptual hypotheses.

53
Figure 4.37 The Müller-Lyer illusion. Go ahead, measure them: the two vertical lines are of equal length.

54
Figure 4.39 Four geometric illusions. Ponzo: The horizontal lines are the same length. Poggendorff: The two diagonal segments lie on the same straight line. Upside-down T: The vertical and horizontal lines are the same length. Zollner: The long diagonals are all parallel (try covering up some of the short diagonal lines if you don’t believe it).
.")
55
Figure 4.42 Three classic impossible figures. The figures are impossible, yet they clearly exist—on the page. What makes them impossible is that they appear to be three-dimensional representations yet are drawn in a way that frustrates mental attempts to “assemble” their features into possible objects. It’s difficult to see the drawings simply as lines lying in a plane—even though this perceptual hypothesis is the only one that resolves the contradiction.

56
Figure 4.43 Another impossible figure. This impossible figure, drawn by Shepard (1990), seems even more perplexing than the classic impossible figure that it is based on (the one seen in the middle of Figure 4.42).
, seems even more perplexing than the classic impossible figure that it is based on (the one seen in the middle of Figure 4.42).")
57
Visual Illusion Please choose the button below that corresponds to the type of operating system you are using:

58
Hearing: The Auditory System
Stimulus = sound waves (vibrations of molecules traveling in air) Amplitude (loudness) Wavelength (pitch) Purity (timbre) Wavelength described in terms of frequency: measured in cycles per second (Hz) Frequency increase = pitch increase The stimulus for the auditory system is sound waves, which are actually vibrations of molecules. Sound waves must travel throughout some physical medium, such as air. Like light waves, sound waves are characterized by their amplitude (loudness), wavelength (pitch), and purity (timbre). Also like with light, characteristics of sound interact in sound perception. Wavelength is described in terms of frequency and is measured in cycles per second, or hertz (Hz). In general, the higher the frequency (more cycles per second) the higher the pitch. Amplitude is a description of sound pressure and is measured in decibels (db). Perceived loudness is higher with increasing decibel level.
 Amplitude (loudness) Wavelength (pitch) Purity (timbre) Wavelength described in terms of frequency: measured in cycles per second (Hz) Frequency increase = pitch increase. The stimulus for the auditory system is sound waves, which are actually vibrations of molecules. Sound waves must travel throughout some physical medium, such as air. Like light waves, sound waves are characterized by their amplitude (loudness), wavelength (pitch), and purity (timbre). Also like with light, characteristics of sound interact in sound perception. Wavelength is described in terms of frequency and is measured in cycles per second, or hertz (Hz). In general, the higher the frequency (more cycles per second) the higher the pitch. Amplitude is a description of sound pressure and is measured in decibels (db). Perceived loudness is higher with increasing decibel level.")
59
Figure 4.44 Sound, the physical stimulus for hearing. (a) Like light, sound travels in waves—in this case, waves of air pressure. A smooth curve would represent a pure tone, such as that produced by a tuning fork. Most sounds, however, are complex. For example, the wave shown here is for middle C played on a piano. The sound wave for the same note played on a violin would have the same wavelength (or frequency) as this one, but the “wrinkles” in the wave would be different, corresponding to the differences in timbre between the two sounds. (b) The table shows the main relations between objective aspects of sound and subjective perceptions.
 Like light, sound travels in waves—in this case, waves of air pressure. A smooth curve would represent a pure tone, such as that produced by a tuning fork. Most sounds, however, are complex. For example, the wave shown here is for middle C played on a piano. The sound wave for the same note played on a violin would have the same wavelength (or frequency) as this one, but the wrinkles in the wave would be different, corresponding to the differences in timbre between the two sounds. (b) The table shows the main relations between objective aspects of sound and subjective perceptions.")
60
The Ear: Three Divisions
External ear (pinna): collects sound. Middle ear: the ossicles (hammer, anvil, stirrup) Inner ear: the cochlea a fluid-filled, coiled tunnel contains the hair cells, the auditory receptors lined up on the basilar membrane The Ear: Three Divisions The external ear consists of the pinna, which collects sound. The middle ear consists of a mechanical chain made up of three tiny bones in the ear, the hammer, anvil, and stirrup, known collectively as the ossicles. The inner ear consists of the cochlea, a fluid-filled, coiled tunnel that contains the hair cells, the auditory receptors. The hair cells are lined up on the basilar membrane.
: collects sound. Middle ear: the ossicles (hammer, anvil, stirrup) Inner ear: the cochlea. a fluid-filled, coiled tunnel. contains the hair cells, the auditory receptors. lined up on the basilar membrane. The Ear: Three Divisions. The external ear consists of the pinna, which collects sound. The middle ear consists of a mechanical chain made up of three tiny bones in the ear, the hammer, anvil, and stirrup, known collectively as the ossicles. The inner ear consists of the cochlea, a fluid-filled, coiled tunnel that contains the hair cells, the auditory receptors. The hair cells are lined up on the basilar membrane.")
61
Figure 4.46 The human ear. Converting sound pressure to information processed by the nervous system involves a complex relay of stimuli: Waves of air pressure create vibrations in the eardrum, which in turn cause oscillations in the tiny bones in the inner ear (the hammer, anvil, and stirrup). As they are relayed from one bone to the next, the oscillations are magnified and then transformed into pressure waves moving through a liquid medium in the cochlea. These waves cause the basilar membrane to oscillate, stimulating the hair cells that are the actual auditory receptors (see Figure 4.47).
. As they are relayed from one bone to the next, the oscillations are magnified and then transformed into pressure waves moving through a liquid medium in the cochlea. These waves cause the basilar membrane to oscillate, stimulating the hair cells that are the actual auditory receptors (see Figure 4.47).")
62
Sound waves vibrate bones of the middle ear
The Auditory Pathway Sound waves vibrate bones of the middle ear Stirrup hits against the oval window of cochlea Sets the fluid inside in motion Hair cells are stimulated with the movement of the basilar membrane Physical stimulation converted into neural impulses Sent through the thalamus to the auditory cortex (temporal lobes) The hair cells are lined up on a membrane that runs the length of the cochlea called the basilar membrane. Sound waves cause the bones of the middle ear to hit against the oval window, a covered opening of the cochlea, which sets the fluid inside in motion. The hair cells are stimulated with the movement of the basilar membrane and convert this physical stimulation into neural impulses that are then sent throughout the thalamus to the auditory cortex, located mostly in the temporal lobes.
 The hair cells are lined up on a membrane that runs the length of the cochlea called the basilar membrane. Sound waves cause the bones of the middle ear to hit against the oval window, a covered opening of the cochlea, which sets the fluid inside in motion. The hair cells are stimulated with the movement of the basilar membrane and convert this physical stimulation into neural impulses that are then sent throughout the thalamus to the auditory cortex, located mostly in the temporal lobes.")
63
Figure 4.47 The basilar membrane. The figure shows the cochlea unwound and cut open to reveal the basilar membrane, which is covered with thousands of hair cells (the auditory receptors). Pressure waves in the fluid filling the cochlea cause oscillations to travel in waves down the basilar membrane, stimulating the hair cells to fire. Although the entire membrane vibrates, as predicted by frequency theory, the point along the membrane where the wave peaks depends on the frequency of the sound stimulus, as suggested by place theory.
. Pressure waves in the fluid filling the cochlea cause oscillations to travel in waves down the basilar membrane, stimulating the hair cells to fire. Although the entire membrane vibrates, as predicted by frequency theory, the point along the membrane where the wave peaks depends on the frequency of the sound stimulus, as suggested by place theory.")
65
Theories of Hearing: Place or Frequency?
Hermann von Helmholtz (1863) Place theory Other researchers (Rutherford, 1886) Frequency theory Georg von Bekesy (1947) Traveling wave theory Hermann von Helmholtz (1863) proposed that perception of pitch corresponds to the vibration of different portions, or places, along the basilar membrane. Thus different places have different pitches, like keys on a piano. Other researchers (Rutherford, 1886) proposed an alternate model called frequency theory, which holds that perception of pitch corresponds to the rate, or frequency, at which the entire basilar membrane vibrates, causing the auditory nerve to fire at different rates for different frequencies. Thus, according to this theory, the brain detects the frequency of a tone by the rate at which the auditory nerve fires. Like with research in theories of color vision, researchers argued about these two competing theories for almost a century. It turns out that both are valid in part. The two were reconciled by Georg von Bekesy, 1947, with his traveling wave theory. Basically, von Bekesy said that the whole basilar membrane does move, but the waves peak at particular places, depending on frequency.
 Place theory. Other researchers (Rutherford, 1886) Frequency theory. Georg von Bekesy (1947) Traveling wave theory. Hermann von Helmholtz (1863) proposed that perception of pitch corresponds to the vibration of different portions, or places, along the basilar membrane. Thus different places have different pitches, like keys on a piano. Other researchers (Rutherford, 1886) proposed an alternate model called frequency theory, which holds that perception of pitch corresponds to the rate, or frequency, at which the entire basilar membrane vibrates, causing the auditory nerve to fire at different rates for different frequencies. Thus, according to this theory, the brain detects the frequency of a tone by the rate at which the auditory nerve fires. Like with research in theories of color vision, researchers argued about these two competing theories for almost a century. It turns out that both are valid in part. The two were reconciled by Georg von Bekesy, 1947, with his traveling wave theory. Basically, von Bekesy said that the whole basilar membrane does move, but the waves peak at particular places, depending on frequency.")
66
Auditory Localization: Where Did that Sound Come From?
Two cues critical: Intensity (loudness) Timing of sounds arriving at each ear Head as “shadow” or partial sound barrier Timing differences as small as 1/100,000 of a second Auditory localization involves locating the source of a sound in space. Two cues appear critical, intensity (loudness) and timing of sounds arriving at each ear. A sound in your left ear produces a greater intensity in your left, as opposed to your right, ear. Also, your head produces a “shadow” or partial sound barrier. People are evidently pretty good at using these cues, as humans have been shown to detect timing differences as small as 1/100,000 of a second.
 Timing of sounds arriving at each ear. Head as shadow or partial sound barrier. Timing differences as small as 1/100,000 of a second. Auditory localization involves locating the source of a sound in space. Two cues appear critical, intensity (loudness) and timing of sounds arriving at each ear. A sound in your left ear produces a greater intensity in your left, as opposed to your right, ear. Also, your head produces a shadow or partial sound barrier. People are evidently pretty good at using these cues, as humans have been shown to detect timing differences as small as 1/100,000 of a second.")
67
Figure 4.48 Cues in auditory localization. A sound coming from the left reaches the left ear sooner than the right. When the sound reaches the right ear, it is also less intense because it has traveled a greater distance and because it is in the sound shadow produced by the listener’s head. These cues are used to localize the sources of sound in space.

68
The Chemical Senses: Taste
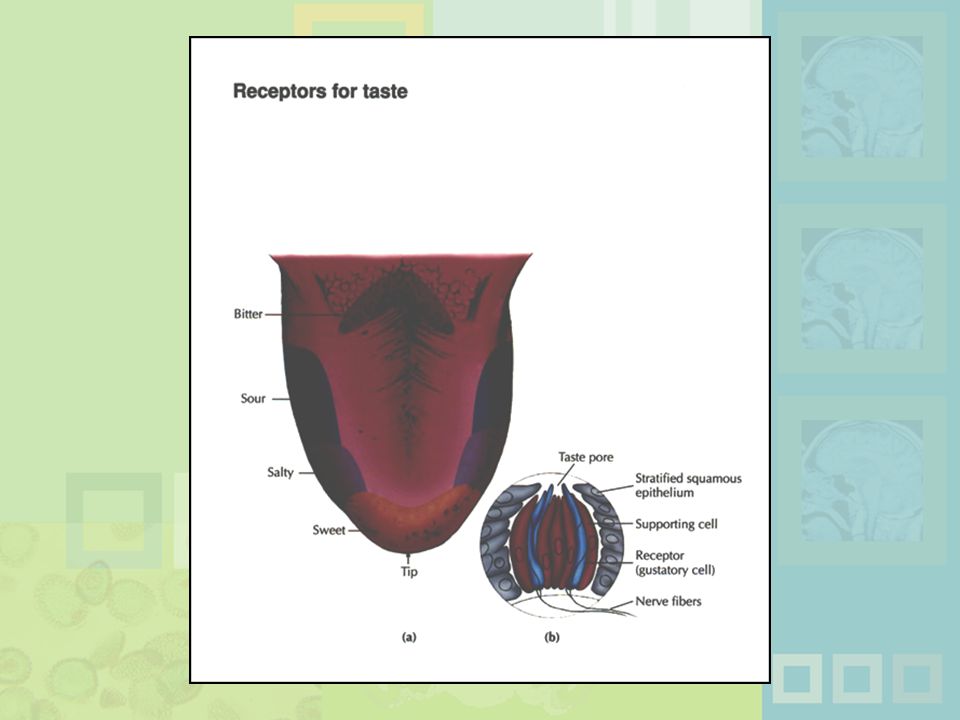
Taste (gustation) Physical stimulus: soluble chemical substances Receptor cells found in taste buds Pathway: taste buds -> neural impulse -> thalamus -> cortex Four primary tastes: sweet, sour, bitter, and salty Taste: learned and social processes Taste (gustation) has as its physical stimulus chemical substances that are dissolvable in water. Receptors for taste are clusters of cells found in the taste buds, which line the trenches around tiny bumps on the tongue. These cells absorb chemicals, trigger neural impulses, and send the information throughout the thalamus and on to the cortex. The four primary tastes are sweet, sour, bitter, and salty, with uneven distribution on the tongue. Clearly, taste results from a complex blend of these 4 as well as learned and social processes.
 Physical stimulus: soluble chemical substances. Receptor cells found in taste buds. Pathway: taste buds -> neural impulse -> thalamus -> cortex. Four primary tastes: sweet, sour, bitter, and salty. Taste: learned and social processes. Taste (gustation) has as its physical stimulus chemical substances that are dissolvable in water. Receptors for taste are clusters of cells found in the taste buds, which line the trenches around tiny bumps on the tongue. These cells absorb chemicals, trigger neural impulses, and send the information throughout the thalamus and on to the cortex. The four primary tastes are sweet, sour, bitter, and salty, with uneven distribution on the tongue. Clearly, taste results from a complex blend of these 4 as well as learned and social processes.")
70
The Chemical Senses: Smell
Smell (Olfaction) Physical stimuli: substances carried in the air dissolved in fluid, the mucus in the nose Olfactory receptors = olfactory cilia Pathway: Olfactory cilia -> neural impulse -> olfactory nerve -> olfactory bulb (brain) Does not go through thalamus The Chemical Senses: Smell Smell (Olfaction) operates much like the sense of taste. The physical stimuli are chemical substances carried in the air that are dissolved in fluid, the mucus in the nose. Olfactory receptors are called olfactory cilia and are located in the upper portion of the nasal passages. The olfactory receptors synapse directly with cells in the olfactory bulb at the base of the brain. Olfaction is the only sense, therefore, that is not routed through the thalamus. Odors are not easily classified, and primary odors have not really been delineated. Humans can distinguish among about 10,000 odors, but for some reason have a hard time attaching names to odors quite frequently.
 Physical stimuli: substances carried in the air. dissolved in fluid, the mucus in the nose. Olfactory receptors = olfactory cilia. Pathway: Olfactory cilia -> neural impulse -> olfactory nerve -> olfactory bulb (brain) Does not go through thalamus. The Chemical Senses: Smell. Smell (Olfaction) operates much like the sense of taste. The physical stimuli are chemical substances carried in the air that are dissolved in fluid, the mucus in the nose. Olfactory receptors are called olfactory cilia and are located in the upper portion of the nasal passages. The olfactory receptors synapse directly with cells in the olfactory bulb at the base of the brain. Olfaction is the only sense, therefore, that is not routed through the thalamus. Odors are not easily classified, and primary odors have not really been delineated. Humans can distinguish among about 10,000 odors, but for some reason have a hard time attaching names to odors quite frequently.")
71
Figure 4.51 The olfactory system. Odor molecules travel through the nasal passages and stimulate olfactory cilia. An enlargement of these hairlike olfactory receptors is shown in the inset. The olfactory nerves transmit neural impulses through the olfactory bulb to the brain.

73
Temperature: free nerve endings in the skin
Skin Senses: Touch Physical stimuli = touch are mechanical, thermal, and chemical energy impinging on the skin. Sensory receptors -> the spinal column -> brainstem -> cross to opposite side of brain -> thalamus -> somatosensory (parietal lobe) Temperature: free nerve endings in the skin Pain receptors: also free nerve endings Two pain pathways: fast vs. slow The physical stimuli for touch are mechanical, thermal, and chemical energy that impinges on the skin. The skin has at least 6 types of sensory receptors, which are routed throughout the spinal column to the brainstem. There, they cross over mostly to the opposite side of the brain, project through the thalamus and onto the somatosensory cortex in the parietal lobe. Temperature is registered by free nerve endings in the skin that are specific for cold and warmth. Pain receptors are also mostly free nerve endings which transmit information to the brain via two types of pathways...the fast pathway that registers localized pain and relays it to the brain in a fraction of a second, and the slow pathway that lags a second or two behind and carries less localized, longer-lasting aching or burning pain.
 Temperature: free nerve endings in the skin. Pain receptors: also free nerve endings. Two pain pathways: fast vs. slow. The physical stimuli for touch are mechanical, thermal, and chemical energy that impinges on the skin. The skin has at least 6 types of sensory receptors, which are routed throughout the spinal column to the brainstem. There, they cross over mostly to the opposite side of the brain, project through the thalamus and onto the somatosensory cortex in the parietal lobe. Temperature is registered by free nerve endings in the skin that are specific for cold and warmth. Pain receptors are also mostly free nerve endings which transmit information to the brain via two types of pathways...the fast pathway that registers localized pain and relays it to the brain in a fraction of a second, and the slow pathway that lags a second or two behind and carries less localized, longer-lasting aching or burning pain.")
74
Figure 4.52 Receptive field for touch. A receptive field for touch is an area on the skin surface that, when stimulated, affects the firing of a cell that responds to pressure on the skin. Shown here is a center surround receptive field for a cell in the thalamus of a monkey.

75
Figure 4.53 The two pathways for pain signals. Pain signals are sent from receptors to the brain along the two pathways depicted here. The fast pathway, shown in red, and the slow pathway, shown in black, depend on different types of nerve fibers and are routed through different parts of the thalamus. The gate control mechanism posited by Melzack and Wall (1965) apparently depends on descending signals originating in an area of the midbrain (the pathway shown in green).
 apparently depends on descending signals originating in an area of the midbrain (the pathway shown in green).")
76
Other Senses: Kinesthetic and Vestibular
Kinesthesis - knowing the position of the various parts of the body Receptors in joints/muscles Vestibular - equilibrium/balance Kinesthesis involves knowing the position of the various parts of the body. Kinesthetic receptors lie in the joints, indicating how much they are bending, or in the muscles, registering tautness or extension. The Vestibular system responds to gravity and keeps you informed of your body’s location in space. It provides your sense of balance or equilibrium. The semicircular canals make up the largest part of the vestibular system, these are fluid filled canals that contain hair cells similar to those in the basilar membrane. When your head moves, the fluid moves, moving the hair cells and initiating neural signals that travel to the brain.

77
Figure 4.54 The vestibular system. The semicircular canals in the inner ear (which are shown disproportionately large here) are the sensory organ for balance and head movement. Fluid movements in these canals stimulate neural impulses that travel along the vestibular nerve to the brain.
 are the sensory organ for balance and head movement. Fluid movements in these canals stimulate neural impulses that travel along the vestibular nerve to the brain.")
Similar presentations


>")

 Amplitude Purity Cornea Lens Iris Pupil Retina Transduction Optic disk Optic nerve.>")


 and the nervous system receive stimuli.>")