Download presentation
Presentation is loading. Please wait.

1
Basics of MATLAB By DR. Wafaa Shabana

2
Table of Contents: 1. What is MATLAB? 2. Why MATLAB?
3. Is MATLAB a compiled language? 4. MATLAB toolboxes. 5. How to start and quit MATLAB? 6. MATLAB command window. 7. Getting starting with MATLAB. 8. Graphs 9. Questions 10. References

3
1.What is MATLAB? MATLAB is a high-performance language for technical computing. It integrates computation, visualization, and programming in an easy-to-use environment where problems and solutions are expressed in familiar mathematical notation. MATLAB is one of the fastest and most enjoyable ways to solve problems numerically.

4
1. What is MATLAB?(continued)
MatLab : Matrix Laboratory Numerical Computations with matrices Every number can be represented as matrix Matlab is an interactive program for numerical computation and data visualization; MATLAB is a product of The MathWorks, Inc. - The MathWorks is the leading developer of mathematical computing software for engineers and scientists since 1984.

5
2. Why MATLAB? Main Features Simple programming rules
Extended accuracy Comprehensive mathematical library Extensive graphics tools for 2D and 3D graphics Linkages with other languages Transportability across environment MATLAB scripts will work on PC, UNIX, Mac

6
2. Why MATLAB? (continued)
Mathematical functions for linear algebra, statistics, Fourier analysis, filtering, optimization, and numerical integration 2-D and 3-D graphics functions for visualizing data Tools for building custom graphical user interfaces Functions for integrating MATLAB based algorithms with external applications and languages, such as C, C++, Fortran, Java™, COM, and Microsoft® Exce

7
2. Why MATLAB? (continued)
MATLAB is useful for visualization and data analysis MATLAB is versatile, designed to work the same across platforms and to interface with multiple programming languages MATLAB is expandable with toolboxes User Friendly (GUI) Easy to work with Powerful tools for complex mathematics Note that: With the MATLAB language, you can program and develop algorithms faster than with traditional languages because you do not need to perform low-level administrative tasks, such as declaring variables, specifying data types, and allocating memory.
 Easy to work with. Powerful tools for complex mathematics. Note that: With the MATLAB language, you can program and develop. algorithms faster than with traditional languages because you do not need to perform low-level administrative tasks, such as declaring variables, specifying data types, and allocating memory.")
8
3. Is MATLAB a compiled language?
MATLAB is an interpreted language It is not a compiled language Question: 1- What is the difference between a compiled and interpreted language? Give an example for each.

9
4. MATLAB toolboxes: Signal Processing toolbox
Image processing toolbox Database toolbox Wavelets toolbox Partial Differential equation toolbox Fuzzy logic Neural Network toolbox Financial toolbox Communications toolbox Bioinformatics toolbox Statistics toolbox Optimization toolbox

10
5. How to start MATLAB? On Microsoft Windows® platforms, start the MATLAB program by double-clicking the MATLAB shortcut on your Windows desktop. On Apple® Macintosh® platforms, start MATLAB by double-clicking the MATLAB icon in the Applications folder. On UNIX® platforms, start MATLAB by typing matlab at the operating system prompt.

11
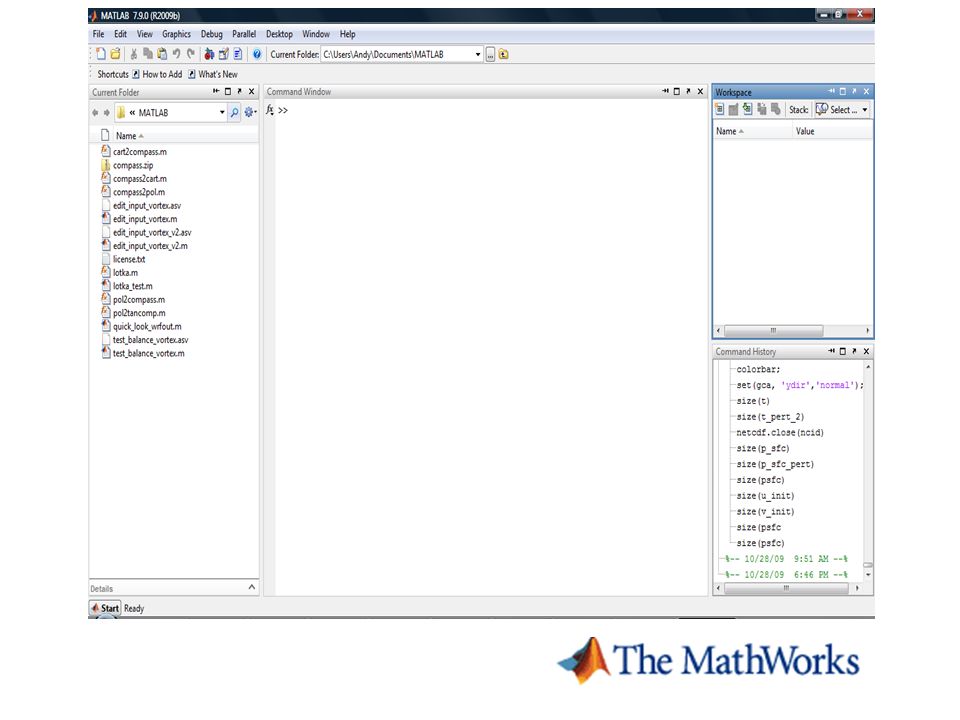
6. MATLAB command window:
Main window in MATLAB Commands entered here MATLAB displays >> prompt when ready for a command Will have no >> prompt when processing commands

13
Workspace Window Workspace Window
Shows all currently defined variables Array dimensions Min, max values Good debugging tool

14
Command History Command History Shows all past commands
Can copy and past commands into command window Double click will execute command

15
7. Getting Started with MATLAB:
MATLAB is case sensitive Variable ‘ans’ will take value of result of command if no equal sign specified Holds most recent result only Semicolon at end of line will suppress output, it is not required like in C or C++ Useful in script files and debugging

16
7.1 Mathematical operators:
Scalar arithmetic operations Operation MATLAB form Exponentiation: ^ ab a^b Multiplication: * ab a*b Right Division: / a / b = a/b a/b Left Division: \ a \ b = b/a a\b Addition: a + b a+b Subtraction: a – b a-b e.g 2^6*3+4-6 =(( ((2^6)*3)+4)-6)
*3)+4)-6)")
17
7.2 Logical operators:

18
7.3 MATLAB help: Ways to get help in MATLAB help function name
Provides basic text output Type helpwin on command line Look under the help menu on the desktop

19
7.3 MATLAB help: lookfor keyword command will also find functions that
have the keyword in them doc function_name brings up the full documentation for the function

20
7.4 Matrices in MATLAB: You can enter matrices into MATLAB in several different ways: Enter an explicit list of elements. Load matrices from external data files. Generate matrices using built-in functions. Create matrices with your own functions in M-files.

21
As a list of its elements:
Separate the elements of a row with blanks or commas. Use a semicolon, ; , to indicate the end of each row. Surround the entire list of elements with square brackets, [ ]. simply type in the Command Window A = [ ; ; ; ]

22
The element in row i and column j of A is denoted by A(i,j).
Some basic functions for matrices: sum(A) A‘: transpose (A) diag(A), inv(A), ones(N), zeros(N), A*B, A.*B
 A‘: transpose (A) diag(A), inv(A), ones(N), zeros(N), A*B, A.*B.")
23
The Colon Operator: The colon, :, is one of the most important MATLAB operators. It occurs in several different forms. For example: 1:10 To obtain non-unit spacing, specify an increment. 100:-7:50 and 0:pi/4:pi

24
Subscript expressions involving colons refer to portions of a matrix:
A(1:k,j) is the first k elements of the jth column of A. A(: , i) All elements in the ith column
 is the first k elements of the jth column of A. A(: , i) All elements in the ith column.")
25
8. Graphs t = 0:pi/20:2*pi; y = exp(sin(t)); plotyy(t,y,t,y,'plot','stem') xlabel('X Axis') ylabel('Plot Y Axis') title('Two Y Axes') % comment % plotyy :2-D line plots with y-axes on both left and right side
); plotyy(t,y,t,y, plot , stem ) xlabel( X Axis ) ylabel( Plot Y Axis ) title( Two Y Axes ) % comment % plotyy :2-D line plots with y-axes on both left and right side")
26
Subplots You can place more than one plot on a figure using the subplot function. The function takes three arguments. subplot(n_rows, n_cols, which_plot) n_rows and n_cols serve to divide the figure into fields. The fields are numbered from left to right and then up to down. which_plot tells which field to place a plot.
 n_rows and n_cols serve to divide the figure into fields. The fields are numbered from left to right and then up to down. which_plot tells which field to place a plot.")
27
>> x=0:0.002:100; y1=log(x+1); y2=cos(x); y3=sin(x); y4 = 10*x+5; >> subplot(2,2,1) >> plot(x,y1), title('y=log(x+1)') >> subplot(2,2,2) >> plot(x,y2), title('y=cos(x)') >> subplot(2,2,3) >> plot(x,y3), title('y=sin(x)') >> subplot(2,2,4) >> plot(x,y4), title('y=10x+5') figure plot(x(1:20000),y2(1:20000))
 >> plot(x,y2), title( y=cos(x) ) >> subplot(2,2,3) >> plot(x,y3), title( y=sin(x) ) >> subplot(2,2,4) >> plot(x,y4), title( y=10x+5 ) figure. plot(x(1:20000),y2(1:20000))")
28
9. Questions? What is an OSS? Is MATLAB an OSS?
Give an example of an OSS? Further Questions:

29
10. References: You can read the following references:
1- “The Basics of MATLAB” Jeffrey O. Bauer 2- 3. “MATLAB tutorial for beginners” Jyotirmay Gadewadikar Need further help? Contact me

30
Thanks for your attendance and hope you have not wasted your time.

Similar presentations


 whenever>")


