Download presentation
Presentation is loading. Please wait.

1
Introduction to Matlab Jianguo Wang CSSCR September 2009

2
MATLAB stands for Matrix Laboratory. A complete programming environment as R, many functions and toolboxes with various applications Designed for technical computing problems, strong in matrix and vector formulas

3
Fast in numerical computation, basically not a symbolic solver like Maple or Mathematica Friendly programming environment, errors are easier to find and fix object-oriented elements

4
Why Matlab? Can we just use Excel, Eviews or SPSS? “The economics profession …... clad in impressive-looking mathematics…… gussied up with fancy equations.” Paul Krugmann 2009

5
Matlab Windows

6
Matrices and Arrays Best way to get started with MATLAB is to learn how to handle matrices in it. A = [16 3 2 13; 5 10 11 8; 9 6 7 12; 4 15 14 1] The basic way data and information handled in Matlab

7
MATLAB displays the matrix you just entered: A = 16 3 2 13 5 10 11 8 9 6 7 12 4 15 14 1 Once you have entered the matrix, it is automatically remembered in the MATLAB workspace. You can simply refer to it as A. Keep in mind, variable names are case-sensitive

8
When you do not specify an output variable, MATLAB uses the variable ans, short for answer, to store the results of a calculation. Subscripts The element in row i and column j of A is given by A(i,j). So to compute the sum of the elements in the fourth column of A, we have: A(1,4) + A(2,4) + A(3,4) + A(4,4) Which produces: ans = 34
. So to compute the sum of the elements in the fourth column of A, we have: A(1,4) + A(2,4) + A(3,4) + A(4,4) Which produces: ans = 34.")
9
The Colon Operator For example: 1:10 is a row vector containing the integers from 1 to 10: 1 2 3 4 5 6 7 8 9 10 To obtain non-unit spacing, specify an increment. For example: 100:-7:50 will give you 100 93 86 79 72 65 58 51 Subscript expressions involving colons refer to portions of a matrix. For example: A(1:k,j) refers to the first k elements of the jth column of A.
 refers to the first k elements of the jth column of A..")
10
M-Files You can create your own programs using M-files, which are plain text files containing MATLAB code. Use the MATLAB Editor or another text editor to create a file containing the same statements you would type at the MATLAB command line. Save the file under a name that ends in.m

11
Using M files

12
Multivariate Data MATLAB uses column-oriented analysis for multivariate statistical data. Each column in a data set represents a variable and each row an observation. The (i,j)th element is the ith observation of the jth variable. As an example, consider a data set with three variables: Heart rate Weight Hours exercise per week For five observations, the resulting matrix might look like D = [ 72 134 3.2 81 201 3.5 69 156 7.1 82 148 2.4 75 170 1.2 ]
th element is the ith observation of the jth variable. As an example, consider a data set with three variables: Heart rate Weight Hours exercise per week For five observations, the resulting matrix might look like D = [ ].")
13
Now you can apply MATLAB analysis functions to this data set. For example, to obtain the mean and standard deviation of each column, use mu = mean(D), sigma = std(D) mu = 75.8 161.8 3.48 sigma = 5.6303 25.499 2.2107 Entering Long Statements s = 1 -1/2 + 1/3 -1/4 + 1/5 - 1/6 + 1/7... - 1/8 + 1/9 - 1/10 + 1/11 - 1/12;
, sigma = std(D) mu = sigma = Entering Long Statements s = 1 -1/2 + 1/3 -1/4 + 1/5 - 1/6 + 1/ /8 + 1/9 - 1/10 + 1/11 - 1/12;.")
14
Graphics Interactive tools enable you to manipulate graphs to achieve results that reveal the most information about your data. You can also edit and print graphs for presentations, or export graphs to standard graphics formats for presentation in Web browsers or other media.

15
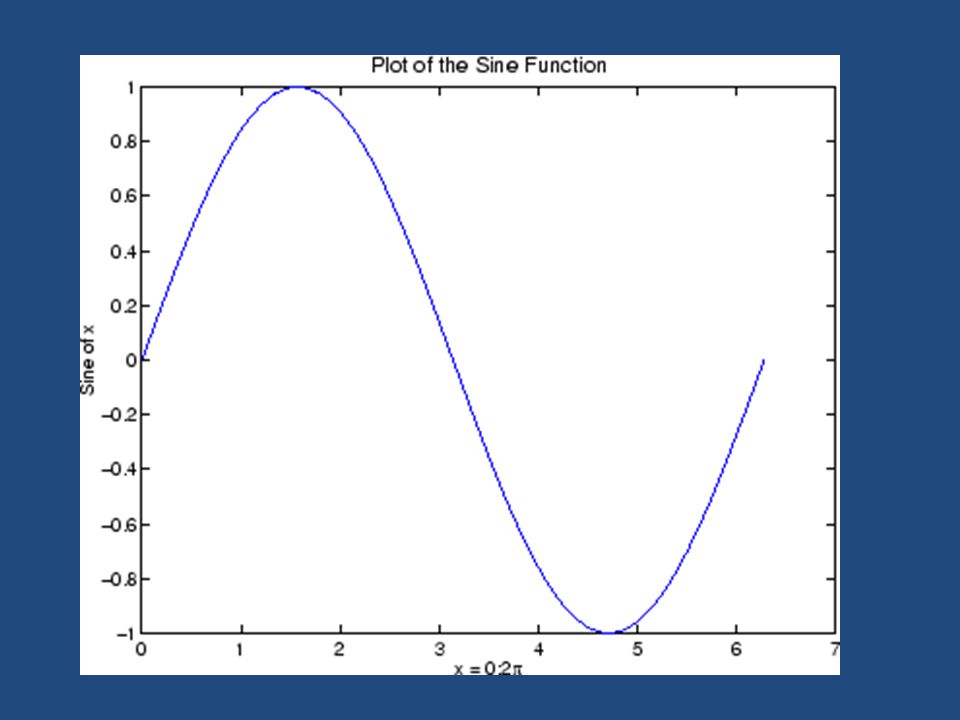
Basic Plotting Functions plot(x,y) produces a graph of y versus x You can also label the axes and add a title, using the ‘xlabel’, ‘ylabel’, and ‘title’ functions. Example: xlabel('x = 0:2\pi') ylabel('Sine of x') title('Plot of the Sine Function','FontSize',12)
 ylabel( Sine of x ) title( Plot of the Sine Function , FontSize ,12).")
17
Plotting Multiple Data Sets in One Graph x = 0:pi/100:2*pi; y = sin(x); y2 = sin(x-.25); y3 = sin(x-.5); plot(x,y,x,y2,x,y3)
; y2 = sin(x-.25); y3 = sin(x-.5); plot(x,y,x,y2,x,y3)")
18
Specifying Line Styles and Colors It is possible to specify color, line styles, and markers (such as plus signs or circles) when you plot your data using the plot command: plot(x,y,'color_style_marker') e.g. plot(x,y,'r:+') plots a red-dotted line and places plus sign markers at each data point.
 plots a red-dotted line and places plus sign markers at each data point..")
19
Displaying Multiple Plots in One Figure subplot(m,n,p) This splits the figure window into an m-by-n matrix of small subplots and selects the pth subplot for the current plot. Example: t = 0:pi/10:2*pi; [X,Y,Z] = cylinder(4*cos(t)); subplot(2,2,1); mesh(X) subplot(2,2,2); mesh(Y) subplot(2,2,3); mesh(Z) subplot(2,2,4); mesh(X,Y,Z)
); subplot(2,2,1); mesh(X) subplot(2,2,2); mesh(Y) subplot(2,2,3); mesh(Z) subplot(2,2,4); mesh(X,Y,Z).")
20
Multimedia Read movie, in many different format e.g. function mmreader(‘filename’) Create and play movie
 Create and play movie.")
21
Further resources For lots more such like toolboxes Mathworks htttp://www.mathworks.com/index.html?ref= logo&s_cid=docframe_homepage htttp://www.mathworks.com/index.html?ref= logo&s_cid=docframe_homepage

22
Matlab in Economics http://www.feweb.vu.nl/econometriclinks/sof tware.html#softwareM http://www.feweb.vu.nl/econometriclinks/sof tware.html#softwareM http://dge.repec.org/software.html

Similar presentations


 – Minimisations,>")


