Download presentation
Presentation is loading. Please wait.

1
OPHI Oxford Poverty & Human Development Initiative Department of International Development Queen Elizabeth House, University of Oxford www.ophi.org.uk Multidimensional Measurement of Poverty in Sub-Saharan Africa 16 June 2008

2
Dataset Demography and Health Surveys (DHS) data on 14 African countries : Benin(2002), Burkina (2003), Cameroun (2004), Ghana (2003), Guinea (2005), Kenya (2003), Madagascar (2003), Malawi (2004), Mali (2006), Niger (2006), Nigeria (2003), Senegal (2005), Tanzania (2004), Uganda (2006). The unit of analysis is the woman. DHS contain a lot of information on the standard and quality of living, but no real information on income or expenditures.

3
Dimensions, Indicators & Cutoffs (4 dimensions, 11 Indicators) DimensionPoverty Threshold 1. ASSET i) Electricity Yes/no ii) Having radio and/or TVIf does not have at least a radio iii) Refrigerator Yes/no iv) Vehicle If does not have at least a motorcycle v) Floor Natural or rudimentary vi) Phone Yes/no vii) Drinking water MDG definitions viii) Sanitation MDG definitions 2. SCHOOLINGIf highest education level in family < 3th grade 3. BODY MASS INDEXIf BMI < 18.5 (WHO standard) 4. EMPOWERMENTIf does not have one’s say on visits to family and relatives
 Electricity Yes/no ii) Having radio and/or TVIf does not have at least a radio iii) Refrigerator Yes/no iv) Vehicle If does not have at least a motorcycle v) Floor Natural or rudimentary vi) Phone Yes/no vii) Drinking water MDG definitions viii) Sanitation MDG definitions 2. SCHOOLINGIf highest education level in family < 3th grade 3. BODY MASS INDEXIf BMI < 18.5 (WHO standard) 4. EMPOWERMENTIf does not have one’s say on visits to family and relatives.")
4
Table 1: Incidence of Deprivation in five African Countries Deprivati on BeninBurkinaCameroonGhanaGuinea Weigh t # of people % of pop # of people % of pop # of people % of pop # of people % of pop # of people % of pop Asset1 Electricity0.125 1134270.11035687.3238450.3262050.1296979.0 Media0.125 342621.2348129.3136328.8125123.9113130.1 Refrigerat or 0.125 1504493.01107893.4396483.7402676.9340290.5 Vehicle0.125 890855.1819369.1391882.7474290.6315383.9 Floor0.125 642139.7689858.1221546.862011.8199653.1 Phone0.125 1559796.41125094.8462297.6471190.0344691.7 Water0.125 910356.3933778.7266556.2308158.9294478.4 Sanitation0.125 998061.7796867.22876.1123023.5105928.2 BMI1 14138.7233819.73166.74749.145812.2 Empower.1 658440.7820869.2263055.5253448.4197252.5 Schooling1 1118169.1980382.6132628.0167532.0302080.4

5
Figure 1: Dimensions deprivations in five countries

6
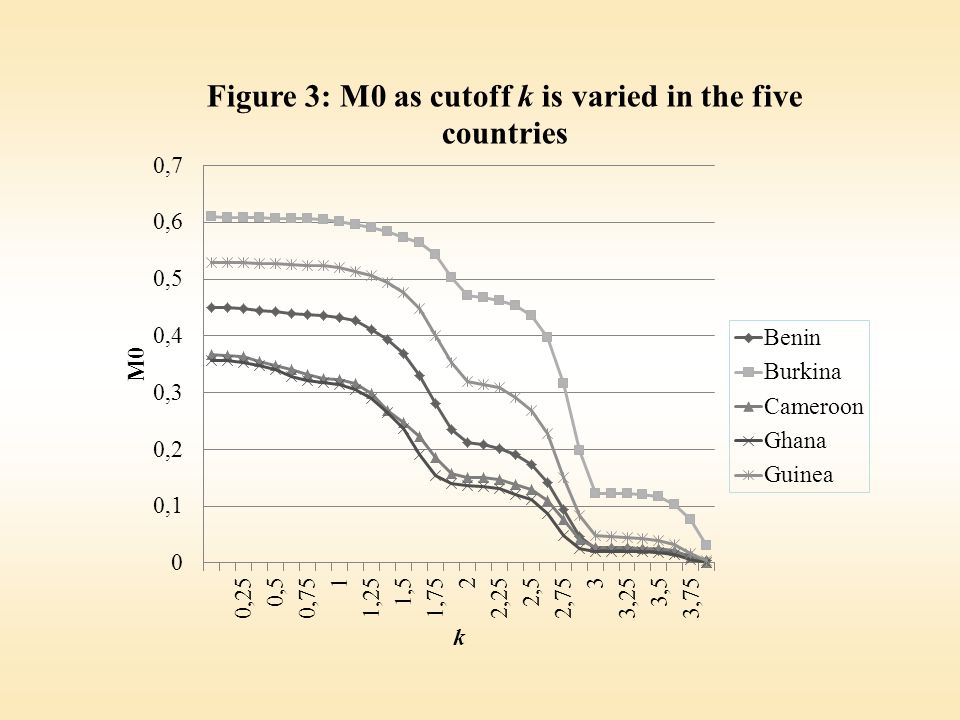
Cutoff k Number of people Headcount ratio H Adjust ratio M 0 Adjust ratio M 1 Average number of Deprivations of the poor 0.5148030.9150.4450.3991.946 1138180.8540.4360.3892.039 1.5116430.7200.3930.3512.184 256330.3480.2340.2022.691 2.542970.2660.1900.1632.864 38950.0550.0470.0393.381 3.54130.0260.0240.0193.803 4690.004 0.0034 Table 2: Multidimensional poverty measures as cutoff k is varied, in Benin

9
Country H MD M0M0 National poverty ratio HDI (2005,UNDP) ValueRankValueRankValueRankValueRank Ghana0.20310.14010.39520.5531 Cameroon0.22520.15820.40240.5322 Benin0.34830.23430.29010.4374 Guinea0.51840.35240.40030.4563 Burkina0.69350.50350.46450.3705 Table 3: Countries ranking according several well-being measures, with k = 2
 ValueRankValueRankValueRankValueRank Ghana Cameroon Benin Guinea Burkina Table 3: Countries ranking according several well-being measures, with k = 2")
Similar presentations


 Increase South-South Trade by Decreasing Tariffs? B) Make Trade Better for Western States.>")


>")


 METHODS APPLIED TO THE SAINT LUCIA LABOUR FORCE SURVEY SOME IDEAS FOR THE DEVELOPMENT OF AN OECS MULTI-DIMENSIONAL POVERTY.>")