Download presentation
Presentation is loading. Please wait.

2
Presented by Thomas C. Tucker, PhD, MPH Associate Director Markey Cancer Center Cancer Prevention and Control program University of Kentucky Associate Professor Department of Epidemiology College of Public Health Director Kentucky Cancer Registry Using GIS to Reduce Colorectal Cancer Incidence and Mortality GIS Day at UK– Nov. 17, 2011

3
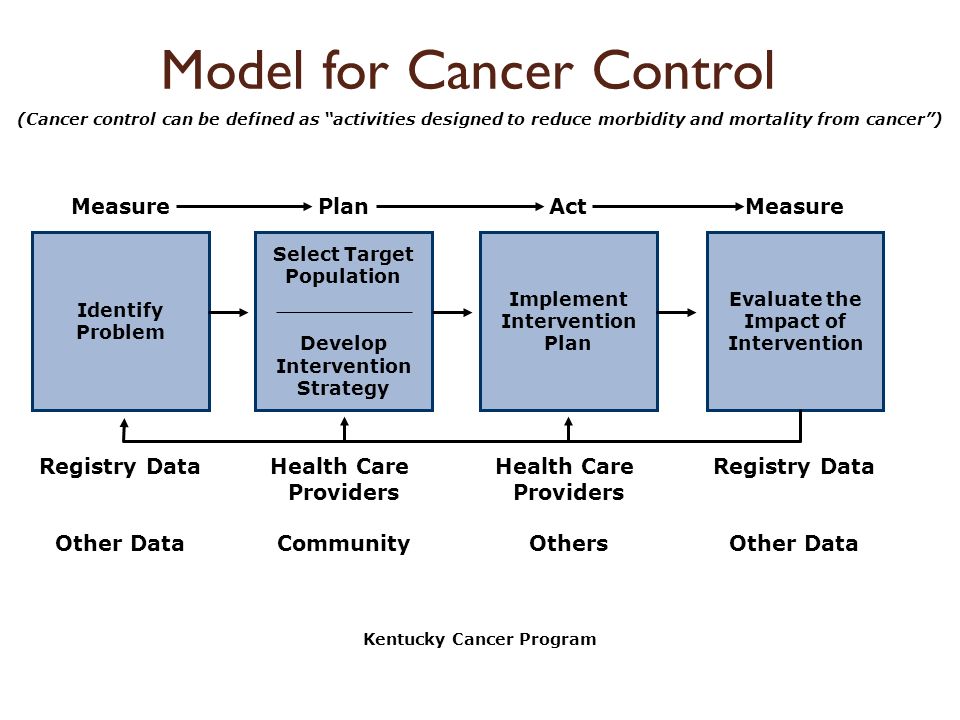
Cancer Control in Kentucky The Kentucky Cancer Registry develops a profile of the cancer burden for the major cancers in each of the states 15 Area Development Districts (ADD’s) and presents these data annually to the District Cancer Councils that have been established in each ADD
 and presents these data annually to the District Cancer Councils that have been established in each ADD")
4
Most Common Cancer Control Sites 62 % of Total Cancer Cases in Kentucky All genders, all races, 2001-2005

6
Model for Cancer Control (Cancer control can be defined as “activities designed to reduce morbidity and mortality from cancer”) Kentucky Cancer Program Select Target Population Develop Intervention Strategy Evaluate the Impact of Intervention Implement Intervention Plan Identify Problem MeasurePlanActMeasure Registry Data Other Data Health Care Providers Community Health Care Providers Others Registry Data Other Data
 Kentucky Cancer Program Select Target Population Develop Intervention Strategy Evaluate the Impact of Intervention Implement Intervention Plan Identify Problem MeasurePlanActMeasure Registry Data Other Data Health Care Providers Community Health Care Providers Others Registry Data Other Data")
7
Common sources of data useful for cancer control Demographic data (Census) Risk factor data (BRFSS) Incidence data (State Cancer Registry) Mortality data ( State Vital Records)
 Risk factor data (BRFSS) Incidence data (State Cancer Registry) Mortality data ( State Vital Records)")
8
Demographic Characteristics Contribute to… Risk Factors Contribute to… Incidence or Late Stage DX Contribute to… Cancer Mortality Reason for Combining Sources of Data Logic Model

9
2001-2005 Lung Cancer by Area Development District in KY Area Development District Under Poverty Level (%) High School + Education (%) Current Smoker (%) Age-Adjusted Incidence Late Stage Incidence (%) Age-Adjusted Mortality NAdj. RateN US12.480.423.11079225982.578881254.1 KENTUCKY15.874.130.121568101.380.61670178.89 BARREN RIVER16.770.331.9135899.2478.2110681.13 BIG SANDY27.959.635.11031123.5781.179496.3 BLUEGRASS13.179.027.5319295.8880.9247975.2 BUFFALO TRACE19.666.633.5314100.683.223976.85 CUMBERLAND VALLEY29.158.034.81444114.579.4113590.48 FIVCO18.871.232.7846104.8381.667484.21 GATEWAY21.265.032.438295.8183.629574.45 GREEN RIVER13.777.130.5114699.180.192479.93 KENTUCKY RIVER31.056.035.3843131.785.4698110.95 KIPDA11.581.327.94575100.1780.2344575.8 LAKE CUMBERLAND23.061.3311221103.4877.494680.06 LINCOLN TRAIL12.976.130.8110190.9979.479867.18 NORTHERN KENTUCKY9.080.628.51883102.1781.6144479.04 PENNYRILE15.971.731.6113297.3982.189276.45 PURCHASE15.077.128.9110091.1282.583268.3

10
Lung Cancer, 2001-2005

13
2001-2005 Lung Cancer by Area Development District Rank Sum Area Development District High School Ed. +Current Smoker Age-Adjusted Incidence Age Adjusted Mortality Overall Rank %Rank% RateRankRateRank KENTUCKY RIVER56.0135.31131.71110.9514 BIG SANDY59.6335.12123.57296.329 CUMBERLAND VALLEY58.0234.83114.5390.48311 FIVCO71.2832.75104.83484.21421 LAKE CUMBERLAND61.34319103.48580.06523 BUFFALO TRACE66.6633.54100.6776.85724 BARREN RIVER70.3731.9799.24981.13932 GATEWAY65.0532.4695.811374.451337 NORTHERN KENTUCKY80.61428.513102.17679.04639 PENNYRILE71.7931.6897.391176.451139 GREEN RIVER77.11130.51199.11079.931042 KIPDA81.31527.914100.17875.8845 LINCOLN TRAIL76.11030.81090.991567.181550 BLUEGRASS79.01327.51595.881275.21252 PURCHASE77.11228.91291.121468.31452

14
An Example In 2001, Kentucky had the highest colorectal cancer incidence rate in the U.S. compared to all of the other states

15
In 2001, it was also noted that Kentucky was ranked 49 th in colorectal cancer screening compared to all other states with the second to the lowest rate (34.7% of the age eligible population).
.")
16
Using the process for cancer control that was previously described, data about the burden of colorectal cancer was assembled and presented to each of the 15 District Cancer Councils. Following these presentations, all of the District Cancer Councils implemented cancer control programs aimed at increasing colorectal cancer screening for age eligible people living in Kentucky

17
What has happened since the implementation of these cancer prevention and control programs?

18
Source: CDC/BRFSS Website, Accessed Jan. 2010

19
Kentucky is now ranked 23 rd among all states in colorectal cancer screening. This is a remarkable improvement not matched by any other state. In other words, no state improved it’s colorectal cancer screening rate in such a short period of time more then Kentucky.

20
The increase in colorectal cancer screening has also been accompanied by a 16% decrease in both the incidence and mortality of colorectal cancer in Kentucky. It is important to note that these changes are statistically significant (P<.05). In other words, it is unlikely that these changes happened by random accident.
. In other words, it is unlikely that these changes happened by random accident..")
21
P<.05 Source: KCR Website, Accessed Jan. 2010

22
P<.05 Source: KCR Website, Accessed Jan. 2010

23
Combining Cancer Surveillance Data in a GIS Format Cancer Control Activities Together this can make a real difference in peoples lives

24
The End Questions

Similar presentations


 Highlights from the Northwest Territories Cancer Report March 2014.>")


 Betty C. Jung, RN, MPH, CHES.>")

 Robin Vanderpool, DrPH, CHES University of Kentucky College of Public Health October.>")


