Download presentation
Presentation is loading. Please wait.

1
The Fiscal Policy Studies Institute www.raguide.org www.resultsaccountability.com Book - DVD Orders amazon.com resultsleadership.org Results-Based Accountability ™ RBA TRAINING FOR TRAINERS AND COACHES DAY 1

2
RBA/OBA Ends vs. Means Exercise The Fiscal Policy Studies Institute Santa Fe, New Mexico Websites raguide.org resultsaccountability.com Book - DVD Orders amazon.com resultsleadership.org

3
INSTRUCTIONS On a blank sheet of paper Ends vs. Means Exercise Step 2. Draw a line from the upper left point to the lower right point. Step 3. Draw a line from the upper right point to the lower left point. Step 4. Draw a horizontal line connecting the bottom two points. Step 5. Mark another point approximately 1 inch below the middle of the horizontal line. Step 6. Connect the upper left point to this new point Step 7. Connect the upper right point to this new point. Like this. Step 1. Draw 4 points that represent the 4 corners of a box or square, about two inches on a side.

4
What do you have? A Star !!!

5
Question If I asked you to draw a star would you need the step-by-step instructions? Of course not ! So what’s the point?

6
And Start Seeing Stars ! Give people the ends and let them figure out the means.

7
Bonus Question How many stars were on the previous page? 28 How many guessed between 26 and 30?

8
RBA / OBA is about starting with ends and working backward to means. And the closing point…. So, for example, Ask people to turn the curve on CHILD ABUSE RATES….. Ask people to turn the curve on SCHOOL ATTENDANCE RATES… Ask people to turn the curve on RATES OF AIR OR WATER POLLUTION…. AND LET THEM FIGURE OUT “HOW.”

9
THANKS ! ’s

10
1.Why is this work important? 2. Population vs. Performance Accountability and Common Language 3. Population Accountability 4a. Performance Accountability 4b. Putting Population and Performance Accountability together Creating a Results Accountability Presentation Simple, Common Sense, Plain Language, Minimum Paper, Useful (2a) Pop vs. Perf Accountability (2b) Language Trap (3b) Definitions (4a) Example of Results (7-9) (Leaking Roof (10) Results Acct. Talk to Action (11) One turn the curve story (15-16) 4 Quadrants – types of perf measures (27) Perf. Acct. Talk to Action 7 Questions (28) Relationship between Pop and Perf. Acct (30b). Every time you make a presentation (31b) Training for Trainers and Coaches
 Pop vs. Perf Accountability (2b) Language Trap (3b) Definitions (4a) Example of Results (7-9) (Leaking Roof (10) Results Acct. Talk to Action (11) One turn the curve story (15-16) 4 Quadrants – types of perf measures (27) Perf. Acct. Talk to Action 7 Questions (28) Relationship between Pop and Perf. Acct (30b). Every time you make a presentation (31b) Training for Trainers and Coaches.")
11
TRAINING FOR TRAINERS AND COACHES TEACHING ROUND 1 WHY ARE WE HERE? WHY ARE YOU HERE? WHY IS THIS WORK IMPORTANT? OR What is the dissatisfaction driving people to consider new ways of working? Why do you believe in this work enough to want to teach it to others? TELL A STORY Pages 2b, 32b

12
SIMPLE COMMON SENSE PLAIN LANGUAGE MINIMUM PAPER USEFUL

13
3 - kinds of performance measures. How much did we do? How well did we do it? Is anyone better off? RBA in a Nutshell 2 – 3 - 7 2 - kinds of accountability Population accountability Performance accountability 7 - questions from ends to means in less than an hour. plus language discipline Results & Indicators Performance measures Baselines & Turning the Curve

14
TRAINING FOR TRAINERS AND COACHES TEACHING ROUND 1 WHY ARE WE HERE? WHY ARE YOU HERE? WHY IS THIS WORK IMPORTANT? OR What is the dissatisfaction driving people to consider new ways of working? Why do you believe in this work enough to want to teach it to others? TELL A STORY

15
Fiscal Policy Studies Institute Santa Fe, New Mexico www.resultsaccountability.com www.raguide.org TRAINING FOR TRAINERS AND COACHES TEACHING ROUND2 Population vs. Performance Accountability Common Language Pages 2b, 3b, 4a

16
Results Accountability is made up of two parts: Performance Accountability about the well-being of CLIENT POPULATIONS For Programs – Agencies – and Service Systems Population Accountability about the well-being of WHOLE POPULATIONS For Communities – Cities – Counties – States - Nations

17
THE LANGUAGE TRAP Too many terms. Too few definitions. Too little discipline Benchmark Target IndicatorGoal Result Objective Outcome Measure Modifiers Measurable Core Urgent Qualitative Priority Programmatic Targeted Performance Incremental Strategic Systemic Lewis Carroll Center for Language Disorders Measurable urgent systemic indicators Core qualitative strategic objectives Make up your own jargon.

18
DEFINITIONS Children born healthy, Children ready for school, Safe communities, Clean Environment, Prosperous Economy Rate of low-birthweight babies, Percent ready at K entry, crime rate, air quality index, unemployment rate 1. How much did we do? 2. How well did we do it? 3. Is anyone better off? RESULT or OUTCOME INDICATOR or BENCHMARK PERFORMANCE MEASURE A condition of well-being for children, adults, families or communities. A measure which helps quantify the achievement of a result. A measure of how well a program, agency or service system is working. Three types: Population Performance Children born healthy Rate of low-birthweight babiesPercent ready at K entry Children ready for school crime rate Safe communities air quality index Clean Environment unemployment rate Prosperous Economy INDICATOR RESULT PERFORMANCE MEASURE Population Performance = Customer Results 1. 2. 3.

19
1. Safe Community 2. Crime Rate 3. Average Police Dept response time 4. People live in safe, stable affordable housing 5. % paying more than 30% of income for housing 6. People have living wage jobs and income 7. % of people with living wage jobs and income 8. % of participants in job training who get living wage jobs IS IT A RESULT, INDICATOR OR PERFORMANCE MEASURE? RESULT INDICATOR PERF. MEASURE RESULT INDICATOR RESULT INDICATOR PERF. MEASURE

21
A tall woody plant with lots of branches and leaves Tree Arbol Fred Tree

22
I think that I shall never see a poem lovely as a TALL WOODY PLANT WITH LOTS OF BRANCHES AND LEAVES The need for labels for ideas

23
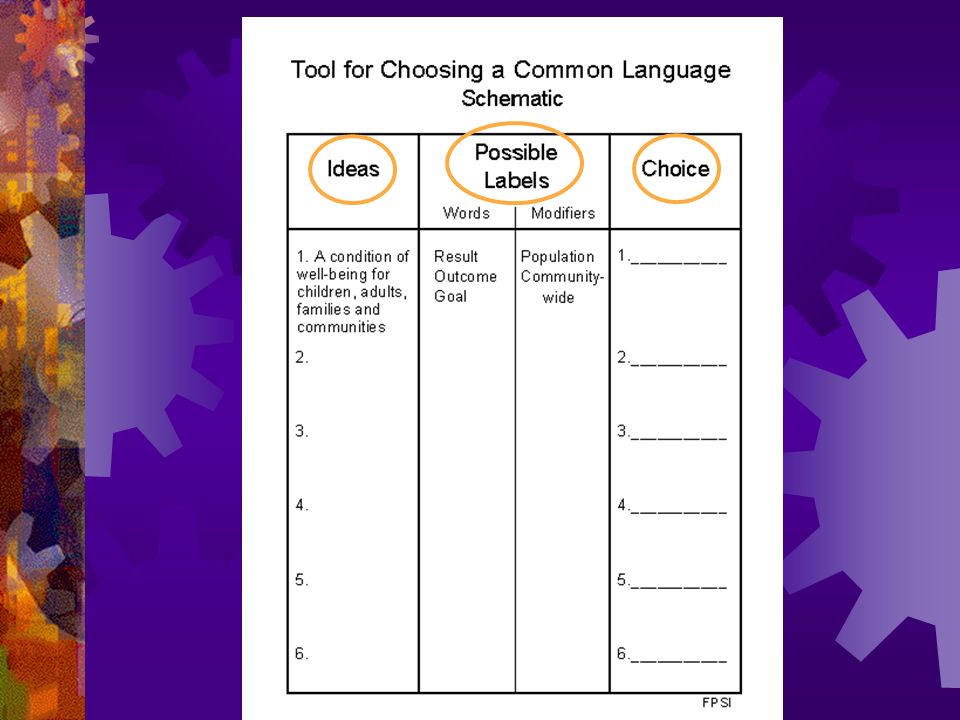
Translation Guide/Rosetta Stone Not the Language Police Ideas 1. A condition of well-being for children, adults, families & communities 2. 3. etc. Group 1Group 2Group 3 etc. RESULTOUTCOMEGOAL TRANSLATION Back to the Idea

24
Fiscal Policy Studies Institute Santa Fe, New Mexico www.resultsaccountability.com www.raguide.org TRAINING FOR TRAINERS AND COACHES Lunch

25
Fiscal Policy Studies Institute Santa Fe, New Mexico www.resultsaccountability.com www.raguide.org TRAINING FOR TRAINERS AND COACHES TEACHING ROUND2 Population vs. Performance Accountability Common Language Pages 2b, 3b 4a

26
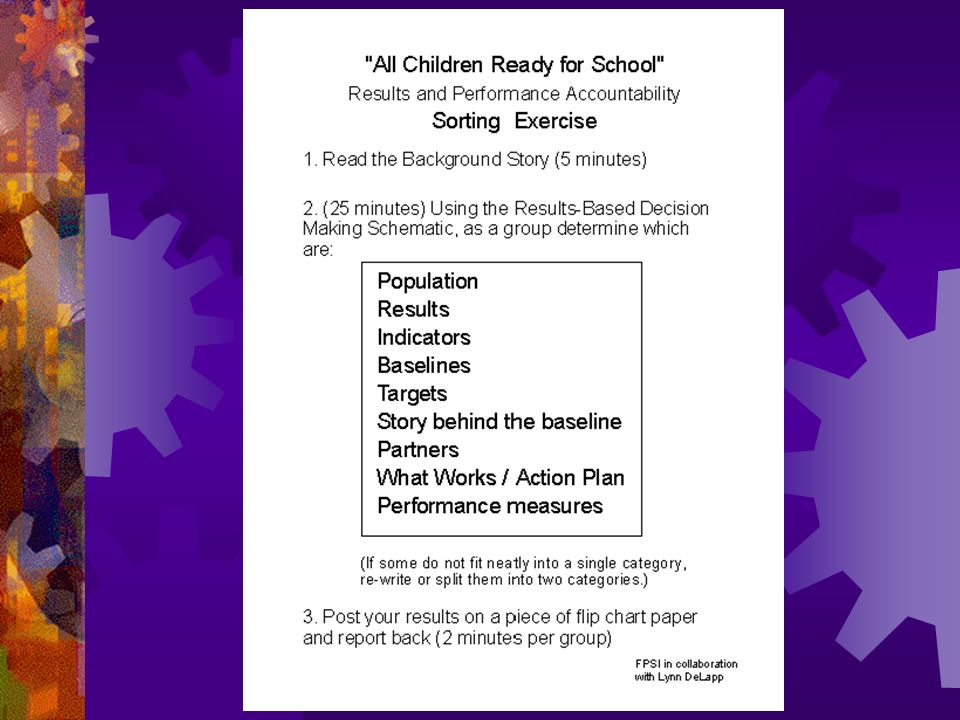
Fiscal Policy Studies Institute Santa Fe, New Mexico www.resultsaccountability.com www.raguide.org TRAINING FOR TRAINERS AND COACHES SORTING EXERCISE

28
Fiscal Policy Studies Institute Santa Fe, New Mexico www.resultsaccountability.com www.raguide.org TRAINING FOR TRAINERS AND COACHES POPULATION ACCOUNTABILITY TURN THE CURVE EXERCISE

29
Performance measure Population Indicator

30
Creating a Working Baseline from Group Knowledge Now Indicator or Performance Measure 75% Not OK? Backcasting Forecasting

31
Turn the Curve Exercise: Population Well-being 5 min:Starting Points - timekeeper and reporter - geographic area - two hats (yours plus partner’s) 10 min:Baseline - pick a result and a curve to turn - forecast (to 2016) – OK or not OK? 15 min:Story behind the baseline - causes/forces at work - information & research agenda part 1 - causes 15 min:What works? (What would it take?) - what could work to do better? - each partners contribution - no-cost / low-cost ideas - information & research agenda part 2 – what works 10 min:Report convert notes to one page Two pointers to action
 - what could work to do better. - each partners contribution - no-cost / low-cost ideas - information & research agenda part 2 – what works 10 min:Report convert notes to one page Two pointers to action.")
32
ONE PAGE Turn the Curve Report: Population Result: _______________ Indicator (Lay Definition) Indicator Baseline Story behind the baseline --------------------------- --------------------------- (List as many as needed) Partners --------------------------- --------------------------- (List as many as needed) Three Best Ideas – What Works 1. --------------------------- 2. --------------------------- 3. ---------No-cost / low-cost Sharp Edges 4. --------- Off the Wall

33
Turn the Curve Exercise – Lessons From talk to action in less than an hour Look what you did! Talk to action in less than 1 hour! What did you learn? How was this different from other processes? What worked and what didn’t work? Why did we ask for: a. Baseline with forecast b. Story before what works c. No cost / low cost d. Two hats e. Results before indicators f. Crazy idea 3. Do you think a lay audience could understand the reports? 4. How many think you could lead this exercise with a small group?

34
HOMEWORK: 1. Self Assessment (Page 53) 2. Reading RBA/OBA Facebook Selected Essays Collective Impact Using RBA Appendix C other language (page 153) Prevention Services (page 100) 3. Hardest Question(s) "How do we….?" 4. Check out the RBA Facebook Discussion Group
 Prevention Services (page 100) 3. Hardest Question(s) How do we…. 4. Check out the RBA Facebook Discussion Group.")
35
Fiscal Policy Studies Institute Santa Fe, New Mexico www.resultsaccountability.com www.raguide.org TRAINING FOR TRAINERS AND COACHES TEACHING ROUND 3 POPULATION ACCOUNTABILITY Pages 2b, 10a, 11 or 12a plus 1 story

36
1.Why is this work important? 2. Population vs. Performance Accountability and Common Language 3. Population Accountability 4a. Performance Accountability 4b. Putting Population and Performance Accountability together Creating a Results Accountability Presentation Simple, Common Sense, Plain Language, Minimum Paper, Useful (2a) Pop vs. Perf Accountability (2b) Language Trap (3b) Definitions (4a) Example of Results (7-9) (Leaking Roof (10) Results Acct. Talk to Action (11) One turn the curve story (15-16) 4 Quadrants – types of perf measures (27) Perf. Acct. Talk to Action 7 Questions (28) Relationship between Pop and Perf. Acct (30b). Every time you make a presentation (31b) Training for Trainers and Coaches
 Pop vs. Perf Accountability (2b) Language Trap (3b) Definitions (4a) Example of Results (7-9) (Leaking Roof (10) Results Acct. Talk to Action (11) One turn the curve story (15-16) 4 Quadrants – types of perf measures (27) Perf. Acct. Talk to Action 7 Questions (28) Relationship between Pop and Perf. Acct (30b). Every time you make a presentation (31b) Training for Trainers and Coaches.")
37
Results Accountability is made up of two parts: Performance Accountability about the well-being of CLIENT POPULATIONS For Programs – Agencies – and Service Systems Population Accountability about the well-being of WHOLE POPULATIONS For Communities – Cities – Counties – States - Nations

38
Community Outcomes for Christchurch, NZ ● A Safe City ● A City of Inclusive and Diverse Communities ● A City of People who Value and Protect the Natural Environment ● A Well-Governed City ● A Prosperous City ● A Healthy City ● A City for Recreation, Fun and Creativity ● A City of Lifelong Learning ● An Attractive and Well-Designed City Example of results for all residents

39
Ottawa Population Results 1. Ottawa has a prosperous economy. 2. Ottawa residents are physically and mentally healthy. 3. Ottawa’s environment is clean and sustainable. 4. Ottawa’s communities are safe and welcoming. 5. Ottawa’s families are safe, stable, and supportive. 6. Ottawa’s children and young people achieve their potential. 7. Ottawa’s elders and people with disabilities and live with dignity and independence in settings they prefer. 8. Ottawa has open, effective, and inclusive government. DRAFT

40
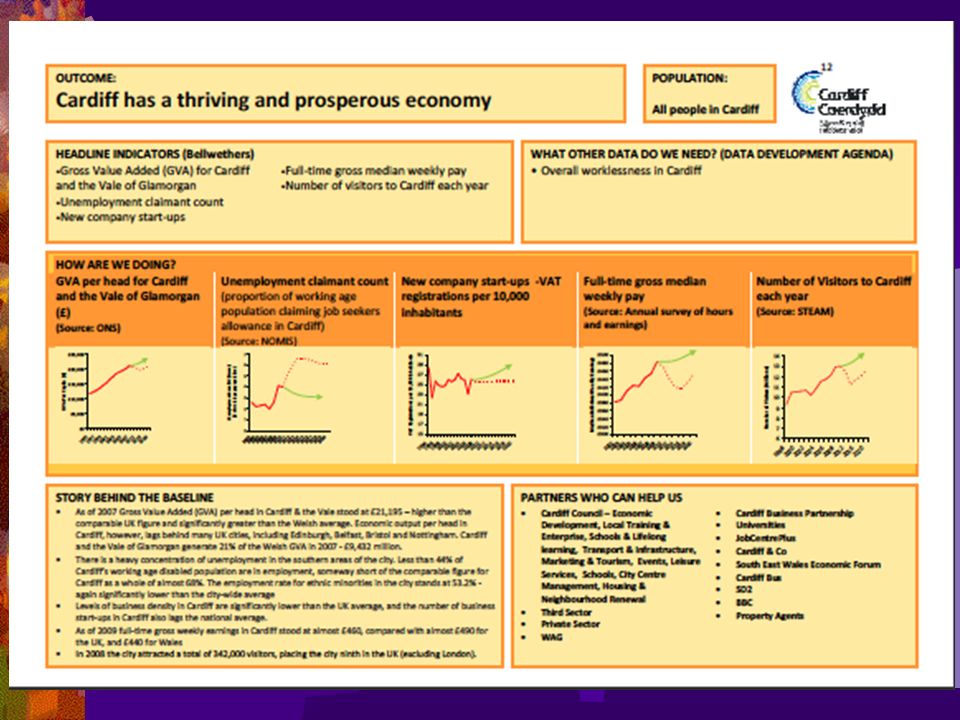
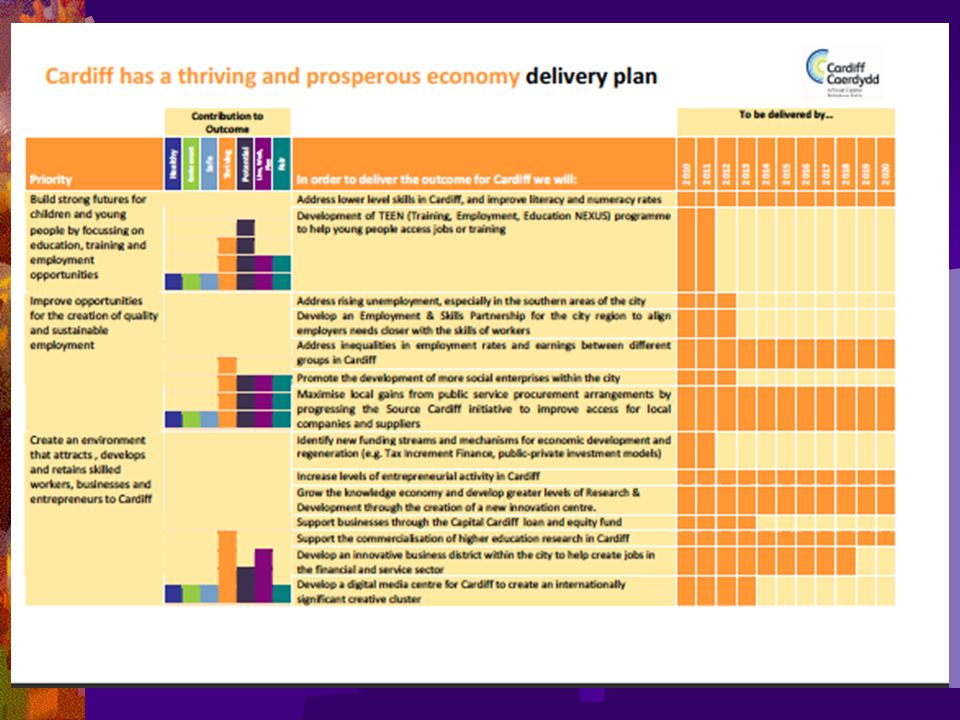
CARDIFF, WALES Community Outcomes 1. People in Cardiff are healthy 2. Cardiff has a clean attractive and sustainable environment 3. People in Cardiff are safe and feel safe 4. Cardiff has a thriving and prosperous economy 5. People in Cardiff achieve their full potential. 6. Cardiff is a great place to live, work and play. 7. Cardiff has a fair, just and inclusive society.

41
VERMONT Population Outcomes (S.293) 1. Vermont has a prosperous economy. 2. Vermonters are healthy. 3. Vermont’s environment is clean and sustainable. 4. Vermont’s communities are safe and supportive. 5. Vermont’s families are safe, nurturing, stable, and supported. 6. Vermont’s children and young people achieve their potential. 7. Vermont’s elders and people with disabilities and people with mental conditions live with dignity and independence in settings they prefer. 8. Vermont has open, effective, and inclusive government at the State and local levels.

49
Leaking Roof (Results thinking in everyday life) Experience Measure Story behind the baseline (causes) Partners What Works Action Plan Inches of Water BASELINE ? Fixed Not OK Turning the Curve Action Plan # 2

50
Results / Outcomes Indicators Baseline & Story

51
45 people per day 75 people per day 2010 28 people per day MADD

53
Rebound

56
Christchurch, New Zealand Number of Graffiti Sites FY 2002 to FY 2010

57
Hull, UK "Woundings"

58
Fiscal Policy Studies Institute Santa Fe, New Mexico www.resultsaccountability.com www.raguide.org TRAINING FOR TRAINERS AND COACHES TEACHING ROUND 3 POPULATION ACCOUNTABILITY Pages 2b, 10a, 11 or 12a plus 1 story

59
HOMEWORK: 1. Self Assessment (Page 53) 2. Reading RBA/OBA Facebook Selected Essays Collective Impact Using RBA Appendix C other language (page 153) Prevention Services (page 100) 3. Hardest Question(s) "How do we….?" 4. Check out the RBA Facebook Discussion Group
 Prevention Services (page 100) 3. Hardest Question(s) How do we…. 4. Check out the RBA Facebook Discussion Group.")
61
Results Accountability Fiscal Policy Studies Institute Santa Fe, New Mexico www.resultsaccountability.com www.raguide.org www.trafford.com TRAINING FOR TRAINERS AND COACHES DAY 2

62
TOUGHEST QUESTIONS

63
The Simplest Way TO IMPLEMENT RBA POPULATION ACCOUNTABILITY 1. Pick an important indicator curve 2. Run the Population Turn the Curve Exercise 3. Take action Repeat PERFORMANCE ACCOUNTABILITY 1. Pick an important performance measure curve 2. Run the Performance Turn the Curve Exercise 3. Take action Repeat

64
The 20-60-20 RULE

65
RESULTS BASED BUDGETING Do we need it? Is it working? POPULATION ACCOUNTABILITY PERFORMANCE ACCOUNTABILITY

66
1. Ask each program to assign someone to become the in-house RBA expert. (Treat this like a technical support function like an in-house computer expert.) 2. Have these people practice and get good at selecting performance measures and running the Turn the Curve Exercises. 3. Create a network of in-house experts so they can support each other, learn how to do joint RBA training and coaching. 4. Ask the in-house experts to review the RBA Self- Assessment Questionnaire (and create a score if useful) on a regular basis. RBA expert in each unit
 2. Have these people practice and get good at selecting performance measures and running the Turn the Curve Exercises. 3. Create a network of in-house experts so they can support each other, learn how to do joint RBA training and coaching. 4. Ask the in-house experts to review the RBA Self- Assessment Questionnaire (and create a score if useful) on a regular basis. RBA expert in each unit.")
67
Alternative to Traditional Evaluation Methods: DEMONSTRATING a CONTRIBUTION to complex change efforts… requires 3 elements: A Curve to Turn 1 We tried a bunch of stuff that had a credible chance of making a difference … 2 …and it had a timely relationship to…. 3 …. a turn in the curve. c FPSI

70
Next Generation Contracting Contract Provisions Provision 1. Specify the 3 to 5 most important performance measures (from the How well did we do it? and Is anyone better off? categories). Provision 2. Specify that the contractor will use a continuous improvement process (the RBA 7 Questions). Provision 3. Specify how the funder and contractor will work in partnership to maximize LR customer results (quarterly meetings using the 7 questions as the agenda). Provision 4. Specify that the funder will work with the funding community to simplify and standardize contracting and performance reporting.
. Provision 2. Specify that the contractor will use a continuous improvement process (the RBA 7 Questions). Provision 3. Specify how the funder and contractor will work in partnership to maximize LR customer results (quarterly meetings using the 7 questions as the agenda). Provision 4. Specify that the funder will work with the funding community to simplify and standardize contracting and performance reporting..")
71
Provision 5: : Clear articulation of role in population/community well-being using the language of contribution not attribution. Provision 6: 10% for quality management and administration. Provision 7: Multi-year funding using 3 year rolling contracts Provision 8: Use of targets that are fair and useful. Provision 9: Fund flexibility and virtual funding pool: transfer of up to 10% across line items and program lines. Provision 10: Request for Results: Getting past the sometimes negative effects of competitive RFP contracting or tendering. Next Generation Contracting Contract Provisions

72
Fiscal Policy Studies Institute Santa Fe, New Mexico www.resultsaccountability.com www.raguide.org TRAINING FOR TRAINERS AND COACHES PERFORMANCE ACCOUNTABILITY

73
Select 3 to 5 Performance Measures ACROSS THE BOTTOM OF THE ORG CHART 3 - 5 20 – 60 – 20 Rule

74
Performance Accountability For Programs, Agencies and Service Systems Fiscal Policy Studies Institute Santa Fe, New Mexico www.resultsaccountability.com www.raguide.org

75
Results Accountability is made up of two parts: Performance Accountability about the well-being of CLIENT POPULATIONS For Programs – Agencies – and Service Systems Population Accountability about the well-being of WHOLE POPULATIONS For Communities – Cities – Counties – States - Nations

76
“All performance measures that have ever existed for any program in the history of the universe involve answering two sets of interlocking questions.”

77
How Much did we do? ( # ) How Well did we do it? ( % ) Quantity Quality Program Performance Measures
 Quantity Quality Program Performance Measures.")
78
Effort How hard did we try? Effect Is anyone better off? Program Performance Measures

79
Effort Effect How Much How Well Program Performance Measures

80
How much service did we deliver? Program Performance Measures How well did we deliver it? How much change / effect did we produce? What quality of change / effect did we produce? Quantity Quality Effect Effort Output Input

81
How much did we do? Program Performance Measures How well did we do it? Is anyone better off? Quantity Quality Effect Effort # %

82
How much did we do? Education How well did we do it? Is anyone better off? Quantity Quality Effect Effort Number of students Student-teacher ratio Number of high school graduates (completion or certificate rate) Percent of high school graduates (completion or certificate rate)
 Percent of high school graduates (completion or certificate rate).")
83
How much did we do? Education How well did we do it? Is anyone better off? Quantity Quality Effect Effort Number of students Student-teacher ratio Percent of 9 th graders who enter college or employment after graduation Number of 9 th graders who enter college or employment after graduation

84
How much did we do? Pediatric Practice How well did we do it? Is anyone better off? Number of children treated Percent of patients waiting less than 30 min in the waiting room Quantity Quality Effect Effort # children fully immunized (in the practice) % children fully immunized (in the practice)
 % children fully immunized (in the practice).")
85
How much did we do? Drug/Alcohol Treatment Program How well did we do it? Is anyone better off? Number of persons treated Percent of staff with training/ certification Number of clients off of alcohol & drugs - at exit - 12 months after exit Percent of clients off of alcohol & drugs - at exit - 12 months after exit Quantity Quality Effect Effort

86
How much did we do? Fire Department How well did we do it? Is anyone better off? Number of responses Response Time Quantity Quality Effect Effort # of fires kept to room of origin % of fires kept to room of origin

87
How much did we do? General Motors How well did we do it? Is anyone better off? # of production hrs # tons of steel Employees per vehicle produced # of cars sold $ Amount of Profit $ Car value after 2 years Quantity Quality Effect Effort Source: USA Today 9/28/98 % Market share Profit per share % Car value after 2 years

88
How much did we do? Not All Performance Measures Are Created Equal How well did we do it? Is anyone better off? Least Important Quantity Quality Effect Effort Most Important Least Most Also Very Important Quality

89
How much did we do? The Matter of Control How well did we do it? Is anyone better off? Quantity Quality Effect Effort Least Control PARTNERSHIPS Most Control

90
How much did we do? Performance Accountability Types of Measures found in each Quadrant How well did we do it? Is anyone better off? # Clients/customers served # Activities (by type of activity) % Common measures e.g. client staff ratio, workload ratio, staff turnover rate, staff morale, % staff fully trained, % clients seen in their own language, worker safety, unit cost % Skills / Knowledge (e.g. parenting skills) # % Attitude / Opinion (e.g. toward drugs) # % Behavior (e.g.school attendance) # % Circumstance (e.g. working, in stable housing) # % Activity-specific measures e.g. % timely, % clients completing activity, % correct and complete, % meeting standard Point in Time vs. 2 Point Comparison # %
 % Common measures e.g. client staff ratio, workload ratio, staff turnover rate, staff morale, % staff fully trained, % clients seen in their own language, worker safety, unit cost % Skills / Knowledge (e.g. parenting skills) # % Attitude / Opinion (e.g. toward drugs) # % Behavior (e.g.school attendance) # % Circumstance (e.g. working, in stable housing) # % Activity-specific measures e.g. % timely, % clients completing activity, % correct and complete, % meeting standard Point in Time vs. 2 Point Comparison # %.")
91
LR UR Primary v. Secondary Direct v. Indirect Internal v. External Baseline & Story

93
Watermain Breaks per year London Ontario

97
Christus Saint Vincent's Medical Center Santa Fe, NM Turned curve on high end ER Use Etre Kathy

98
How much did we do? Service: __________________________________ How well did we do it? Is anyone better off? Primary customers # studentspatients persons trained Primary activity # hours of instruction diagnostic testsjob coursesalarms responded to If your service works really well, how are your customer's better off? # students who graduate patients who fully recover fires kept to room of origin % Unit cost Workload ratio % of ___x___ that happen on time persons who get jobs School HospitalJob Training Fire Department customers served

99
Fiscal Policy Studies Institute Santa Fe, New Mexico www.resultsaccountability.com www.raguide.org TRAINING FOR TRAINERS AND COACHES SELECTING PERFORMANCE MEASURES DEMONSTRATION & EXERCISE

100
How much did we do? Choosing Headline Measures and the Data Development Agenda How well did we do it? Is anyone better off? Quantity Quality Effect Effort # Measure 1 ---------------------------- # Measure 2 ---------------------------- # Measure 3 ---------------------------- # Measure 4 ---------------------------- # Measure 5 ---------------------------- # Measure 6 ---------------------------- # Measure 7 ---------------------------- #1 Headline #2 Headline #3 Headline #1 DDA #2 DDA #3 DDA % Measure 8 ---------------------------- % Measure 9 ----------------------------- % Measure 10 --------------------------- % Measure 11 --------------------------- % Measure 12 --------------------------- % Measure 13 --------------------------- % Measure 14 --------------------------- # Measure 15 ---------------------------- # Measure 16 ---------------------------- # Measure 17 ---------------------------- # Measure 18 ---------------------------- # Measure 19 ---------------------------- # Measure 20 ---------------------------- # Measure 21 ---------------------------- % Measure 15 ---------------------------- % Measure 16 ---------------------------- % Measure 17 ---------------------------- % Measure 18 ---------------------------- % Measure 19 ---------------------------- % Measure 20 ---------------------------- % Measure 21 ----------------------------

101
How to Measure: - Capacity Building - Vibrant Neighborhoods - Developed Countries etc. See "Trying Hard…" pages 128- 129

102
Performance measure Population Indicator FPSI

103
Fiscal Policy Studies Institute Santa Fe, New Mexico www.resultsaccountability.com www.raguide.org TRAINING FOR TRAINERS AND COACHES USING PERFORMANCE MEASURES Turn the Curve Exercise

104
Creating a Working Baseline from Group Knowledge Now Indicator or Performance Measure 75% Not OK? Backcasting Forecasting

105
Turn the Curve Exercise: Program Performance 5 min:Starting Points - timekeeper and reporter - identify a program to work on - two hats (yours plus partner’s) 10 min:Performance measure baseline - choose 1 measure to work on – from the lower right quadrant - forecast (to 2016) – OK or not OK? 15 min:Story behind the baseline - causes/forces at work - information & research agenda part 1 - causes 15 min:What works? (What would it take?) - what could work to do better? - each partners contribution - no-cost / low-cost ideas - information & research agenda part 2 – what works 10 min:Report convert notes to one page Two pointers to action
 - what could work to do better. - each partners contribution - no-cost / low-cost ideas - information & research agenda part 2 – what works 10 min:Report convert notes to one page Two pointers to action.")
106
Program: _______________ Performance Measure (Lay definition) Performance Measure Baseline Story behind the baseline --------------------------- --------------------------- (List as many as needed) Partners --------------------------- --------------------------- (List as many as needed) Three Best Ideas – What Works 1. --------------------------- 2. --------------------------- 3. ---------No-cost / low-cost ONE PAGE Turn the Curve Report: Performance Sharp Edges 4. --------- Off the Wall

107
Turn the Curve Exercise – Lessons From talk to action in less than an hour Look what you did! Talk to action in less than 1 hour! What did you learn? How was this different from other processes? What worked and what didn’t work? Why did we ask for: a. Baseline with forecast b. Story before what works c. No cost / low cost d. Two hats e. Results before indicators f. Crazy idea 3. Do you think a lay audience could understand the reports? 4. How many think you could lead this exercise with a small group?

108
Fiscal Policy Studies Institute www.resultsaccountability.com www.raguide.org TRAINING FOR TRAINERS AND COACHES TEACHING ROUND 4 PERFORMANCE ACCOUNTABILITY CONNECTING POPULATION & PERFORMANCE ACCOUNTABILITY

109
1.Why is this work important? 2. Population vs. Performance Accountability and Common Language 3. Population Accountability 4a. Performance Accountability 4b. Putting Population and Performance Accountability together Creating a Results Accountability Presentation Simple, Common Sense, Plain Language, Minimum Paper, Useful (2a) Pop vs. Perf Accountability (2b) Language Trap (3b) Definitions (4a) Example of Results (7-9) (Leaking Roof (10) Results Acct. Talk to Action (11) One turn the curve story (15-16) 4 Quadrants – types of perf measures (27) Perf. Acct. Talk to Action 7 Questions (28) Relationship between Pop and Perf. Acct (30b). Every time you make a presentation (31b) Training for Trainers and Coaches
 Pop vs. Perf Accountability (2b) Language Trap (3b) Definitions (4a) Example of Results (7-9) (Leaking Roof (10) Results Acct. Talk to Action (11) One turn the curve story (15-16) 4 Quadrants – types of perf measures (27) Perf. Acct. Talk to Action 7 Questions (28) Relationship between Pop and Perf. Acct (30b). Every time you make a presentation (31b) Training for Trainers and Coaches.")
110
How much did we do? Performance Accountability Types of Measures found in each Quadrant How well did we do it? Is anyone better off? # Clients/customers served # Activities (by type of activity) % Common measures e.g. client staff ratio, workload ratio, staff turnover rate, staff morale, % staff fully trained, % clients seen in their own language, worker safety, unit cost % Skills / Knowledge (e.g. parenting skills) # % Attitude / Opinion (e.g. toward drugs) # % Behavior (e.g.school attendance) # % Circumstance (e.g. working, in stable housing) # % Activity-specific measures e.g. % timely, % clients completing activity, % correct and complete, % meeting standard Point in Time vs. 2 Point Comparison
 % Common measures e.g. client staff ratio, workload ratio, staff turnover rate, staff morale, % staff fully trained, % clients seen in their own language, worker safety, unit cost % Skills / Knowledge (e.g. parenting skills) # % Attitude / Opinion (e.g. toward drugs) # % Behavior (e.g.school attendance) # % Circumstance (e.g. working, in stable housing) # % Activity-specific measures e.g. % timely, % clients completing activity, % correct and complete, % meeting standard Point in Time vs. 2 Point Comparison.")
111
LR UR Primary v. Secondary Direct v. Indirect Internal v. External Baseline & Story

112
Contribution relationship Alignment of measures Appropriate responsibility THE LINKAGE Between POPULATION and PERFORMANCE POPULATION ACCOUNTABILITY Healthy Births Rate of low birth-weight babies Children Ready for School Percent fully ready per K-entry assessment Self-sufficient Families Percent of parents earning a living wage CUSTOMER RESULTS # persons receiving training Unit cost per person trained # who get living wage jobs % who get living wage jobs PERFORMANCE ACCOUNTABILITY POPULATION RESULTS Job Training Program

113
Fiscal Policy Studies Institute www.resultsaccountability.com www.raguide.org TRAINING FOR TRAINERS AND COACHES TEACHING ROUND 4 PERFORMANCE ACCOUNTABILITY CONNECTING POPULATION & PERFORMANCE ACCOUNTABILITY

114
How much did we do? Performance Accountability Types of Measures found in each Quadrant How well did we do it? Is anyone better off? # Clients/customers served # Activities (by type of activity) % Common measures e.g. client staff ratio, workload ratio, staff turnover rate, staff morale, % staff fully trained, % clients seen in their own language, worker safety, unit cost % Skills / Knowledge (e.g. parenting skills) # % Attitude / Opinion (e.g. toward drugs) # % Behavior (e.g.school attendance) # % Circumstance (e.g. working, in stable housing) # % Activity-specific measures e.g. % timely, % clients completing activity, % correct and complete, % meeting standard Point in Time vs. 2 Point Comparison
 % Common measures e.g. client staff ratio, workload ratio, staff turnover rate, staff morale, % staff fully trained, % clients seen in their own language, worker safety, unit cost % Skills / Knowledge (e.g. parenting skills) # % Attitude / Opinion (e.g. toward drugs) # % Behavior (e.g.school attendance) # % Circumstance (e.g. working, in stable housing) # % Activity-specific measures e.g. % timely, % clients completing activity, % correct and complete, % meeting standard Point in Time vs. 2 Point Comparison.")
115
LR UR Primary v. Secondary Direct v. Indirect Internal v. External Baseline & Story

116
Contribution relationship Alignment of measures Appropriate responsibility THE LINKAGE Between POPULATION and PERFORMANCE POPULATION ACCOUNTABILITY Healthy Births Rate of low birth-weight babies Children Ready for School Percent fully ready per K-entry assessment Self-sufficient Families Percent of parents earning a living wage CUSTOMER RESULTS # persons receiving training Unit cost per person trained # who get living wage jobs % who get living wage jobs PERFORMANCE ACCOUNTABILITY POPULATION RESULTS Job Training Program

117
1.Why is this work important? 2. Population vs. Performance Accountability and Common Language 3. Population Accountability 4a. Performance Accountability 4b. Putting Population and Performance Accountability together Creating a Results Accountability Presentation Simple, Common Sense, Plain Language, Minimum Paper, Useful (2a) Pop vs. Perf Accountability (2b) Language Trap (3b) Definitions (4a) Example of Results (7-9) (Leaking Roof (10) Results Acct. Talk to Action (11) One turn the curve story (15-16) 4 Quadrants – types of perf measures (27) Perf. Acct. Talk to Action 7 Questions (28) Relationship between Pop and Perf. Acct (30b). Every time you make a presentation (31b) Training for Trainers and Coaches
 Pop vs. Perf Accountability (2b) Language Trap (3b) Definitions (4a) Example of Results (7-9) (Leaking Roof (10) Results Acct. Talk to Action (11) One turn the curve story (15-16) 4 Quadrants – types of perf measures (27) Perf. Acct. Talk to Action 7 Questions (28) Relationship between Pop and Perf. Acct (30b). Every time you make a presentation (31b) Training for Trainers and Coaches.")
118
Fiscal Policy Studies Institute Santa Fe, New Mexico www.resultsaccountability.com www.raguide.org TRAINING FOR TRAINERS AND COACHES NAME-MOTTO-MASCOT LAST SHOT AT HARD QUESTIONS NEXT STEPS EVALUATION & CERTIFICATES

119
Next Steps: 1. What’s 1 thing I could personally do with what I learned these two days? 2. What’s 1 thing I would like to ask city government to do to support this work? p. 37

120
CLOSING

122
3 - kinds of performance measures. How much did we do? How well did we do it? Is anyone better off? RBA in a Nutshell 2 – 3 - 7 2 - kinds of accountability Population accountability Performance accountability 7 - questions from ends to means in less than an hour. plus language discipline Results & Indicators Performance measures Baselines & Turning the Curve

123
Resources Book - DVD Orders amazon.com resultsleadership.org www.raguide.org www.resultsaccountability.com RBA Facebook Group

124
THANK YOU ! Book - DVD Orders amazon.com resultsleadership.org

Similar presentations


 The Fiscal Policy Studies Institute Websites raguide.org resultsaccountability.com Books & DVDs amazon.com resultsleadership.org.>")


>")


 The Fiscal Policy Studies Institute Websites raguide.org resultsaccountability.com Book - DVD Orders amazon.com resultsleadership.org.>")


 The Fiscal Policy Studies Institute www.raguide.org www.resultsaccountability.com Coreassets.com Book - DVD Orders amazon.com.>")


