Download presentation
Presentation is loading. Please wait.

2
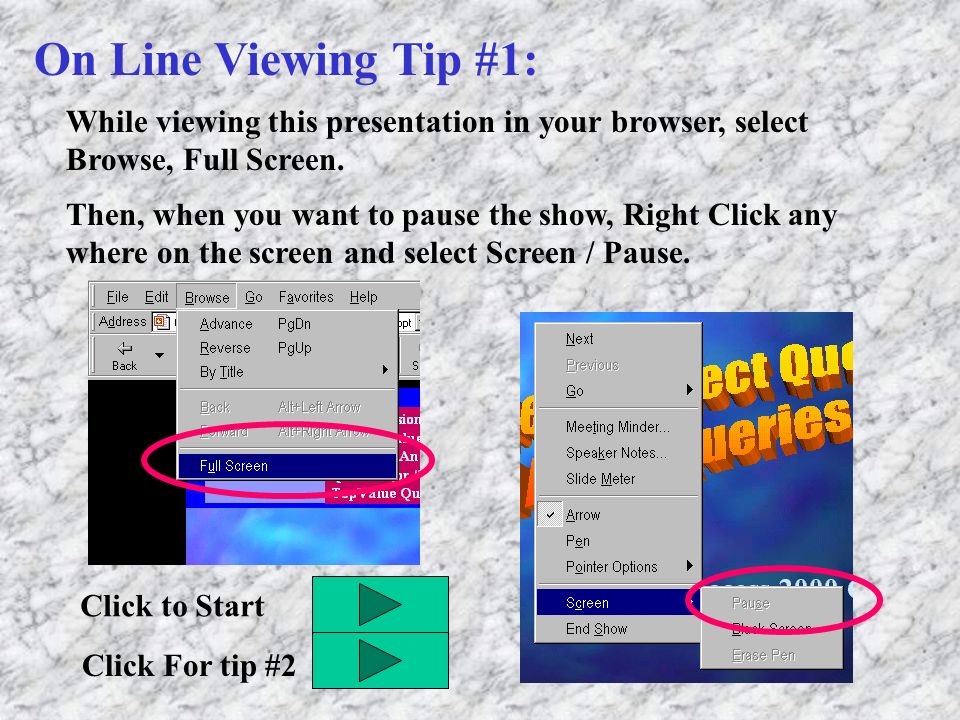
On Line Viewing Tip #1: While viewing this presentation in your browser, select Browse, Full Screen. Then, when you want to pause the show, Right Click any where on the screen and select Screen / Pause. Click to Start Click For tip #2

3
On Line Viewing Tip #2: If you desire, you can also download each presentation for off line viewing in PowerPoint and / or printing. Click to Start Simply right click on the lecture link and select “Save Target As...” from the resulting Menu. Click For tip #1

4
Customizing Reports SESSION 6.1 This section covers creating a custom report, moving / re- sizing of controls on reports and options of controls on reports.

5
The Major Steps of a MicroSoft Access Database Tables Queries Forms Macros Reports Pages Modules © Copyright 2001 Innovative Systems Management Our Road Map We are here!

6
Custom Reports A report is a formatted hardcopy of the contents of one or more tables from a database.

7
Custom Reports Although you can format and print data using datasheets, queries, and forms, reports allow you greater flexibility and provide a more professional, custom appearance.

8
Custom Reports Reports can be used, for example, to print billing statements and mailing labels and many other things.

9
Report Sections An Access report is divided into seven sections. Although only the detail section is required, each report can contain any combination of the seven different sections or all of them. Page AC 6.02

11
Report Sections You don’t have to include all seven sections in your report. When you design your report, you determine which sections to include and what information to place in each section.

12
Let’s take a look at the custom report that Elsa has designed for us to create.

13
An Access report with all sections shown Report Header. Group Headers. Detail Sections. Page Footer. Page Header. Detail Section. Group Footer. Report Footer.

14
Design a report before creating it Before creating a report, you should always create a design. This will help you decide what you want in the report and where you want each piece of data placed in the report. This figure contains an example of a report design. Note that the X's are used as place holders representing the number of positions each field will use in the report.

15
Report Header Appears at the top of the Report’s first page only.

16
Page Header Appears at the top of each page on the Report.

17
Detail Section Shows the detail for each defined group.

18
Report Footer Section Appears at the bottom of the Report’s last page only.

19
The Report window in Design view is similar to the Form window in Design view, which you used in the previous tutorial to customize forms.

20
In the design view, we can see the ToolBox button on the toolbar

21
Clicking this will produce the toolbox.

22
The page Header section is shown here!

23
The Detail section is shown here!

24
The Page Footer section is shown here!

25
To Create or get rid of a Page Header/Footer or Report Header/Footer section you can click View from the menu bar and click on the appropriate section option.

26
To create a calculated field on a report (or form) you must first be in the design view. Once in the design view, the first step is to create an “UNBOUND” text box that will be used for the calculated field. Conditional Values in Calculated Fields

27
To place an unbound text box in the report, we will use the Textbox tool on the tool box.

28
Conditional Values in Calculated Fields First, left click on the tool to activate it and then release the mouse button.

29
Conditional Values in Calculated Fields Then position the pointer on the report where you would like the text box and again, left click the mouse button.

30
Conditional Values in Calculated Fields This will place the Unbound text box on the report.

31
Conditional Values in Calculated Fields There are several ways in which you can add a calculated conditional value text box to your report. The first way is to create a calculated field in an underlying query, as shown on page AC 6.05 in your books. Page AC 6.05

32
Conditional Values in Calculated Fields The second way is to add a calculation directly to an unbound field in the report.

33
Conditional Values in Calculated Fields To accomplish this, right click on the unbound text box (not it’s label) and select properties from the shortcut menu.
 and select properties from the shortcut menu.")
34
Conditional Values in Calculated Fields When the text box’s property window appears, left click on the “All” tab and then right click on the “Control Source” property and select Zoom from the short cut menu.

35
Conditional Values in Calculated Fields This will zoom in to the control source property and will allow you more room for typing your expression

36
Conditional Values in Calculated Fields While in the Zoom Box, type the following expression. =IIf([Wage] Is Not Null,[Hours/Week]*[Wage],0) Then Press the OK button. =IIf([Wage] Is Not Null,[Hours/Week]*[Wage],0)
 Then Press the OK button. =IIf([Wage] Is Not Null,[Hours/Week]*[Wage],0).")
37
Conditional Values in Calculated Fields This expression says: If the existing field named [Wage] in the underlying table or query is null (blank) then place a zero in this field, otherwise (else) place the value of the Hours/Week times the Wage for this record here. =IIf([Wage] Is Not Null,[Hours/Week]*[Wage],0)
![Conditional Values in Calculated Fields This expression says: If the existing field named [Wage] in the underlying table or query is null (blank) then place a zero in this field, otherwise (else) place the value of the Hours/Week times the Wage for this record here.](http://images.slideplayer.com/25/8069822/slides/slide_37.jpg "=IIf([Wage] Is Not Null,[Hours/Week]*[Wage],0).")
38
Conditional Values in Calculated Fields Don’t forget the “=“ sign. This is not needed in a Query but is necessary when typing the expression in the control source of a text box on a form or report. =IIf([Wage] Is Not Null,[Hours/Week]*[Wa ge],0)
.")
39
Conditional Values in Calculated Fields The IIF Function, referred to as the “Immediate IF” function, lets you assign one value to a calculated field if a condition is true, and another value if the condition is false. =IIf([Wage] Is Not Null,[Hours/Week]*[Wa ge],0)
.")
40
Conditional Values in Calculated Fields Let’s take a look at another example that uses the IIF Function. =IIf([Type of Customer]=1,"Individual", IIf([Type of Customer]=2,"Pet Store","Zoo"))
).")
41
Conditional Values in Calculated Fields =IIf([Type of Customer]=1,"Individual", IIf([Type of Customer]=2,"Pet Store","Zoo")) In this example, we have three possible conditions. The Expression is telling us that if the value in the [Type of Customer] field equals 1, then show the text “Individual”, if this value equals 2 then show the text “Pet Store”, and if it does not equal 1 or 2 then show the text “Zoo”
![Conditional Values in Calculated Fields =IIf([Type of Customer]=1, Individual , IIf([Type of Customer]=2, Pet Store , Zoo )) In this example, we have three possible conditions.](http://images.slideplayer.com/25/8069822/slides/slide_41.jpg "The Expression is telling us that if the value in the [Type of Customer] field equals 1, then show the text Individual , if this value equals 2 then show the text Pet Store , and if it does not equal 1 or 2 then show the text Zoo .")
42
Conditional Values in Calculated Fields Another way to obtain the same results without having to create a calculated field on a form is to create a new table as shown below that contains all the possible conditions.

43
Conditional Values in Calculated Fields You can then add the new table to the query that your form is based on.

44
Conditional Values in Calculated Fields Create a join between the Customer Table and your new table, using the common field. In this case the common field is Type of Customer.

45
Conditional Values in Calculated Fields Once the join is created, you can then bring down the [Description] field from your new table to the design grid.
![Conditional Values in Calculated Fields Once the join is created, you can then bring down the [Description] field from your new table to the design grid.](http://images.slideplayer.com/25/8069822/slides/slide_45.jpg "Conditional Values in Calculated Fields Once the join is created, you can then bring down the [Description] field from your new table to the design grid.")
46
Conditional Values in Calculated Fields Viewing the datasheet of the query, we would see the description of the Customer Type spelled out for each record.

47
Conditional Values in Calculated Fields Now that we have the [Description] field in our underlying query, we can simply use that field for our Type of Customer Control Source on our form, rather than typing in an expression.
![Conditional Values in Calculated Fields Now that we have the [Description] field in our underlying query, we can simply use that field for our Type of Customer Control Source on our form, rather than typing in an expression.](http://images.slideplayer.com/25/8069822/slides/slide_47.jpg "Conditional Values in Calculated Fields Now that we have the [Description] field in our underlying query, we can simply use that field for our Type of Customer Control Source on our form, rather than typing in an expression.")
48
Conditional Values in Calculated Fields Using the Table of Descriptions method is better suited for cases where you may have many different descriptions, as the IIF statement is limited to only 10 conditions and can get quite complex after the 3rd condition.

49
You add bound controls to a report in the same way that you add them to a form. Adding Fields to a Report

50
Reference Window All Fields Adding All Fields to a Report Display the report in the design view Click the field list button on the Report Design tool bar to display the field list. To place all fields in the report, double click the field list title bar to highlight all fields, then click anywhere in the highlighted area hold and drag the fields to the desired section of the report. Release the mouse button when the fields are in position. Page AC 6.14

51
Reference Window A Single Adding A Single Field to a Report Display the report in the design view Click the field list button on the Report Design tool bar to display the field list. To place a single field in the report, position the pointer on the field name in the field list, and then click, hold and drag the field name from the field list to the report. Release the mouse button when the pointer is correctly positioned. Page AC 6.14

52
By clicking the field list button on the tool bar we can view the fields in the underlying table or query.

53
The field list

54
We have the option of clicking on the Field List Title bar to select all fields and then click, hold and drag any one field to the detail section. This will insert all fields.

55
Or, we can click, hold and drag one field at a time to the detail section, selecting only certain fields, instead of all fields.

56
Notice the labels connected to each field.

57
If we select a label, or all labels (without the text box) we can cut these to the clipboard.
 we can cut these to the clipboard.")
58
This will remove them from the detail section, leaving the text box only.

59
Clicking anywhere in the Page Header Section or on the Page Header Bar will select the Page Header. We can then paste the labels into this section.

60
Moving and resizing controls is identical to that of forms. This is covered on page AC 6.17 in your books.

61
Changing the Caption Property Each label has a Caption property that controls the text displayed in the label.

62
Changing the Caption Property The caption property for an object determines the text displayed for that object.

63
The default Caption property value for a bound control is the field name followed by a colon. Other controls, such as buttons and tab controls, have Caption properties as well.

64
You can change the value of a Caption property for an object by using the property sheet for that object. You should change the Caption property value for an object if the default value is difficult to read or understand.

65
You can change the caption property for a label by 1. Right-click the label box to select it and display the shortcut menu 2. Click Properties to display the property sheet 3. Find the Caption Property 4. Type the new Caption 5. Click the Close button to close the property sheet.

66
You can align controls in a report or form using the Align command. This command provides options for aligning controls in different ways.

67
For example, if you select objects in a column, you can use the Align Left option to align the left edges of the objects.

68
Aligning Controls Similarly, if you select objects in a row, you can use the Align Top option to align the top edges of the objects.

69
The Align Right and Align Bottom options work in the same way. A fifth option, Align To Grid, aligns selected objects with the grid dots in the Report window.

70
Aligning Controls To use the Align Command, first, select the objects that you wish to align, then select Format from the Menu bar and then select Align.

71
Format Align Left Right Top Bottom To Grid

72
To preview the report, simply click on the Print Preview button on the Report’s Design toolbar.

73
To Zoom in and out you can use the Zoom buttons on the Report’s Print Preview tool bar, or...

74
... Just click in the preview section to Zoom In or Click there again to Zoom Out.

75
Clicking in the preview of the report or using the Zoom buttons on the tool bar changes the size of the page displayed in Print Preview.

76
Customizing Reports SESSION 6.2 This section covers adding lines to a report, hiding duplicate values of fields on a report, sorting / grouping, calculating group totals, conditional formatting and domain functions.

77
Adding lines to a report

78
Adding Lines to a Report Reference Window Adding Lines to a Report Display the Report in the Design view Click the Line tool on the toolbox Position the pointer where you want one end of the line to appear Click, hold and drag the pointer to the other end of the line, and then release the mouse button. Page AC 6.27

79
You can use lines in a report to improve the report’s readability and to group related information together. The Line tool on the toolbox allows you to add a line to a report or from.

80
A line on a report is an object, just like a text box or label. You can therefore view it’s properties in a property window.

81
Notice the border style property. This is where you can select what kind of line you want such as a solid line or a dash. Remember this for Lab #4

82
Notice the border Width property. This is where you can select how bold of a line you want.

83
Hiding Duplicate Values of a field on a Report In a report where the billing date is the same for many or all of the records you might want to display the Billing Date value only in the first record of a group, simplifying the report and making it easier to read.

84
Hiding Duplicate Values of a field on a Report Billing Dates on this report are all the same date Billing Dates on this report are all the same date

85
Hiding Duplicate Values in a Report Reference Window Hiding Duplicate Values in a Report Display the report in the design view Right click on the field whose duplicate values you want to hide and select Properties Click the right side of the Hide Duplicates text box, and then click Yes. Click the Close button on the property sheet to close it. Page AC 6.28

86
Hiding Duplicate Values of a field on a Report

87
Billing Date Duplicates are now hidden. Billing Date Duplicates are now hidden.

88
Sorting and Grouping Data in a Report Access allows you to organize the records in a report by sorting the records using one or more sort keys. Each sort key can also be a grouping field. If you specify a sort key as a grouping field, you can include a Group Header section and a Group Footer section for the group. A Group Header section will typically include the name of the group, and a Group Footer section will typically include a count or subtotal for records in that group.

89
Sorting and Grouping Data in a Report MUST It is very important to mention here, that Access reports do not use the sorting options in queries if the report is based on a query. Regardless of sorting options set in a query, your Access Report MUST have it’s own sorting options selected from the design view of the report or during the wizard process.

90
Sorting and Grouping Data in a Report Reference Window Sorting and Grouping Data in a Report In the Design view, click the Sorting & grouping Button. Click the first field/expression list arrow in the Sorting & Grouping Dialog Box and select the field to use as the primary sort key. In the Sort Order Text Box select the sort order. Page AC 6.12...

91
Sorting and Grouping Data in a Report Reference Window Sorting and Grouping Data in a Report Repeat the previous step to select secondary sorting keys and their sort orders. To group data, click the field in the Field/Expression text box by which you want to group records. In the Group Properties section, select the grouping option for the field. Page AC 6.12

92
Sorting and Grouping button The Sorting and Grouping window can be activated by clicking on the Sorting and Grouping button on the Toolbar.

93
It can also be activated by selecting View / Sorting and Grouping from the menu bar.

94
The top portion of the Sorting and Grouping window allows you to select the fields to Sort and Group on and the order in which you wish to sort.

95
The bottom portion allows you to select grouping options for each field.

96
If you select a field on the Top, such as Billing date, you can tell Access to create a group for this field by setting the Group Header or Group Footer property to Yes

97
Once a group header and or footer has been created, you can place fields in these sections from the underlying table or query or create calculated fields to calculate totals, averages, etc. for the group. AC 6.29 Page AC 6.29 discusses how to create calculated fields for group totals in these sections. Sorting and Grouping Data in a Report

98
When you print a report, anything contained in the Report Footer section appears once at the end of the report. This section is often used to display overall totals. Calculating Group and OverAll Totals

99
Before adding totals to a report, you must first add Report Header and Footer Sections to the report. Calculating Group and OverAll Totals

100
Reference Window Adding and Removing Report Header and Footer Sections Display the report in the design view Click View on the menu bar then Report Header/Footer To remove a Report Header or Footer Section, drag the bottom edge of that section up until the section area disappears. Page AC 6.36

101
Calculating Group and OverAll Totals Reference Window Adding and Removing Report Header and Footer Sections Display the report in the design view

102
Calculating Group and OverAll Totals Reference Window Adding and Removing Report Header and Footer Sections Display the report in the design view Click View on the menu bar then Report Header/Footer

103
Calculating Group and OverAll Totals Reference Window Adding and Removing Report Header and Footer Sections Display the report in the design view Click View on the menu bar then Report Header/Footer To remove a Report Header or Footer Section, drag the bottom edge of that section up until the section area disappears.

104
Reference Window Adding and Removing Report Header and Footer Sections When you remove Report Header Footer Sections, you permanently remove any objects that have been placed in the Header / Footer sections. Calculating Group and OverAll Totals

105
Reference Window Calculating Totals in a Report Display the report in the design view Click the Text Box tool on the Tool Box Click the report section that you would like your total in. (ie: Group Footer for a group total) This will create a textbox In the displayed text box, type =Sum([fieldname]) where fieldname is the name of the field to total. Page AC 6.29
 This will create a textbox In the displayed text box, type =Sum([fieldname]) where fieldname is the name of the field to total. Page AC")
106
Beginning with Access 2000 Is here

107
Conditional formatting allows you to automatically change the format of a report or form control based on the control’s value. $1,000 $2,000 $2,000

108
For example, you can change the OwedAmt field’s font style or color when its value is over $2000 and change to a different font style or color when its value is between $1500 and 2000; the defined font style or color for the control is used for all other values.

109
Conditional Formatting Reference Window Defining Conditional Formatting for a Control In the Design view, click the control to select it. Click Format on the Menu Bar then Select Conditional Formatting. Select & enter the conditions, then select the format options to be used. For a second or third conditional format click Add. Click the OK button. Page AC 6.33

110
In the “Define Conditional Formatting Dialog Box the first section is for Default Formatting. This format will be used if no conditions are met. In the “Define Conditional Formatting Dialog Box the first section is for Default Formatting. This format will be used if no conditions are met.

111
You define the conditions desired in this area.

112
As you set formats, you will see a preview here.

113
Clicking the Add Button will allow us to add additional conditions.

114
Clicking the add button will add Condition #2 section.

115
You are allowed up to three conditional formats for each control.

116
Default Format is used when no conditions are met Format changes when conditions are met.

117
Domain Aggregate Functions Page AC 6.36

118
Aggregate functions provide statistical information about sets of records (a domain). For example, you can use an aggregate function to count the number of records in a particular set of records (using criteria in the function), entire table, or to determine the average of values in a particular field.
, entire table, or to determine the average of values in a particular field..")
119
The domain aggregate functions include: DAvg Function DCount Function DLookup Function DFirst, DLast Functions DMin, DMax Functions DStDev, DStDevP Functions DSum Function DVar, DVarP Functions Page AC 6.37

120
You can use a domain function to get the value of a particular field from a specified set of records (a domain). You can use the domain functions in Visual Basic, a macro, a query expression, or a calculated control on a form or report.

121
The Domain Functions Syntax DomainFunction(expr, domain[, criteria])
![The Domain Functions Syntax DomainFunction(expr, domain[, criteria])](http://images.slideplayer.com/25/8069822/slides/slide_121.jpg "The Domain Functions Syntax DomainFunction(expr, domain[, criteria])")
122
Expr: An expression that identifies the field whose value you want to return. It can be a string expression identifying a field in a table or query, or it can be an expression that performs a calculation on data in that field. In expr, you can include the name of a field in a table, a control on a form, a constant, or a function. If expr includes a function, it can be either built- in or user-defined, but not another domain aggregate or SQL aggregate function.

123
Domain A string expression identifying the set of records that constitutes the domain. It can be a table name or a query name.

124
Criteria An optional string expression used to restrict the range of data on which the Domain function is performed. For example, criteria is often equivalent to the WHERE clause in an SQL expression, without the word WHERE. If criteria is omitted, the Domain function evaluates expr against the entire domain. Any field that is included in criteria must also be a field in domain; otherwise, the Domain function returns a Null.

125
The DLookup Function You can use the DLookup function to display the value of a field that isn't in the record source for your form or report. For example, suppose you have a form based on an Order Details table. The form displays the OrderID, ProductID, UnitPrice, Quantity, and Discount fields.

126
The DLookup Function However, the ProductName field is in another table, the Products table. You could use the DLookup function in a calculated control to display the ProductName on the same form.

127
Let’s look at an example of a Dlookup function used in a calculated field on a form.

128
Assume that we have created an unbound TextBox on this form.

129
The name of the textbox really is not important for our needs this evening, but the Control Source is vital.

130
An expression is typed in the Control Source Property. =DLookUp("[Company Name]",”Z_Customers","[CustomerID]=[Forms]![Or der Data New]![CustomerID]")
.")
131
Viewing this form in the “Form View” and paging down through a few records we will see the Customer name change as the Customer Number changes. The refresh time might be a little slow, depending upon the speed of your computer.

132
We will not be able to modify the data contained in the field since it is a calculated field.

133
The DSum Function You can use the DSum function to calculate the sum of a set of values in a specified set of records (a domain). Use the DSum function in Visual Basic, a macro, a query expression, or a calculated control.

134
The DSum Function For example, you could use the DSum function in a calculated field expression in a query to calculate the total sales made by a particular employee over a period of time. Or you could use the DSum function in a calculated control to display a running sum of sales for a particular product.

135
The DSum Function An example of the Dsum function being used in an expression for the control source of a text box on a form would look something like this. =DSum("[Quantity]*[UnitPrice]","Order Details","[OrderID]=[Forms]![Order data New]![OrderID]")
.")
136
The DSum Function Remember, this is showing us just the sum of orders for the customer being viewed, not the entire table.

137
=DSum("[Quantity]*[UnitPrice]","Z_Order Details", "[OrderID]=[Forms]![Order data New]![OrderID]") =DSum("[Quantity]*[UnitPrice]","Z_Order Details", "[OrderID]=[Forms]![Order data New]![OrderID]") The DSum Function This is because we have included a criteria in our DSum Expression.
![=DSum( [Quantity]*[UnitPrice] , Z_Order Details , [OrderID]=[Forms]![Order data New]![OrderID] ) =DSum( [Quantity]*[UnitPrice] , Z_Order Details , [OrderID]=[Forms]![Order data New]![OrderID] ) The DSum Function This is because we have included a criteria in our DSum Expression.](http://images.slideplayer.com/25/8069822/slides/slide_137.jpg "=DSum( [Quantity]*[UnitPrice] , Z_Order Details , [OrderID]=[Forms]![Order data New]![OrderID] ) =DSum( [Quantity]*[UnitPrice] , Z_Order Details , [OrderID]=[Forms]![Order data New]![OrderID] ) The DSum Function This is because we have included a criteria in our DSum Expression.")
138
The DCount Function You can use the DCount function to determine the number of records that are in a specified set of records (a domain). Use the DCount function in Visual Basic, a macro, a query expression, or a calculated control.

139
The DCount Function For example, you could use the DCount function in a module to return the number of records in an Orders table that correspond to orders placed on a particular date.

140
You can use the DMin and DMax functions to determine the minimum and maximum values in a specified set of records (a domain). Use the DMin and DMax functions in Visual Basic, a macro, a query expression, or a calculated control. The Dmin & Dmax Functions

141
For example, you could use the DMin and DMax functions in calculated controls on a report to display the largest and smallest order amounts for a particular customer. Or you could use the DMin function in a query expression to display all orders with a discount greater than the minimum possible discount. The Dmin & Dmax Functions

142
Customizing Reports SESSION 6.3 This section covers inserting dates, page numbers in reports, running sums of fields, more on report sections, report titles, some cool printing options and mailing lists.

143
Adding a Date to a Report

144
Reference Window Adding a Date to a Report Display the report in the design view Click the Text Box Tool on the ToolBox Position the Pointer where you want the date to appear and then click to place the text box in the report. Click the text box and then type : =Date() and then press the Enter Key Page AC 6.41
 and then press the Enter Key Page AC")
145
There are two ways to add a date to a report. A second way is to click on Insert on the menu bar and select Date/Time...

146
There are two ways to add a date to a report. The Insert Date/Time Dialog box will appear giving you several options for your Date and or Time field.

147
Adding a Page # to a Report

148
Adding Page Numbers to a Report Reference Window Adding Page Numbers to a Report Display the Report in the Design view Click the Text Box tool on the toolbox Position the pointer where you want the Page # to appear Click to place the text box in the report. Click the textbox to activate it, type =[Page] and then press the Enter key. Page AC 6.43

149
There are two ways to add a Page # to a report. A second way is to click on Insert on the menu bar and select Page Numbers...

150
There are two ways to add a date to a report. The Insert Page Number Dialog box will appear giving you several options for your Page Number field.

151
Running Sum of a field Another handy tool that can be of value many times is the ability to accumulate numbers automatically.

152
Running Sum of a field This can be used for a number count as shown here, or accumulating totals or balances such as in a check register.

153
Running Sum of a Field Reference Window Running Sum of a Field Display the report in the design view Right click on the field & select Properties Find the Running Sum Property Select from the available options of No Over Group Over All

154
Running Sum of a Field To create a sequentially numbered list on a report: 1st create an unbound field on the report

155
Running Sum of a Field To create a sequentially numbered list on a report: Then right click on the new field and select properties

156
Running Sum of a Field To create a sequentially numbered list on a report: In the Control Source Property type =1 =1

157
Running Sum of a Field To create a sequentially numbered list on a report: In the Running Sum Property type Over All or Over Group Over All or Over Group

158
Running Sum of a Field To create a sequentially numbered list on a report: If you are using groups and you select Over Group, the numbering will re-start at the beginning of each group. Over All or Over Group

159
Running Sum of a Field To create a sequentially numbered list on a report: If you select Over All, the numbering will start at 1 and number sequentially to the last record of the report. Over All or Over Group

160
Running Sum of a field Previewing the report, you will see your sequential numbering for each record.

161
You should also be aware of how to set up and adjust your printer setup for things like paper size and margins. Remember this for Lab #4

162
At times you will notice that you get either an extra blank sheet of paper following each page, or as shown here, parts of your report will appear on a second page.

163
There are several factors that can cause this problem, yet most of the time it is an easy problem to correct.

164
First, in the design view of the report, check the report width. Remember, a sheet of paper is generally 8 1/2 inches wide. If your report exceeds this then you will get that extra page. To correct this, simply adjust the width of the report in the design view.

165
If adjusting the width of the report doesn’t work, you should then check the margins and layout of the report in Page Setup.

166
The margins can be easily adjusted in the margins tab of the page set up window.

167
If the data on your report requires 8” then your Left and Right margins in total can not exceed 1/2”.

168
You can also change the orientation of the report from Portrait to Landscape or use a different size sheet of paper, such as 8 1/2 by 14 on the Page Tab in the Page Setup window.

169
Finally, you might want to consider using 2 or more columns on your report, although this usually won’t fix that extra page problem. This can be set up from the Columns tab in the Page Setup window.

170
As mentioned earlier, reports are generally used for hard copy output to a printer. In addition to printing your report to a printer, there are several other ways to output a report

171
If you would like to create a formatted Microsoft Word document from your report, while in the preview mode of the report, click on your Office Links button on your tool bar and select Publish It with MS Word.

172
This will send your report to a “.rtf” file on your local hard drive and open up the new document in Word.

173
There is one disadvantage to this. Access will not send any graphics that might be on your report to the Word file.

174
If you have the full version of Adobe Acrobat however, (not Acrobat Reader) you can print your report to a PDF file which can be viewed with either Acrobat or Acrobat Reader or any other program that recognizes a PDF type file.
 you can print your report to a PDF file which can be viewed with either Acrobat or Acrobat Reader or any other program that recognizes a PDF type file.")
175
From the report’s preview mode, after you have selected File and Print, Select Acrobat PDFWriter as your printer.

176
You will then be asked to name your PDF file and where to put it.

177
Access will then print your formatted report, including graphics to your hard drive and you will then be able to open it with Acrobat Reader or email it as an attachment.

178
The same method can be used if you would like to fax your report and have a fax modem with fax software installed on your computer. In this case, from your print dialog window, select your fax driver that was installed with your fax software as your printer, and Access will then launch your fax program with the report ready to send as a fax.

179
One last cool thing you can do with your report is to export it to an html file that is readable in any browser. To do this, from the database window, select the report by left clicking one time on it, and then select “File” from the menu bar and “Export”.

180
When the Export Report “your filename” As window appears, Select the Save in: location at the top of the window, and then change the Save as type: to HTML Documents as shown below. Finally, click the Save button and Access will save the report in HTML format to your hard drive.

181
Creating Mailing Labels using a wizard One of the “Related Tasks” that we talked about in Class #1 when we were discussing the Task Sheet was Mailing Labels. As a mater of fact, we actually created a “Mailing List for Coupons” table in the last lab. Here is where we can put this table to good use!

182
Now we really have our vet friend’s attention! Labels?

183
To create labels, start at the database window, left click on the Reports object tab, and then left click on the New command button.

184
From the New Report dialog box, select Label Wizard, select the table or query you wish to use for your labels and then OK.

185
Select the manufacture, label type, Unit of Measure and the label product number that corresponds with the manufacturer.

186
Access has many manufactures built in to the program, and has several label product number templates for each manufacture.

187
The next screen will ask us for the font specifications that we would like for the text on our label.

188
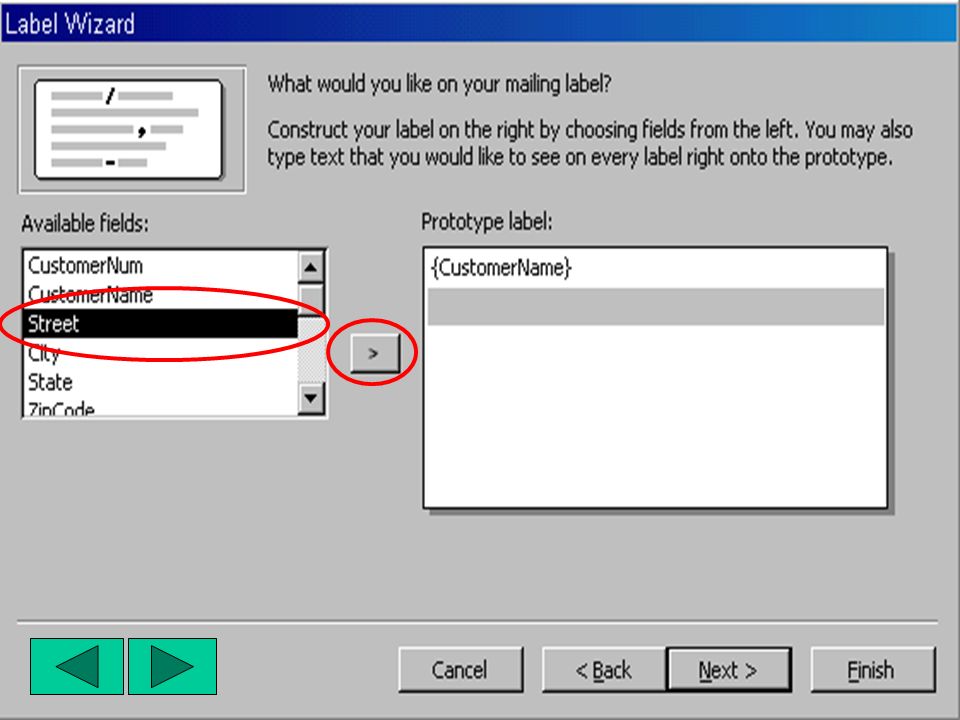
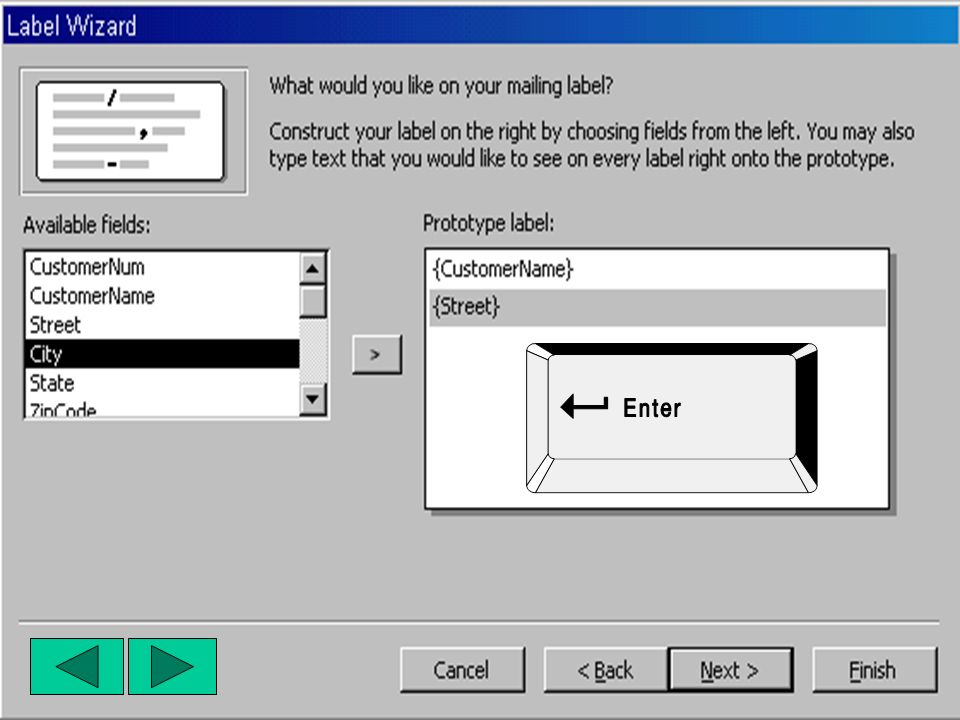
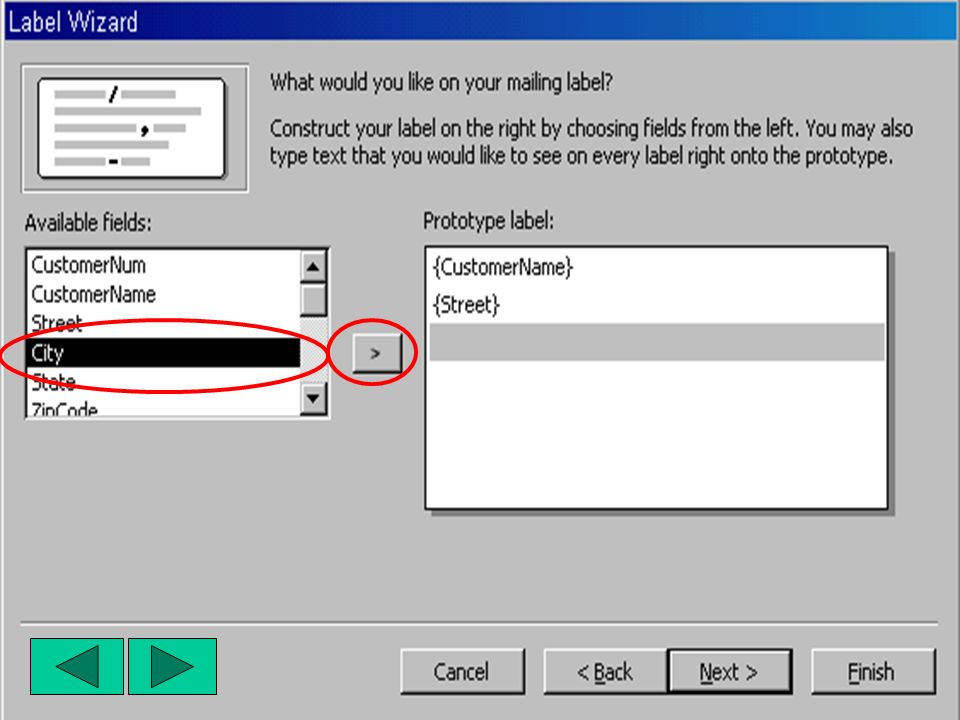
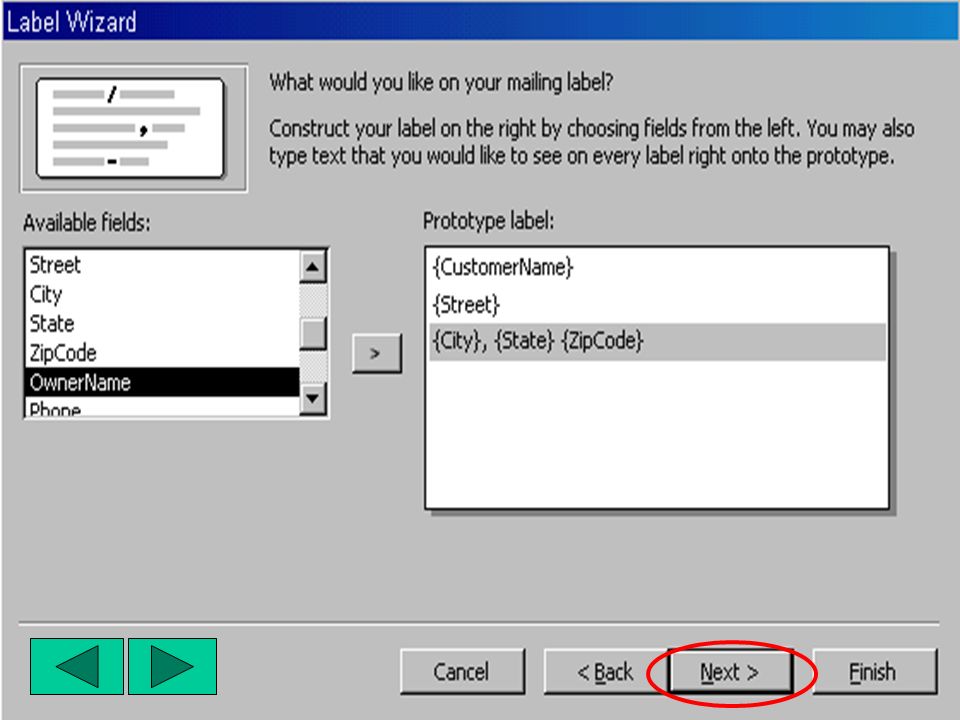
And then the fun begins, adding the fields that we want on the label.

193
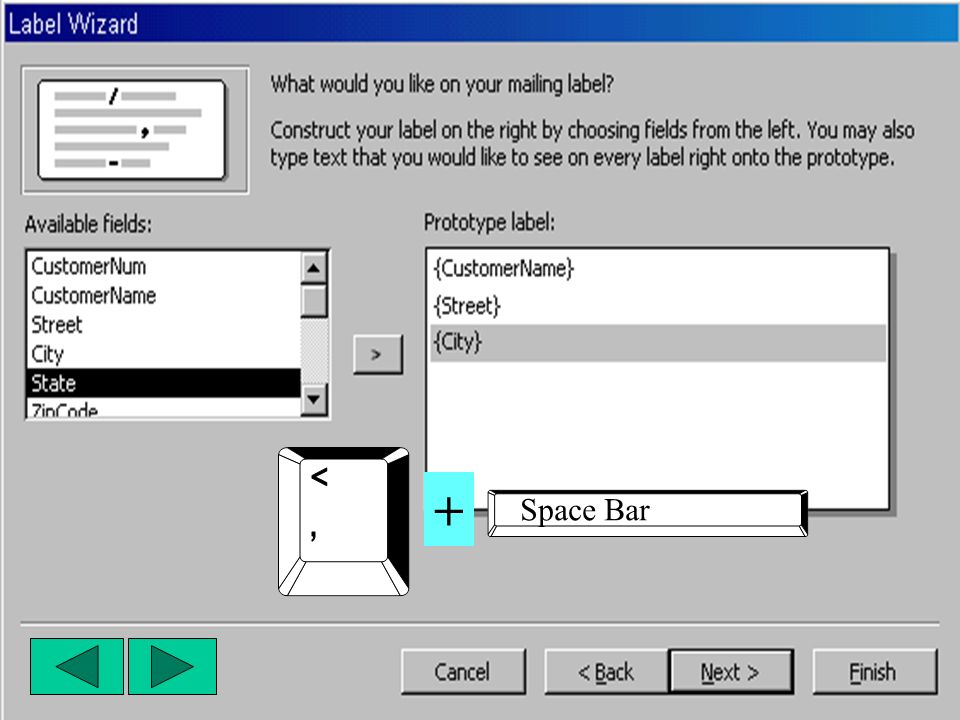
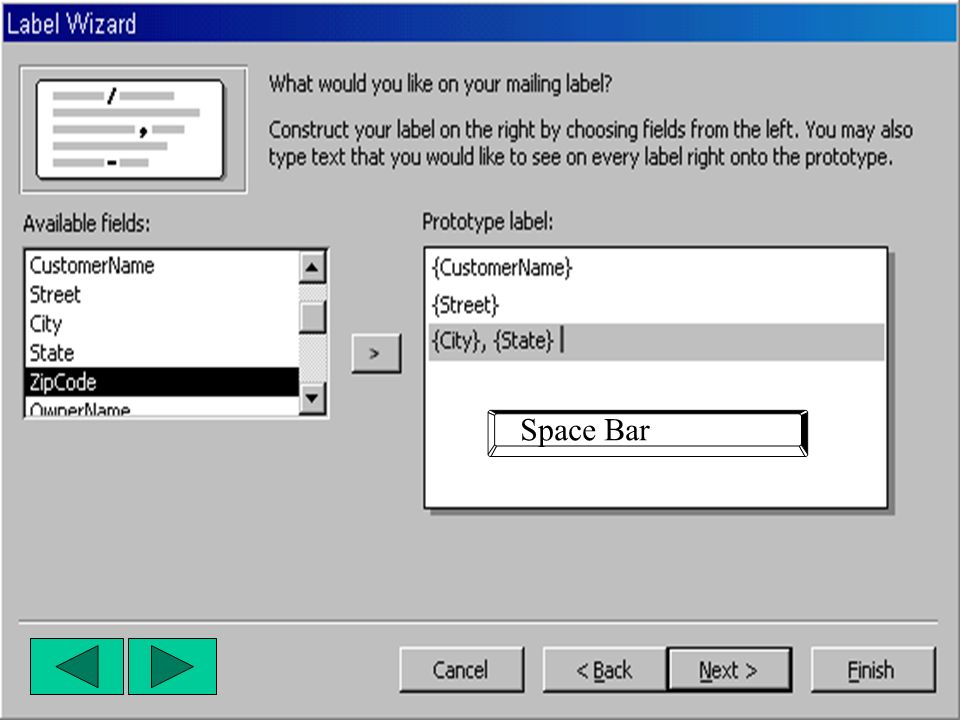
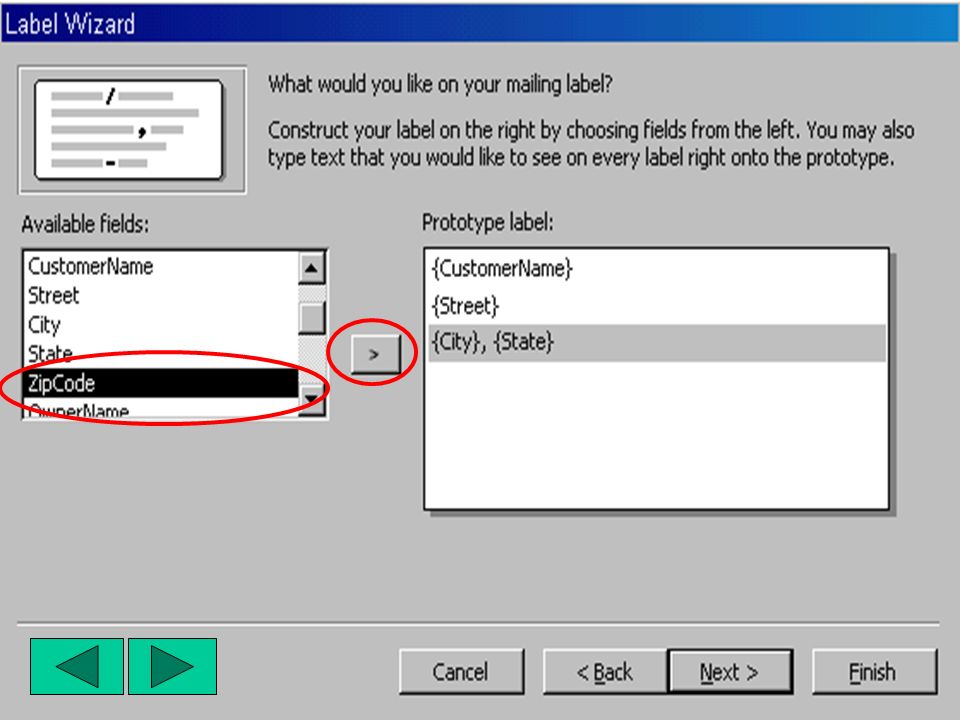
Space Bar +

198
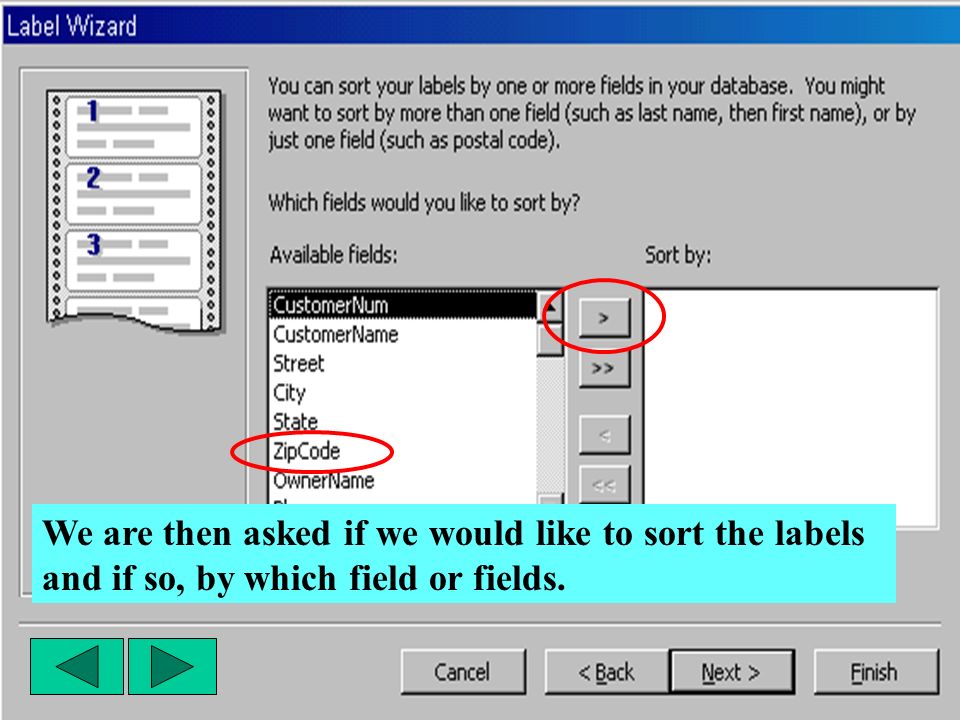
We are then asked if we would like to sort the labels and if so, by which field or fields.

199
Clicking the Next button will bring us to the Wizard’s final step.

200
We can now keep the Name that Access assigned to the label object or give it our own name. We can then select to see the labels in preview mode, or go to the design mode for more changes. And then click on the Finish button to complete the process.

201
If we selected to go directly to the preview mode in the last step, we will see the labels as they would look when printed.

202
If we selected to go to the design view in the last step, we will see the label report in the design view and are ready to make modifications.

203
Quick Check Review A special note for the on-line students: The following Quick Check Review questions are only for your benefit. They are not required for the course but here to give you a chance to test your knowledge. Click the arrow button below to skip these questions and go directly to the class project for this class.

204
Page AC 6.21 Page AC 6.40 Page AC 6.57 Quick Check Review

205
Let’s take a few moments to break up into discussion groups. Each group will discuss the quick check questions on page AC 6.21, AC 6.40 and AC 6.57 in your books. We will then review the answers at the end of the discussion.

206
Quick Check Review Session 6.1 1) Describe the seven sections in an Access report.
 Describe the seven sections in an Access report.")
207
Quick Check Review Session 6.1 2) What is a custom report?
 What is a custom report")
208
Quick Check Review Session 6.1 3) The ________ function lets you assign one value to a calculated field if a condition is true and a second value if the condition is false.
 The ________ function lets you assign one value to a calculated field if a condition is true and a second value if the condition is false.")
209
Quick Check Review Session 6.1 4) What does the Report window in Design view have in common with the Form window in Design view? How does it differ?

210
Quick Check Review Session 6.1 5) What is a grouping field?
 What is a grouping field")
211
Quick Check Review Session 6.1 6) What is the Caption property for a control, and when would you change it?
 What is the Caption property for a control, and when would you change it")
212
Quick Check Review Session 6.1 7) The ________ property, when set to Yes, expands a text box vertically to fit the field value when a report is printed.
 The ________ property, when set to Yes, expands a text box vertically to fit the field value when a report is printed.")
213
Quick Check Review Session 6.1 8) How do you right-align controls in a column?
 How do you right-align controls in a column")
214
Quick Check Review Session 6.2 1) The ______ property, when set to Yes, reduces the height of a control that contains no data to eliminate blank lines from the printed report.
 The ______ property, when set to Yes, reduces the height of a control that contains no data to eliminate blank lines from the printed report.")
215
Quick Check Review Session 6.2 2) When you use Control Wizards to create a subreport, which non-empty sections does the wizard create automatically?
 When you use Control Wizards to create a subreport, which non-empty sections does the wizard create automatically")
216
Quick Check Review Session 6.2 3) You use the ________ property to show or hide a control.
 You use the ________ property to show or hide a control.")
217
Quick Check Review Session 6.2 4) To make small adjustments in the placement of a selected line, hold down the Ctrl key, and press a(n) _________ key.
 To make small adjustments in the placement of a selected line, hold down the Ctrl key, and press a(n) _________ key.")
218
Quick Check Review Session 6.2 5) Why might you want to hide duplicate values in a report?
 Why might you want to hide duplicate values in a report")
219
Quick Check Review Session 6.2 6) What is the maximum number of conditional formats you can define for a control?
 What is the maximum number of conditional formats you can define for a control")
220
Quick Check Review Session 6.2 7) What is a domain?
 What is a domain")
221
Quick Check Review Session 6.3 1) What do you type in a text box control to print the current date?
 What do you type in a text box control to print the current date")
222
Quick Check Review Session 6.3 2) How do you insert a page number in the Page Header section?
 How do you insert a page number in the Page Header section")
223
Quick Check Review Session 6.3 3) You can use the _________ to copy the format of a control to other controls.
 You can use the _________ to copy the format of a control to other controls.")
224
Quick Check Review Session 6.3 4) The Keep Together property prints a group header on a page only if there is enough room on the page to print the first _________ record for the group.
 The Keep Together property prints a group header on a page only if there is enough room on the page to print the first _________ record for the group.")
225
Quick Check Review Session 6.3 5) What is a multiple-column report?
 What is a multiple-column report")
226
To be posted on our class discussion board. In your own words give an example of how you might use the grouping feature on a report and an example of how you might use conditional formatting. Class Discussion Topic ITEC2404

227
AC 6.01AC 6.40 Your task today is to complete the exercises in Tutorial #6 Page AC 6.01 through Page AC 6.40 The disk is Level 2 Disk 1 Jobs.mdb The disk is Level 2 Disk 1 Jobs.mdb

Similar presentations

. The Major Steps of a MicroSoft Access Database Tables Queries Forms Macros Reports Modules On our road.>")


