Download presentation
Presentation is loading. Please wait.

1
Moving from Correlative Studies to Predictive Medicine Richard Simon, D.Sc. Chief, Biometric Research Branch National Cancer Institute http://linus.nci.nih.gov/brb

2
BRB Website brb.nci.nih.gov Powerpoint presentations and audio files Reprints & Technical Reports BRB-ArrayTools software BRB-ArrayTools Data Archive –100+ published cancer gene expression datasets with clinical annotations Sample Size Planning for Targeted Clinical Trials

3
Objectives of Phase I Trials Develop dose/schedule Determine whether the drug inhibits the targeted pathway

4
Dose/Schedule Ideal is to have a drug and target so specific for cancer cells that the drug can be delivered repeatedly at doses that completely shut down the de-regulated pathway without toxicity to normal cells Because most current targets are not specific to cancer cells, most targeted drugs are toxic

5
Dose/Schedule Few examples of drugs whose effectiveness at inhibiting target decreases with dose after maximum Titrating dose for maximum inhibition of target is difficult due to assay variability and need for tumor biopsies Titrating dose to plasma concentration at which target is inhibited in pre-clinical systems is more feasible

6
Dose/Schedule Determining dose just below MTD which can be delivered repeatedly is often the most appropriate and practical approach Accrue an additional cohort of patients at that selected dose to determine whether the target is inhibited

7
Objectives of Phase II Trials of Targeted Agents Determine whether there is a population of patients for whom the drug demonstrates sufficient anti-tumor activity to warrant a phase III trial Optimize the regimen in which the drug will be used in the phase III trial Optimize the target population for the phase III trial

8
Traditional Phase II Trials Estimate the proportion of tumors that shrink by 50% or more when the drug is administered either singly or in combination to patients with advanced stage tumors of a specific primary site

9
Using Time to Progression as Endpoint in Phase II Trials Requires comparison to distribution of progression times for patients not receiving drug Proportion of patients without progression at a specified time also requires comparison for evaluation Historical control vs randomized comparison Phase 2.5 trial design

10
Phase 2.5 Trial Design Simon R et al. Clinical trial designs for the early clinical development of therapeutic cancer vaccines. Journal of Clinical Oncology 19:1848-54, 2001 Korn EL et al. Clinical trial designs for cytostatic agents: Are new approaches needed? Journal of Clinical Oncology 19:265-272, 2001

11
Phase 2.5 Trial Design Randomization to chemotherapy alone or with new drug Endpoint is progression free survival regardless of whether it is a validated surrogate of survival One-sided significance level can exceed.05 for analysis and sample size planning

12
Total Sample Size Randomized Phase 2.5 2 years accrual, 1.5 years followup Improvement in median PFS Hazard Ratio =.05 =.10 =.20 4 → 6 months1.5216168116 6 → 9 months1.5228176120 4 → 8 months2766040 6→12 months2846444

13
Randomized Discontinuation Design (RDD) The RDD starts all patients on the drug Patients with early progression go off study Patients with objective response continue on the drug Other patients are randomized to continue the drug or stop administration and be observed PFS from time of randomization is the endpoint
 The RDD starts all patients on the drug Patients with early progression go off study Patients with objective response continue on the drug Other patients are randomized to continue the drug or stop administration and be observed PFS from time of randomization is the endpoint")
14
Randomized Discontinuation Design (RDD) The RDD can facilitate observing an effect of the drug on PFS compared to a standard randomized phase 2 design –when many patients have tumors that are insensitive to the drug and rapidly progressive –The RDD generally requires a large total sample size –The RDD is not a phase III trial because it does not establish the clinical utility of administering the drug to the patient compared to not administering it
 The RDD can facilitate observing an effect of the drug on PFS compared to a standard randomized phase 2 design –when many patients have tumors that are insensitive to the drug and rapidly progressive –The RDD generally requires a large total sample size –The RDD is not a phase III trial because it does not establish the clinical utility of administering the drug to the patient compared to not administering it")
19
Kinds of Biomarkers Surrogate endpoint –Pre & post rx, early measure of clinical outcome Pharmacodynamic –Pre & post rx, measures an effect of rx on disease Prognostic –Which patients need rx Predictive –Which patients are likely to benefit from a specific rx Product characterization

20
Surrogate Endpoints It is extremely difficult to properly validate a biomarker as a surrogate for clinical outcome. It requires a series of randomized trials with both the candidate biomarker and clinical outcome measured

21
Cardiac Arrhythmia Supression Trial Ventricular premature beats was proposed as a surrogate for survival Antiarrythmic drugs supressed ventricular premature beats but killed patients at approximately 2.5 times that of placebo

22
Biomarkers for use as endpoints in phase I or II studies need not be validated as surrogates for clinical outcome –Phase I and II studies should not change practice Unvalidated biomarkers can be used for early “futility analyses” in phase III trials

23
Pusztai et al. The Oncologist 8:252-8, 2003 939 articles on “prognostic markers” or “prognostic factors” in breast cancer in past 20 years ASCO guidelines only recommend routine testing for ER, PR and HER-2 in breast cancer “With the exception of ER or progesterone receptor expression and HER-2 gene amplification, there are no clinically useful molecular predictors of response to any form of anticancer therapy.”

24
Prognostic Markers Most prognostic factors are not used because they are not therapeutically relevant Most prognostic factor studies are poorly designed and not focused on a clear objective; they use a convenience sample of patients for whom tissue is available. Generally the patients are too heterogeneous to support therapeutically relevant conclusions

25
Prognostic Biomarkers Can be Therapeutically Relevant 3-5% of node negative ER+ breast cancer patients require or benefit from systemic rx other than endocrine rx Prognostic biomarker development should focus on specific therapeutic decision context

26
Key Features of OncotypeDx Development Identification of important therapeutic decision context Prognostic marker development was based on patients with node negative ER positive breast cancer receiving tamoxifen as only systemic treatment –Use of patients in NSABP clinical trials Staged development and validation –Separation of data used for test development from data used for test validation Development of robust assay with rigorous analytical validation –21 gene RTPCR assay for FFPE tissue –Quality assurance by single reference laboratory operation

27
Predictive Biomarkers In the past often studied as un-focused post-hoc subset analyses of RCTs. –Numerous subsets examined –Same data used to define subsets for analysis and for comparing treatments within subsets –No control of type I error Led to conventional wisdom –Only hypothesis generation –Only valid if overall treatment difference is significant

28
Cancers of a primary site are often a heterogeneous grouping of diverse molecular diseases The molecular diseases vary enormously in their responsiveness to a given treatment It is feasible (but difficult) to develop prognostic markers that identify which patients need systemic treatment and which have tumors likely to respond to a given treatment –e.g. breast cancer and ER/PR, Her2

29
The standard approach to designing phase III clinical trials is based on three assumptions Qualitative treatment by subset interactions are unlikely “Costs” of over-treatment are less than “costs” of under-treatment It is not feasible to reliably evaluate treatments for subsets

30
Qualitative treatment by subset interactions are unlikely –Biology has shown that this is often false “Costs” of over-treatment are less than “costs” of under-treatment –With today’s drugs this is economically unsustainable It is not feasible to reliably evaluate treatments for subsets –With molecularly targeted treatment, and prospectively defined candidate subsets, this is feasible

31
Standard Clinical Trial Approaches Have led to widespread over-treatment of patients with drugs to which few benefit Possible failure to appreciate the effectiveness of some drugs in biologically restricted target populations

32
This is not a plea for acceptance of the typical unreliable post-hoc data dredging approach to subset analysis Subset analysis does not have to be about post-hoc comparing treatments in numerous subsets with no control of overall type I error

34
The Roadmap 1.Develop a completely specified genomic classifier of the patients likely to benefit from a new drug 2.Establish analytical and pre-analytical validity of the classifier 3.Use the completely specified classifier to design and analyze a new clinical trial to evaluate effectiveness of the new treatment with a pre-defined analysis plan that preserves the overall type-I error of the study.

35
Guiding Principle The data used to develop the classifier must be distinct from the data used to test hypotheses about treatment effect in subsets determined by the classifier –Developmental studies are exploratory –Studies on which treatment effectiveness claims are to be based should be definitive studies that test a treatment hypothesis in a patient population completely pre-specified by the classifier

36
New Drug Developmental Strategy I Restrict entry to the phase III trial based on the binary predictive classifier, i.e. targeted design

37
Using phase II data, develop predictor of response to new drug Develop Predictor of Response to New Drug Patient Predicted Responsive New Drug Control Patient Predicted Non-Responsive Off Study

38
Applicability of Design I Primarily for settings where the classifier is based on a single gene whose protein product is the target of the drug –eg trastuzumab With a strong biological basis for the classifier, it may be unacceptable to expose classifier negative patients to the new drug Analytical validation, biological rationale and phase II data provide basis for regulatory approval of the test Phase III study focused on test + patients to provide data for approving the drug

39
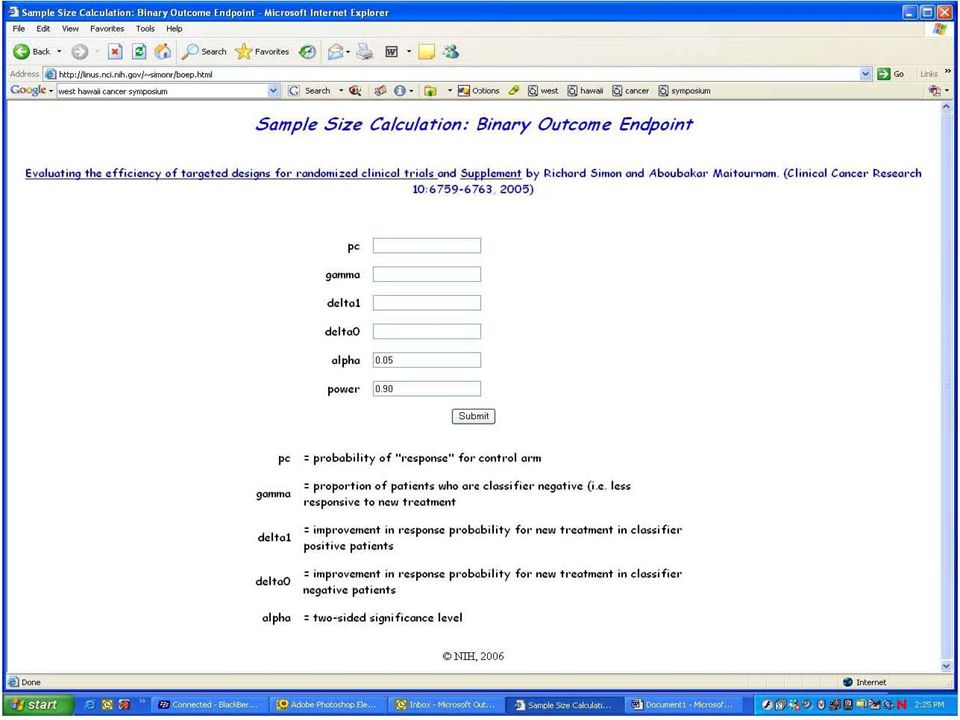
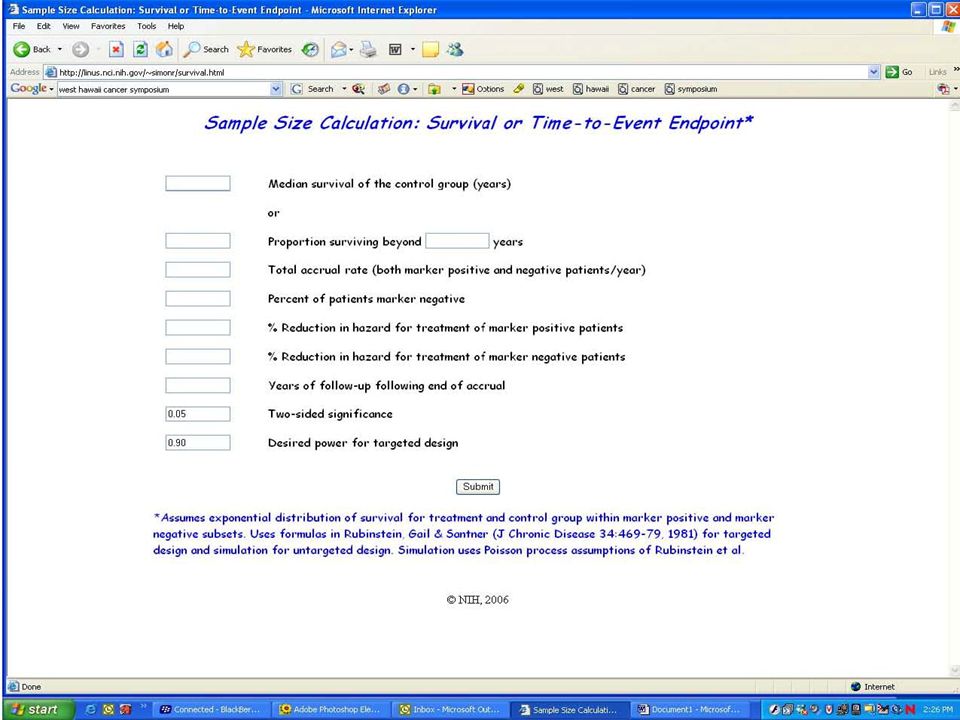
Evaluating the Efficiency of Strategy (I) Simon R and Maitnourim A. Evaluating the efficiency of targeted designs for randomized clinical trials. Clinical Cancer Research 10:6759-63, 2004; Correction and supplement 12:3229, 2006 Maitnourim A and Simon R. On the efficiency of targeted clinical trials. Statistics in Medicine 24:329-339, 2005. reprints and interactive sample size calculations at http://linus.nci.nih.gov

40
Relative efficiency of targeted design depends on –proportion of patients test positive –effectiveness of new drug (compared to control) for test negative patients When less than half of patients are test positive and the drug has little or no benefit for test negative patients, the targeted design requires dramatically fewer randomized patients The targeted design may require fewer or more screened patients than the standard design
 for test negative patients When less than half of patients are test positive and the drug has little or no benefit for test negative patients, the targeted design requires dramatically fewer randomized patients The targeted design may require fewer or more screened patients than the standard design")
41
No treatment Benefit for Assay - Patients n std / n targeted Proportion Assay Positive RandomizedScreened 0.751.781.33 0.542 0.25164

42
Treatment Benefit for Assay – Pts Half that of Assay + Pts n std / n targeted Proportion Assay Positive RandomizedScreened 0.751.310.98 0.51.780.89 0.252.560.64

43
Treatment Hazard Ratio for Marker Positive Patients Number of Events for Targeted Design Number of Events for Traditional Design Percent of Patients Marker Positive 20%33%50% 0.5742040720316 Comparison of Targeted to Untargeted Design Simon R, Development and Validation of Biomarker Classifiers for Treatment Selection, JSPI

44
Trastuzumab Herceptin Metastatic breast cancer 234 randomized patients per arm 90% power for 13.5% improvement in 1-year survival over 67% baseline at 2-sided.05 level If benefit were limited to the 25% assay + patients, overall improvement in survival would have been 3.375% –4025 patients/arm would have been required

45
Web Based Software for Comparing Sample Size Requirements http://linus.nci.nih.gov/brb/

50
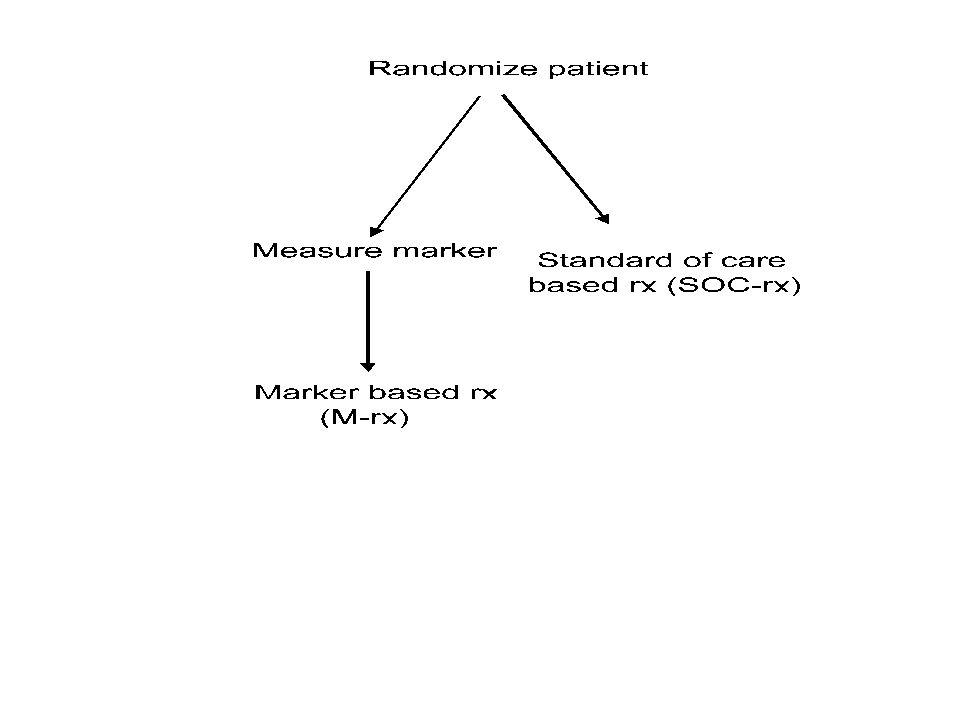
Developmental Strategy (II) Develop Predictor of Response to New Rx Predicted Non- responsive to New Rx Predicted Responsive To New Rx Control New RXControl New RX
 Develop Predictor of Response to New Rx Predicted Non- responsive to New Rx Predicted Responsive To New Rx Control New RXControl New RX")
51
Developmental Strategy (II) Do not use the diagnostic to restrict eligibility, but to structure a prospective analysis plan Having a prospective analysis plan is essential “Stratifying” (balancing) the randomization is useful to ensure that all randomized patients have tissue available but is not a substitute for a prospective analysis plan The purpose of the study is to evaluate the new treatment overall and for the pre-defined subsets; not to modify or refine the classifier The purpose is not to demonstrate that repeating the classifier development process on independent data results in the same classifier
 Do not use the diagnostic to restrict eligibility, but to structure a prospective analysis plan Having a prospective analysis plan is essential Stratifying (balancing) the randomization is useful to ensure that all randomized patients have tissue available but is not a substitute for a prospective analysis plan The purpose of the study is to evaluate the new treatment overall and for the pre-defined subsets; not to modify or refine the classifier The purpose is not to demonstrate that repeating the classifier development process on independent data results in the same classifier")
52
The Roadmap 1.Develop a completely specified genomic classifier of the patients likely to benefit from a new medical product 2.Establish reproducibility of measurement of the classifier 3.Use the completely specified classifier to design and analyze a new clinical trial to evaluate effectiveness of the new treatment with a pre-defined analysis plan.

53
Development of Classifier Establish reproducibility of measurement Establish clinical utility of medical Product with classifier

54
Guiding Principle The data used to develop the classifier must be distinct from the data used to test hypotheses about treatment effect in subsets determined by the classifier –Developmental studies are exploratory –Studies on which treatment effectiveness claims are to be based should be definitive studies that test a treatment hypothesis in a patient population completely pre-specified by the classifier

55
Validation of EGFR biomarkers for selection of EGFR-TK inhibitor therapy for previously treated NSCLC patients 2 nd line NSCLC with specimen FISH Testing FISH + (~ 30%) FISH − (~ 70%) Erlotinib Pemetrexed Erlotinib Pemetrexed Outcome 1° PFS 2° OS, ORR PFS endpoint –90% power to detect 50% PFS improvement in FISH+ –90% power to detect 30% PFS improvement in FISH− Evaluate EGFR IHC and mutations as predictive markers Evaluate the role of RAS mutation as a negative predictive marker 957 patients 4 years accrual, 1196 patients 1-2 years minimum additional follow-up
 FISH − (~ 70%) Erlotinib Pemetrexed Erlotinib Pemetrexed Outcome 1° PFS 2° OS, ORR PFS endpoint –90% power to detect 50% PFS improvement in FISH+ –90% power to detect 30% PFS improvement in FISH− Evaluate EGFR IHC and mutations as predictive markers Evaluate the role of RAS mutation as a negative predictive marker 957 patients 4 years accrual, 1196 patients 1-2 years minimum additional follow-up")
56
Analysis Plan B (Limited confidence in test) Compare the new drug to the control overall for all patients ignoring the classifier. –If p overall 0.03 claim effectiveness for the eligible population as a whole Otherwise perform a single subset analysis evaluating the new drug in the classifier + patients –If p subset 0.02 claim effectiveness for the classifier + patients.

57
This analysis strategy is designed to not penalize sponsors for having developed a classifier It provides sponsors with an incentive to develop genomic classifiers

58
Analysis Plan C (adaptive) Test for difference (interaction) between treatment effect in test positive patients and treatment effect in test negative patients If interaction is significant at level int then compare treatments separately for test positive patients and test negative patients Otherwise, compare treatments overall
 Test for difference (interaction) between treatment effect in test positive patients and treatment effect in test negative patients If interaction is significant at level int then compare treatments separately for test positive patients and test negative patients Otherwise, compare treatments overall")
59
Sample Size Planning for Analysis Plan C 88 events in test + patients needed to detect 50% reduction in hazard at 5% two- sided significance level with 90% power If 25% of patients are positive, when there are 88 events in positive patients there will be about 264 events in negative patients –264 events provides 90% power for detecting 33% reduction in hazard at 5% two-sided significance level

60
Simulation Results for Analysis Plan C Using int =0.10, the interaction test has power 93.7% when there is a 50% reduction in hazard in test positive patients and no treatment effect in test negative patients A significant interaction and significant treatment effect in test positive patients is obtained in 88% of cases under the above conditions If the treatment reduces hazard by 33% uniformly, the interaction test is negative and the overall test is significant in 87% of cases

61
Development of Genomic Classifiers Single gene or protein based on knowledge of therapeutic target Empirically determined based on evaluation of a set of candidate genes Empirically determined based on genome- wide correlating gene expression, copy number variation or genotype to patient outcome after treatment

62
Development of Genomic Classifiers During phase II development or After failed phase III trial using archived specimens. Adaptively during early portion of phase III trial.

64
Biomarker Adaptive Threshold Design Wenyu Jiang, Boris Freidlin & Richard Simon JNCI 99:1036-43, 2007

65
Biomarker Adaptive Threshold Design Randomized phase III trial comparing new treatment E to control C Survival or DFS endpoint

66
Biomarker Adaptive Threshold Design Have identified a predictive index B thought to be predictive of patients likely to benefit from E relative to C Eligibility not restricted by biomarker No threshold for biomarker determined

67
Analysis Plan S(b)=log likelihood ratio statistic for treatment versus control comparison in subset of patients with B b Compute S(b) for all possible threshold values Determine T=max{S(b)} Compute null distribution of T by permuting treatment labels –Permute the labels of which patients are in which treatment group –Re-analyze to determine T for permuted data –Repeat for 10,000 permutations
=log likelihood ratio statistic for treatment versus control comparison in subset of patients with B b Compute S(b) for all possible threshold values Determine T=max{S(b)} Compute null distribution of T by permuting treatment labels –Permute the labels of which patients are in which treatment group –Re-analyze to determine T for permuted data –Repeat for 10,000 permutations")
68
If the data value of T is significant at 0.05 level using the permutation null distribution of T, then reject null hypothesis that E is ineffective Compute point and bootstrap confidence interval estimates of the threshold b

70
ModelHazard reduction for those who benefit Overall Power Adaptive Test Everyone benefits 33%.775.751 50% benefit 60%.888.932 25% benefit 60%.429.604

71
Adaptive Biomarker Threshold Design Sample size planning methods described by Jiang, Freidlin and Simon, JNCI 99:1036-43, 2007

72
Adaptive Signature Design An adaptive design for generating and prospectively testing a gene expression signature for sensitive patients Boris Freidlin and Richard Simon Clinical Cancer Research 11:7872-8, 2005

73
Adaptive Signature Design End of Trial Analysis Compare E to C for all patients at significance level 0.03 –If overall H 0 is rejected, then claim effectiveness of E for eligible patients –Otherwise

74
Otherwise: –Using only the first half of patients accrued during the trial, develop a binary classifier that predicts the subset of patients most likely to benefit from the new treatment E compared to control C –Compare E to C for patients accrued in second stage who are predicted responsive to E based on classifier Perform test at significance level 0.02 If H 0 is rejected, claim effectiveness of E for subset defined by classifier

75
Treatment effect restricted to subset. 10% of patients sensitive, 10 sensitivity genes, 10,000 genes, 400 patients. TestPower Overall.05 level test46.7 Overall.04 level test43.1 Sensitive subset.01 level test (performed only when overall.04 level test is negative) 42.2 Overall adaptive signature design85.3
 42.2 Overall adaptive signature design85.3.")
76
Overall treatment effect, no subset effect. 10% of patients sensitive, 10 sensitivity genes, 10,000 genes, 400 patients. TestPower Overall.05 level test74.2 Overall.04 level test70.9 Sensitive subset.01 level test1.0 Overall adaptive signature design70.9

77
Use of Archived Samples For developing the prognostic or predictive biomarkers For testing a pre-defined prognostic or predictive biomarker

78
Use of Archived Samples for Marker Development From a non-targeted “negative” clinical trial to develop a binary classifier of a subset thought to benefit from treatment From a control arm of a non-targeted clinical trial to develop a prognostic classifier of patients who do not require additional treatment

79
Use of Archived Samples for Validation Clinical validation using specimens on single arm phase II trial –Correlate predictive biomarker to response Clinical utility using specimens from RCT comparing new treatment to control regimen –“Prospective analysis plan” –Adequate sample size and percent of patients with adequate archived tissue –Separate analytical and pre-analytical validation of robustness of test to real-time tissue handling and laboratory variation

80
Prognostic and Predictive Classifiers for Guiding Use of Approved Drugs

81
Developmental Studies vs Validation Studies Validation studies use prognostic or predictive biomarkers or composite classifiers that have been completely defined in previous developmental studies

82
Types of Validation for Prognostic and Predictive Biomarkers Analytical validation –Pre-analytical and analytical robustness Clinical validation –Does the biomarker predict what it’s supposed to predict for independent data Not whether independent studies produce the same predictive biomarkers Clinical utility –Does use of the biomarker result in patient benefit

83
Clinical Utility Benefits patient by improving treatment decisions Depends on context of use of the biomarker –Treatment options and practice guidelines – Other prognostic factors

84
Establishing Clinical Utility of a Prognostic Biomarker Classifier Identify patients for whom practice standards imply cytotoxic chemotherapy who have good prognosis without chemotherapy –Prospective trial using pre-defined classifier to identify good risk patients and withhold chemotherapy TAILORx, MINDACT –Analysis of archived specimens from previous clinical trial in which patients did not receive chemotherapy Pre-defined classifier Prospective analysis plan developed before doing assay Establish analytical and pre-analytical validity of assay Large fraction of patients with adequate archived tissue

85
Establishing Clinical Utility of a Predictive Classifier of Benefit from Regimen T Randomized trial of treatment with T versus control –Include both test + and test – patients and size trial to evaluate T vs control separately for the two groups of patients –Or include only test – patients if T is an established standard therapy Prospective trial may not be feasible “Prospective analysis” of archived specimens from previous trial

86
False “Gold Standard” Design for Establishing Clinical Utility of a Predictive Classifier of Benefit from Regimen T Randomize patients to whether or not to have classifier measured or to use standard of care –Standard of care group receive T and don’t have classifier measured –Patients randomized to have classifier measured If test + (ie predicted to benefit from T) receive T If test - receive control regimen C Very inefficient –many patients get same treatment regardless of randomized arm –Since classifier is not measured in SOC arm, the trial must be huge to detect very small overall difference in outcome
 receive T If test - receive control regimen C Very inefficient –many patients get same treatment regardless of randomized arm –Since classifier is not measured in SOC arm, the trial must be huge to detect very small overall difference in outcome")
88
Measure classifier for all patients and randomize only those for whom classifier determined therapy differs form standard of care –MINDACT –Primary analysis in MINDACT is single arm evaluation of distant-DFS in randomized patients who receive endocrine therapy alone

89
Conclusions Neither academic research, industry, nor regulators have adequately adapted to the fundamental discoveries of the heterogeneity of human cancers There is great potential for developing treatments that are highly effective for the right patients using prognostic and predictive biomarkers There is great potential for reducing the waste of economic resources from vast over-treatment of cancer patients Critical path objectives are more likely to be achieved thru development of predictive biomarkers than thru development of surrogate endpoint biomarkers

Similar presentations


 How.>")


 Design. Prospective Co-Development of Drugs and Companion Diagnostics 1. Develop a completely specified genomic classifier of the.>")


