Download presentation
Presentation is loading. Please wait.

1
Use of Prognostic & Predictive Biomarkers in Clinical Trial Design Richard Simon, D.Sc. Chief, Biometric Research Branch National Cancer Institute http://brb.nci.nih.gov

2
BRB Website brb.nci.nih.gov Powerpoint presentations Reprints BRB-ArrayTools software –Data archive –Q/A message board Web based Sample Size Planning –Clinical Trials Optimal 2-stage phase II designs Phase III designs using predictive biomarkers Phase II/III designs –Development of gene expression based predictive classifiers

3
Prognostic & Predictive Biomarkers Most cancer treatments benefit only a minority of patients to whom they are administered Being able to predict which patients are likely or unlikely to benefit would –Save patients from unnecessary toxicity, and enhance their chance of receiving a drug that helps them –Control medical costs –Improve the success rate of clinical drug development

4
Predictive biomarkers –Measured before treatment to identify who will or will not benefit from a particular treatment ER, HER2, KRAS Prognostic biomarkers –Measured before treatment to indicate long-term outcome for patients untreated or receiving standard treatment Only have medical utility if therapeutically relevant Used to identify who does or does not require more intensive than standard treatment –OncotypeDx

5
Prognostic and Predictive Biomarkers in Oncology Single gene or protein measurement Scalar index or classifier that summarizes expression levels of multiple genes

6
Prognostic Factors in Oncology Many prognostic factors are not used because they are not actionable –Most prognostic factor studies are not conducted with an intended use They use a convenience sample of heterogeneous patients for whom tissue is available Retrospective studies of prognostic markers should be planned and analyzed with specific focus on intended use of the marker Design of prospective studies depends on context of use of the biomarker –Treatment options and practice guidelines – Other prognostic factors

7
Clinical Utility Biomarker benefits patient by improving treatment decisions –Identify patients who have very good prognosis on standard treatment and do not require more intensive regimens –Identify patients who have poor prognosis on standard chemotherapy who are good candidates for experimental regimens

8
Prospective Evaluation of Prognostic Biomarker Identify low stage patients for whom standard of care is chemotherapy Find dataset of low stage patients who did not receive chemotherapy for whom archived tissue is available Develop prognostic classifier of risk without chemotherapy of low stage patients If the classifier identifies a group with a very low risk of recurrence in the absence of chemotherapy then: Conduct RCT in which low stage patients who are low risk by biomarker classifier are randomized to +- chemotherapy

9
If the predicted risk of recurrence is sufficiently low, then randomization may be omitted The test of the biomarker is a test of whether the risk is as low as predicted –Absolute benefit of very low risk patients is by necessity very small –This is the approach of TAILORx

10
How Does This Approach Compare to the So Called Gold Standard of Randomizing Patients to Receive or Not Receive the Test?

11
Prospective Marker Strategy Design Patients are randomized to either –have marker measured and treatment determined based on marker result and clinical features –don’t have marker measured and receive standard of care treatment based on clinical features alone

12
Randomize Patients to Test or No Test Rx Determined by Test Rx Determined By SOC

13
Marker Strategy Design Inefficient –Many patients get the same treatment regardless of which arm they are randomized to Uninformative –Since patients in the standard of care arm do not have the marker measured, it is not possible to compare outcome for patients whose treatment is changed based on the marker result

14
Using phase II data, develop predictor of response to new drug Apply Test to All Eligible Patients Test Deterimined Rx Different From SOC Use Test Determined Rx Use SOC Test Determined Rx Same as SOC Off Study

15
MINDACT randomizes breast cancer patients whose Mammaprint based Rx differs from SOC Trial is sized to estimate risk of relapse of low risk Mammaprint patients randomized to no chemotherapy

16
Predictive Biomarkers

19
Cancers of a primary site are in many cases a molecularly heterogeneous group of diseases which vary enormously in their responsiveness to treatment, particularly molecularly targeted treatment Can we develop new drugs in a manner more consistent with modern tumor biology and obtain reliable information about what regimens work for what kinds of tumors?

20
Evaluating a predictive biomarker for treatment T involves an RCT of T versus a control C. Analysis of RCT determines whether the biomarker distinguishes the patients who benefit from T vs C from those who don’t In this RCT, the biomarker should ideally be –completely specified in advance –focused on the single specific biomarker –the trial sized with sufficient marker + and marker – patients for adequately powered separate analysis of T vs C differences in each stratum. Evaluating a predictive biomarker does not involve comparison of outcome of marker + vs marker – patient

22
Prospective Co-Development of Drugs and Companion Diagnostics 1.Develop a completely specified genomic classifier of the patients likely to benefit from a new drug 2.Establish analytical validity of the classifier 3.Use the completely specified classifier in the primary analysis plan of a phase III trial of the new drug

23
Guiding Principle The data used to develop the classifier should be distinct from the data used to test hypotheses about treatment effect in subsets determined by the classifier –Developmental studies can be exploratory –Studies on which treatment effectiveness claims are to be based should not be exploratory

24
Using phase II data, develop predictor of response to new drug Develop Predictor of Response to New Drug Patient Predicted Responsive New Drug Control Patient Predicted Non-Responsive Off Study

25
Applicability of Targeted/Enrichment Design Primarily for settings where the classifier is based on a single gene whose protein product is the target of the drug or the biology seems well understood –eg trastuzumab With a strong biological basis for the classifier, it may be unacceptable to expose classifier negative patients to the new drug Analytical validation, biological rationale and phase II data provide basis for regulatory approval of the test Phase III study focused on test + patients to provide data for approving the drug

26
Principle If a drug is found safe and effective in a defined (test +) patient population, approval should not depend on finding the drug ineffective in some other (test -) population
 patient population, approval should not depend on finding the drug ineffective in some other (test -) population")
27
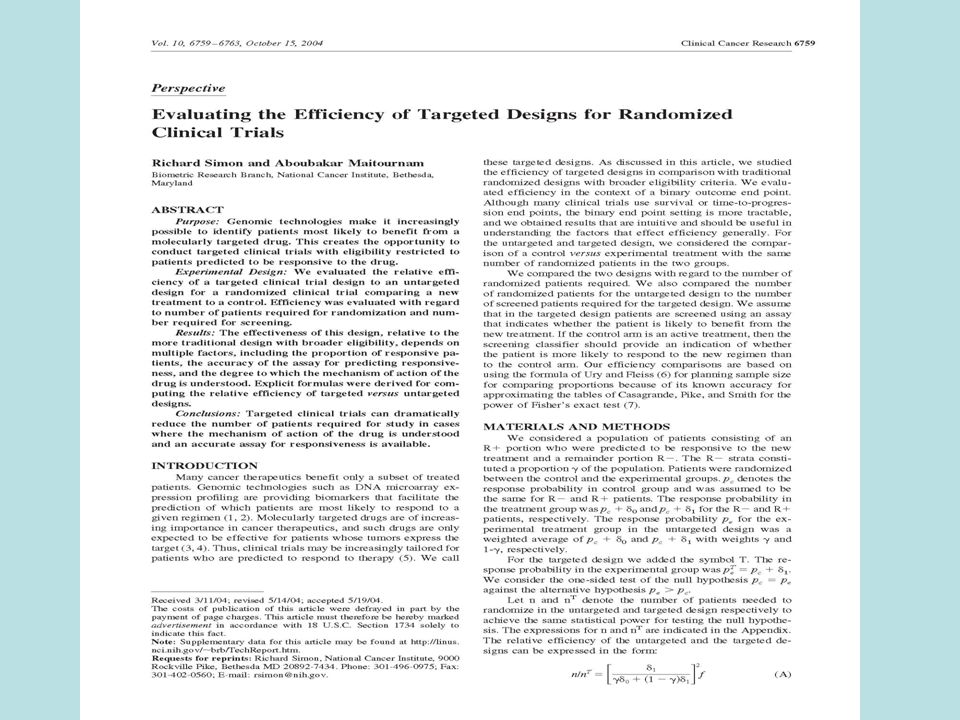
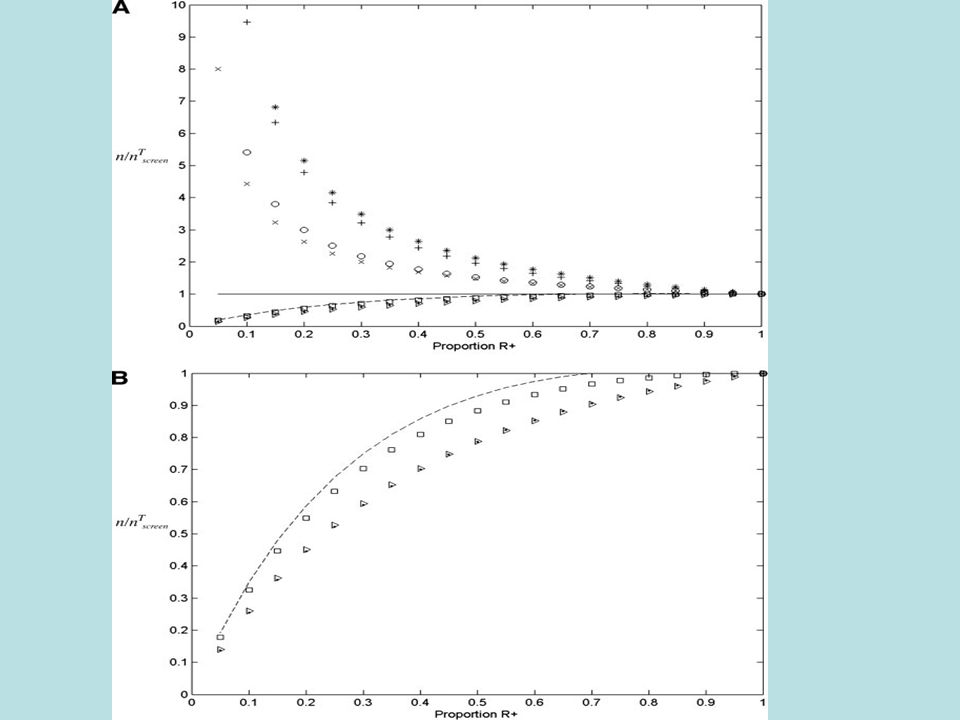
Evaluating the Efficiency of Enrichment Design Simon R and Maitnourim A. Evaluating the efficiency of targeted designs for randomized clinical trials. Clinical Cancer Research 10:6759-63, 2004; Correction and supplement 12:3229, 2006 Maitnourim A and Simon R. On the efficiency of targeted clinical trials. Statistics in Medicine 24:329-339, 2005. reprints and interactive sample size calculations at http://linus.nci.nih.gov

28
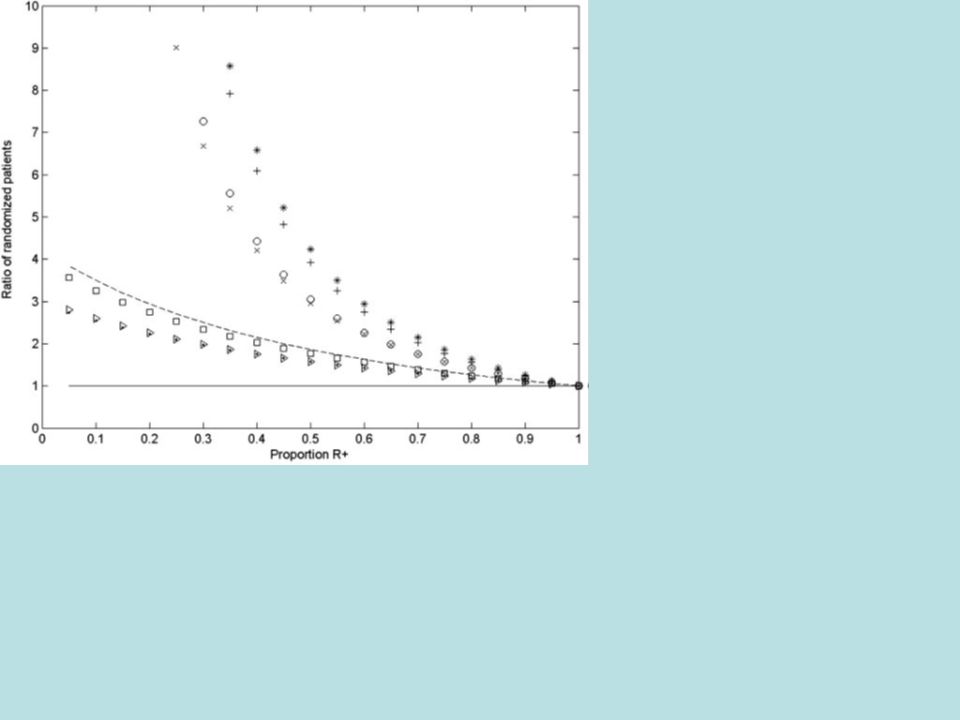
Relative efficiency of targeted design depends on –proportion of patients test positive –effectiveness of new drug (compared to control) for test negative patients When less than half of patients are test positive and the drug has little or no benefit for test negative patients, the targeted design requires dramatically fewer randomized patients
 for test negative patients When less than half of patients are test positive and the drug has little or no benefit for test negative patients, the targeted design requires dramatically fewer randomized patients")
29
Trastuzumab Herceptin Metastatic breast cancer 234 randomized patients per arm 90% power for 13.5% improvement in 1-year survival over 67% baseline at 2-sided.05 level If benefit were limited to the 25% assay + patients, overall improvement in survival would have been 3.375% –4025 patients/arm would have been required

31
Model for Two Treatments With Binary Response Molecularly targeted treatment T Control treatment C 1- Proportion of patients that express target p c control response probability response probability for T patients who express target (R+) is (p c + 1 ) Response probability for T patients who do not express target (R-) is (p c + 0 )
 is (p c + 1 ) Response probability for T patients who do not express target (R-) is (p c + 0 )")
34
Randomized Ratio (normal approximation) RandRat = n untargeted /n targeted 1 = rx effect in marker + patients 0 = rx effect in marker - patients =proportion of marker - patients If 0 =0, RandRat = 1/ (1- ) 2 If 0 = 1 /2, RandRat = 1/(1- /2) 2
 RandRat = n untargeted /n targeted 1 = rx effect in marker + patients 0 = rx effect in marker - patients =proportion of marker - patients If 0 =0, RandRat = 1/ (1- ) 2 If 0 = 1 /2, RandRat = 1/(1- /2) 2")
35
Randomized Ratio n untargeted /n targeted 1- Express target 0 =0 0 = 1 /2 0.751.781.31 0.541.78 0.25162.56

36
Screened Ratio N untargeted = n untargeted N targeted = n targeted /(1- ) ScreenRat = N untargeted /N targeted =(1- )RandRat
 ScreenRat = N untargeted /N targeted =(1- )RandRat")
37
Screened Ratio Express target 0 =0 0 = 1 /2 0.751.330.98 0.520.89 0.2540.64

38
Decomposing Specificity of Treatment Effect from Accuracy of Test RandRat = n untargeted /n targeted

39
Randomized Ratio sensitivity=specificity=0.9 1- Express target 0 =0 0 = 1 /2 0.751.291.26 0.51.81.6 0.253.01.96

40
Screened Ratio N untargeted = n untargeted

41
Screened Ratio sensitivity=specificity=0.9 Express target 0 =0 0 = 1 /2 0.750.90.88 0.50.90.80 0.250.90.59

42
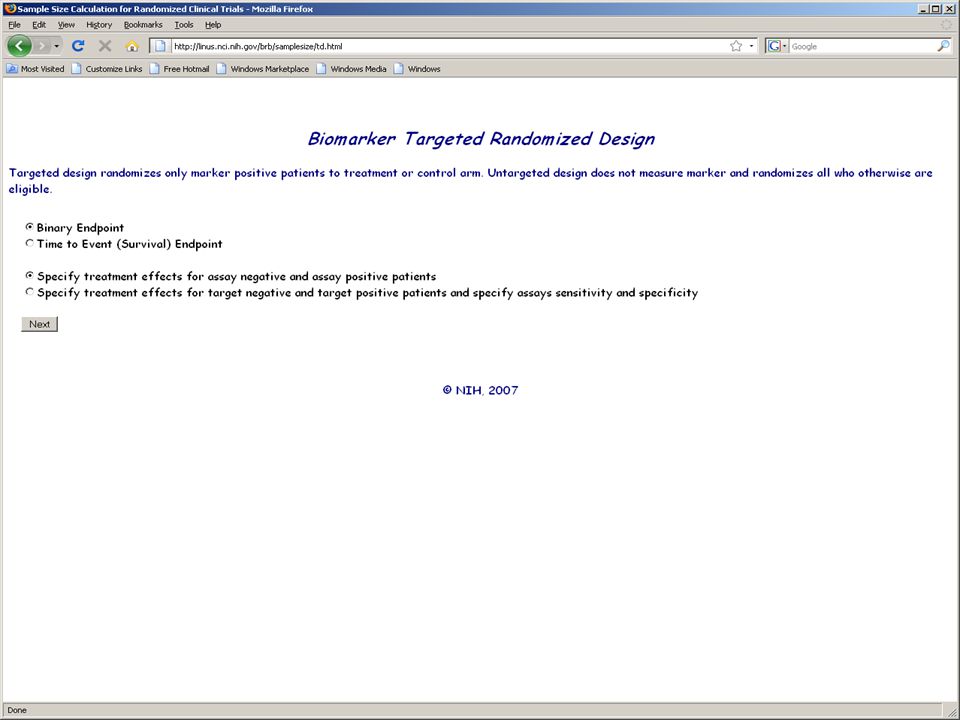
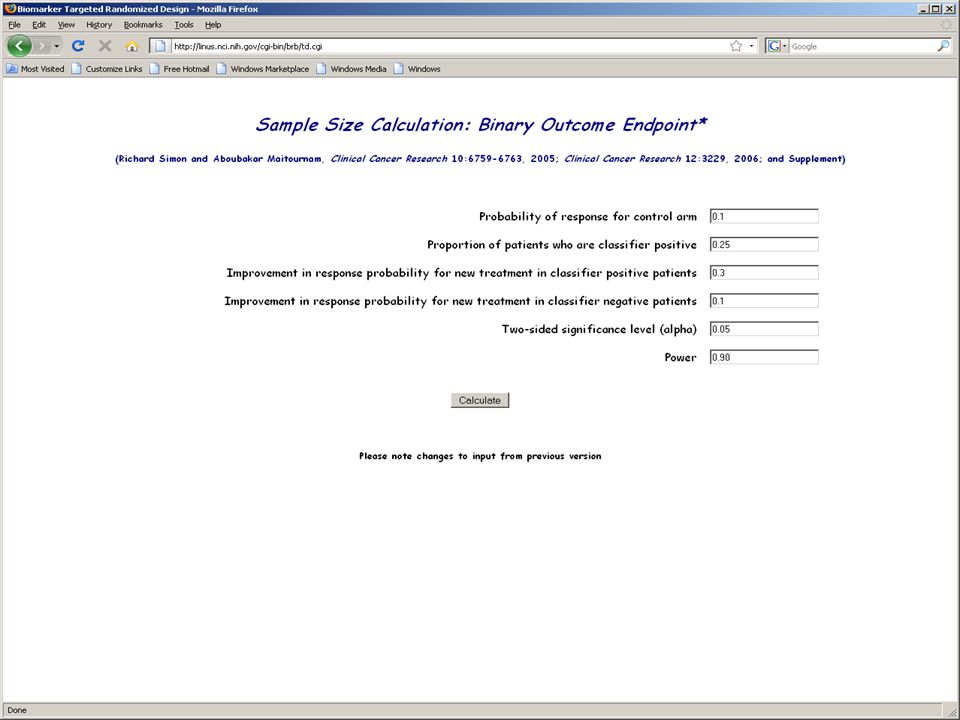
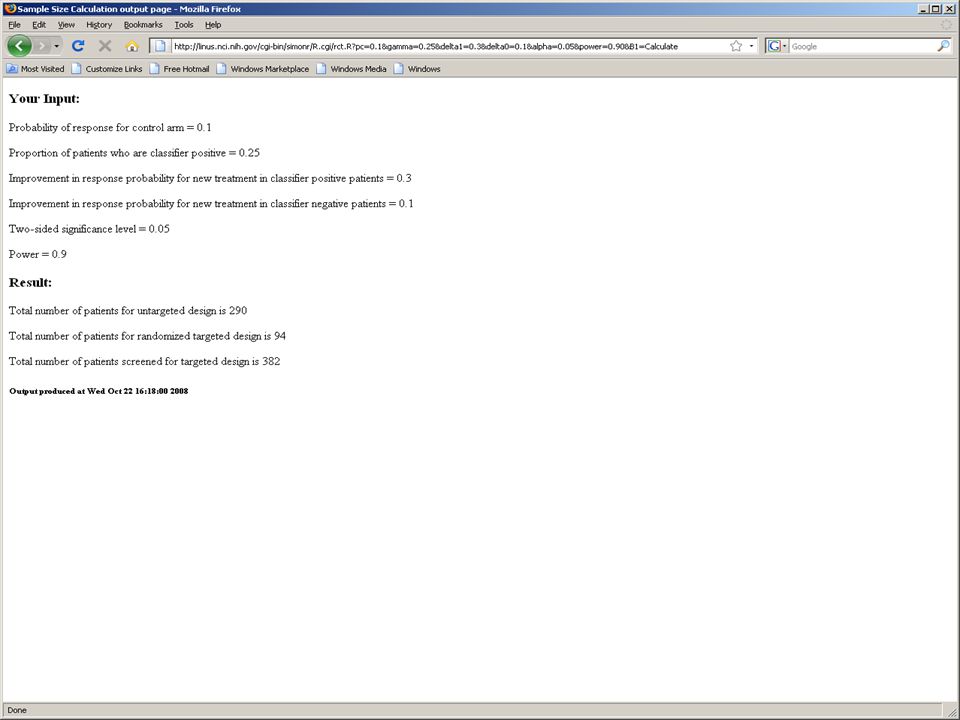
Web Based Software for Designing RCT of Drug and Predictive Biomarker http://brb.nci.nih.gov

46
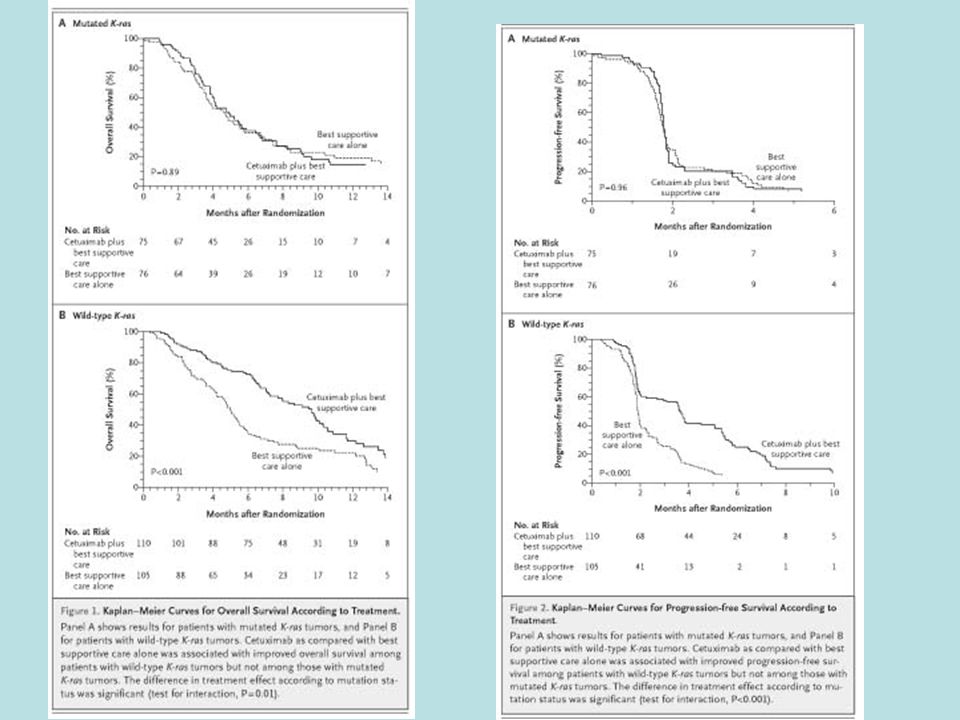
It can be very difficult to develop an effective and analytically validated predictive biomarker prior to launch of the phase III trial –Even for anti-EGFR antibodies, a more effective biomarker turned out to be KRAS mutation, not EGFR expression –For small molecule kinase inhibitors the task is more difficult In some settings it can be easier to use an analytically validated biomarker of poor outcome on the standard therapy

47
It can be very difficult to develop an effective and analytically validated predictive biomarker prior to launch of the phase III trial –Even for anti-EGFR antibodies, a more effective biomarker turned out to be KRAS mutation, not EGFR expression –For small molecule kinase inhibitors the task is more difficult In some settings it can be easier to use an analytically validated biomarker of poor outcome on the standard therapy

48
Score function S for distinguishing patients with favorable outcome on standard rx vs those with unfavorable outcome –Developed on training set of pts receiving std rx G F (s)=CDF of S in favorable pts G U (s)=CDF of S in unfavorable pts –Computed on test set of pts receiving std rx
=CDF of S in favorable pts G U (s)=CDF of S in unfavorable pts –Computed on test set of pts receiving std rx")
49
G U (s)=sensitivity of test for selecting pts with unfavorable outcome on std rx using threshold s 1-G F (s)=specificity of test Plot of G U (s) vs G F (s) = ROC curve
=sensitivity of test for selecting pts with unfavorable outcome on std rx using threshold s 1-G F (s)=specificity of test Plot of G U (s) vs G F (s) = ROC curve")
50
Latent classes –LC=F –LC=U –Pr[LC=F]= Pr S [Resp=F|LC=F]=p 1 Pr S [Resp=F|LC=U]=p 0 Pr E [Resp=F|LC=F]=p 1 Pr S [Resp=F|LC=U]=p 0 +
![Latent classes –LC=F –LC=U –Pr[LC=F]= Pr S [Resp=F|LC=F]=p 1 Pr S [Resp=F|LC=U]=p 0 Pr E [Resp=F|LC=F]=p 1 Pr S [Resp=F|LC=U]=p 0 + ](http://images.slideplayer.com/16/5007105/slides/slide_50.jpg "Latent classes –LC=F –LC=U –Pr[LC=F]= Pr S [Resp=F|LC=F]=p 1 Pr S [Resp=F|LC=U]=p 0 Pr E [Resp=F|LC=F]=p 1 Pr S [Resp=F|LC=U]=p 0 + ")
55
The maximum treatment effect is . It can be achieved if one selects a threshold t small enough that the specificity of the test for excluding cases with favorable outcome on the standard treatment is 1. If the specificity is 1, then the size of the treatment effect does not depend on the sensitivity of the test Proportion randomized = (1- )G U (t)+ G F (t)
G U (t)+ G F (t).")
56
Simon and Maitnourim showed that the ratio of number of patients needed to randomize for a targeted design compared to a standard design that does not use the biomarker is approximately equal to the square of the ratio of the treatment effects for the two designs For the standard design the treatment effect is (1- )
 ")
58
If the threshold is selected for specificity 1, then the randomization ratio equals (1- ) 2 Hence if half of the patients have favorable outcome with standard treatment, i.e. =0.5, then the targeted design requires only one quarter the number of randomized patients as the standard design.

59
Stratification Design Develop Predictor of Response to New Rx Predicted Non- responsive to New Rx Predicted Responsive To New Rx Control New RXControl New RX

60
Stratification Design Use the test to structure a prospective specified primary analysis plan Having a prospective analysis plan is essential “Stratifying” (balancing) the randomization is useful to ensure that all randomized patients have tissue available but is not a substitute for a prospective analysis plan The purpose of the study is to evaluate the new treatment overall and for the pre-defined subsets; not to modify or refine the classifier The purpose is not to demonstrate that repeating the classifier development process on independent data results in the same classifier
 the randomization is useful to ensure that all randomized patients have tissue available but is not a substitute for a prospective analysis plan The purpose of the study is to evaluate the new treatment overall and for the pre-defined subsets; not to modify or refine the classifier The purpose is not to demonstrate that repeating the classifier development process on independent data results in the same classifier")
61
Not “Interaction Design” Requiring a significant interaction at 5% level to justify evaluating treatment effects in subsets – was useful in the context of post-hoc subset analysis when drugs were non-specific cytotoxins, the subsets were not biology based and the prior probability of qualitative interactions was low –is not useful for focused co-development of molecularly targeted drugs when the subset analysis is part of the primary analysis plan and the study-wise type I error is controlled –is an example of how progress could be unnecessarily stymied by making co-development impracticably expensive

62
R Simon. Using genomics in clinical trial design, Clinical Cancer Research 14:5984-93, 2008 R Simon. Designs and adaptive analysis plans for pivotal clinical trials of therapeutics and companion diagnostics, Expert Opinion in Medical Diagnostics 2:721-29, 2008

63
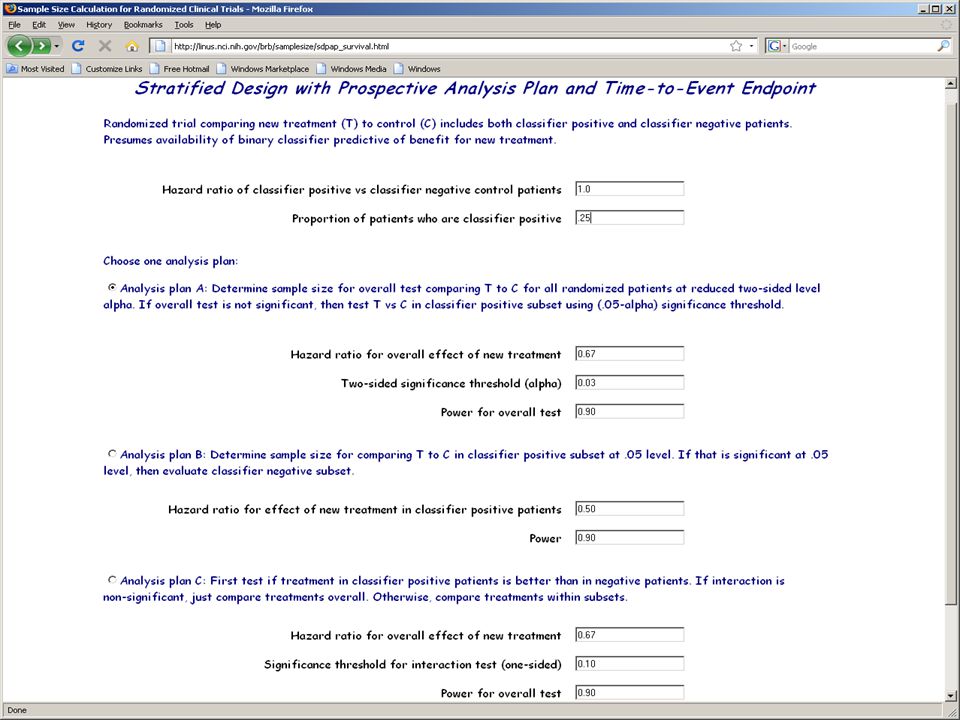
Analysis Plan A Compare the new drug to the control for classifier positive patients –If p + >0.05 make no claim of effectiveness –If p + 0.05 claim effectiveness for the classifier positive patients and Compare new drug to control for classifier negative patients using 0.05 threshold of significance

64
Sample size for Analysis Plan A 88 events in classifier + patients needed to detect 50% reduction in hazard at 5% two-sided significance level with 90% power If 25% of patients are positive, then when there are 88 events in positive patients there will be about 264 events in negative patients –264 events provides 90% power for detecting 33% reduction in hazard at 5% two-sided significance level –Sequential futility monitoring may have enabled early cessation of accrual of classifier negative patients Not much earlier with time-to-event endpoint

65
Study-wise false positivity rate is limited to 5% with analysis plan A It is not necessary or appropriate to require that the treatment vs control difference be significant overall before doing the analysis within subsets

66
Analysis Plan B (Limited confidence in test) Compare the new drug to the control overall for all patients ignoring the classifier. –If p overall 0.03 claim effectiveness for the eligible population as a whole Otherwise perform a single subset analysis evaluating the new drug in the classifier + patients –If p subset 0.02 claim effectiveness for the classifier + patients.

67
This analysis strategy is designed to not penalize sponsors for having developed a classifier It provides sponsors with an incentive to develop genomic classifiers

68
Sample size for Analysis Plan B To have 90% power for detecting uniform 33% reduction in overall hazard at 3% two-sided level requires 297 events (instead of 263 for similar power at 5% level) If 25% of patients are positive, then when there are 297 total events there will be approximately 75 events in positive patients –75 events provides 75% power for detecting 50% reduction in hazard at 2% two-sided significance level –By delaying evaluation in test positive patients, 80% power is achieved with 84 events and 90% power with 109 events
 If 25% of patients are positive, then when there are 297 total events there will be approximately 75 events in positive patients –75 events provides 75% power for detecting 50% reduction in hazard at 2% two-sided significance level –By delaying evaluation in test positive patients, 80% power is achieved with 84 events and 90% power with 109 events")
69
Analysis Plan C Test for difference (interaction) between treatment effect in test positive patients and treatment effect in test negative patients at an elevated level int (e.g..10) If interaction is significant at level int then compare treatments separately for test positive patients and test negative patients Otherwise, compare treatments overall
 between treatment effect in test positive patients and treatment effect in test negative patients at an elevated level int (e.g..10) If interaction is significant at level int then compare treatments separately for test positive patients and test negative patients Otherwise, compare treatments overall")
70
Sample Size Planning for Analysis Plan C 88 events in test + patients needed to detect 50% reduction in hazard at 5% two- sided significance level with 90% power If 25% of patients are positive, when there are 88 events in positive patients there will be about 264 events in negative patients –264 events provides 90% power for detecting 33% reduction in hazard at 5% two-sided significance level

71
Simulation Results for Analysis Plan C Using int =0.10, the interaction test has power 93.7% when there is a 50% reduction in hazard in test positive patients and no treatment effect in test negative patients A significant interaction and significant treatment effect in test positive patients is obtained in 88% of cases under the above conditions If the treatment reduces hazard by 33% uniformly, the interaction test is negative and the overall test is significant in 87% of cases

72
Does the RCT Need to Be Significant Overall for the T vs C Treatment Comparison? No It is incorrect to require that the overall T vs C comparison be significant to claim that T is better than C for test + patients but not for test – patients –That requirement has been traditionally used to protect against data dredging. It is inappropriate for focused trials of a treatment with a companion test.

74
Development of Genomic Classifiers During phase II development or Adaptively during phase III trial Using archived specimens from previous phase III trial

78
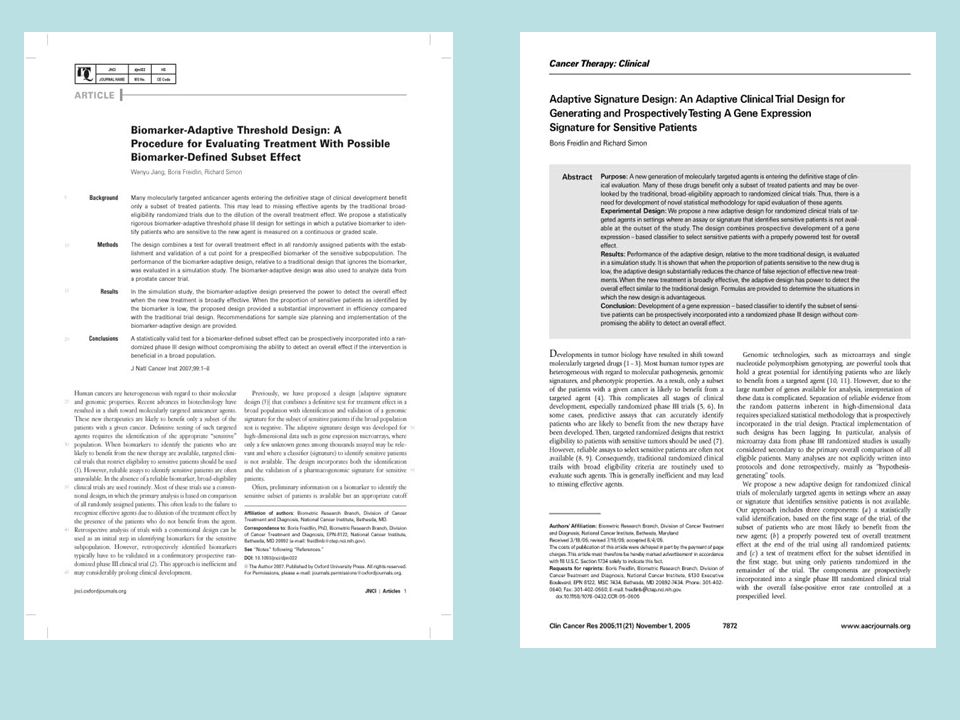
Biomarker Adaptive Threshold Design Wenyu Jiang, Boris Freidlin & Richard Simon JNCI 99:1036-43, 2007

79
Biomarker Adaptive Threshold Design Randomized trial of T vs C Have identified a biomarker score B thought to be predictive of patients likely to benefit from T relative to C Eligibility not restricted by biomarker No threshold for biomarker determined Biomarker value scaled to range (0,1) Time-to-event data
 Time-to-event data")
80
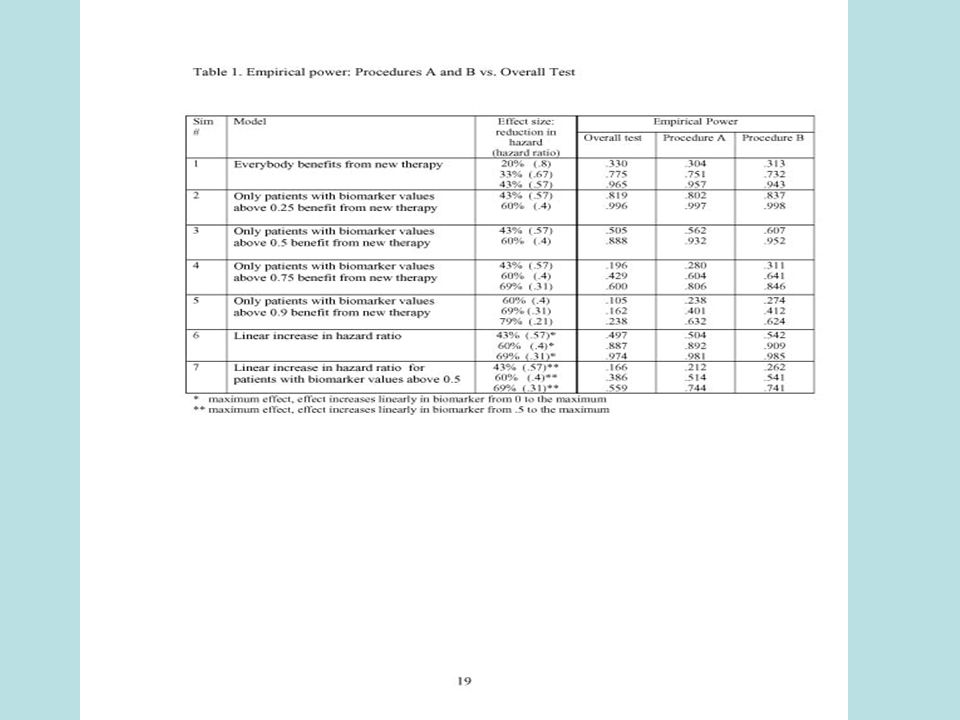
Procedure A Compare T vs C for all patients –If results are significant at level.04 claim broad effectiveness of T –Otherwise proceed as follows

81
Procedure A Test T vs C restricted to patients with biomarker B > b –Let S(b) be log likelihood ratio statistic Repeat for all values of b Let S* = max{S(b)} Compute null distribution of S* by permuting treatment labels If the data value of S* is significant at 0.01 level, then claim effectiveness of T for a patient subset Compute point and bootstrap interval estimates of the threshold b
 be log likelihood ratio statistic Repeat for all values of b Let S* = max{S(b)} Compute null distribution of S* by permuting treatment labels If the data value of S* is significant at 0.01 level, then claim effectiveness of T for a patient subset Compute point and bootstrap interval estimates of the threshold b")
82
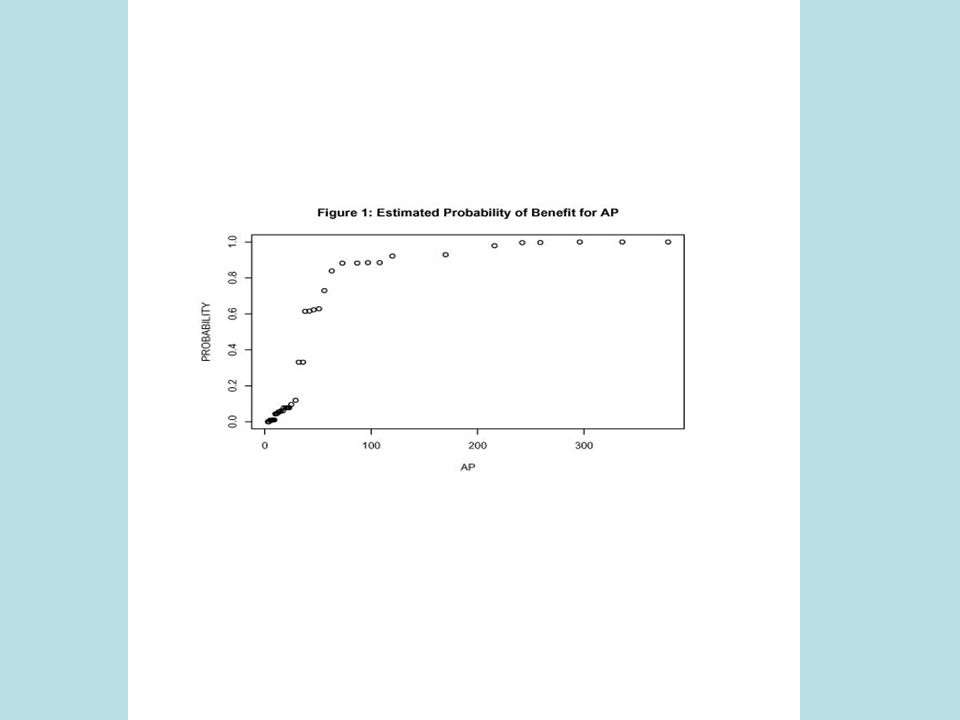
Estimation of Threshold

83
Estimated Power of Broad Eligibility Design (n=386 events) vs Adaptive Design A (n=412 events) 80% power for 30% hazard reduction ModelBroad Eligibility Design Biomarker Adaptive Threshold A 40% reduction in 50% of patients (22% overall reduction).70.78 60% reduction in 25% of patients (20% overall reduction).65.91 79% reduction in 10% of patients (14% overall reduction).35.93
 vs Adaptive Design A (n=412 events) 80% power for 30% hazard reduction ModelBroad Eligibility Design Biomarker Adaptive Threshold A 40% reduction in 50% of patients (22% overall reduction) % reduction in 25% of patients (20% overall reduction) % reduction in 10% of patients (14% overall reduction).35.93")
85
Procedure B S(b)=log likelihood ratio statistic for treatment effect in subset of patients with B b S*=max{S(0)+R, max{S(b)}} Compute null distribution of T by permuting treatment labels If the data value of T is significant at 0.05 level, then reject null hypothesis that T is ineffective Compute point and interval estimates of the threshold b
=log likelihood ratio statistic for treatment effect in subset of patients with B b S*=max{S(0)+R, max{S(b)}} Compute null distribution of T by permuting treatment labels If the data value of T is significant at 0.05 level, then reject null hypothesis that T is ineffective Compute point and interval estimates of the threshold b")
87
Sample Size Planning (A) Standard broad eligibility trial is sized for 80% power to detect reduction in hazard D at significance level 5% Biomarker adaptive threshold design is sized for 80% power to detect same reduction in hazard D at significance level 4% for overall analysis
 Standard broad eligibility trial is sized for 80% power to detect reduction in hazard D at significance level 5% Biomarker adaptive threshold design is sized for 80% power to detect same reduction in hazard D at significance level 4% for overall analysis")
88
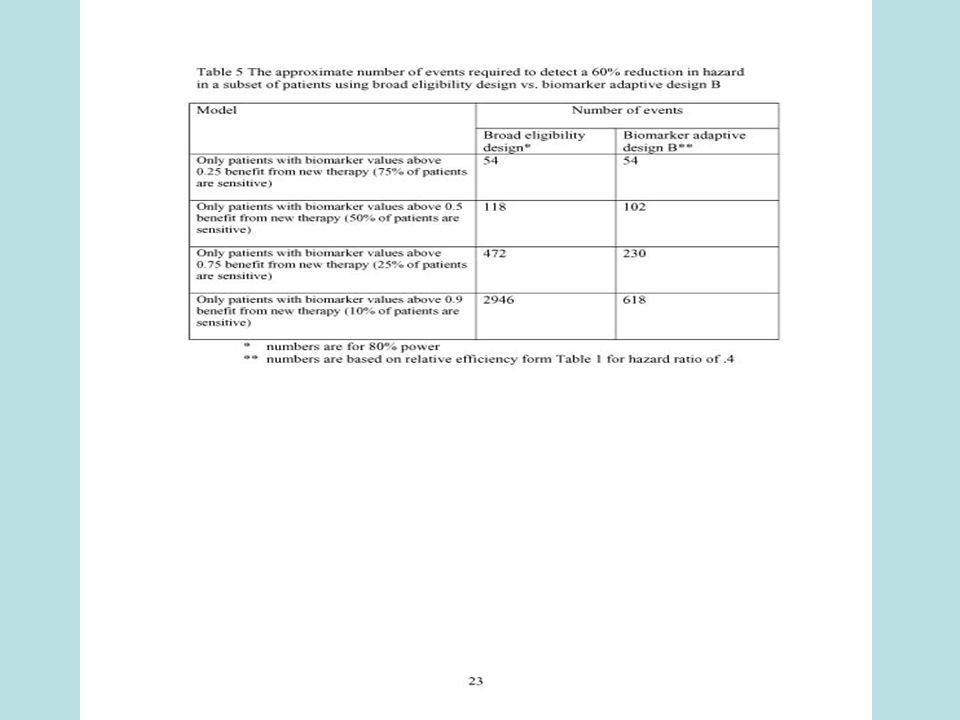
Sample Size Planning (B) Estimate power of procedure B relative to standard broad eligibility trial based on Table 1 for the row corresponding to the expected proportion of sensitive patients ( ) and the target hazard ratio for sensitive patients –e.g. =25% and =.4 gives RE=.429/.641=.67 When B has power 80%, overall test has power 80*.67=53% Use formula B.2 to determine the approximate number of events needed for overall test to have power 53% for detecting =.4 limited to =25% of patients

89
Events needed to Detect Hazard Ratio With Proportional Hazards

90
Events (D’) Needed for Overall Test to Detect Hazard Ratio Limited to Fraction
 Needed for Overall Test to Detect Hazard Ratio Limited to Fraction ")
91
Example Sample Size Planning for Procedure B Design a trial to detect =0.4 (60% reduction) limited to =25% of patients –Relative efficiency from Table 1.429/.641=.67 When procedure B has power 80%, standard test has power 80%*.67=53% Formula B.2 gives D’=230 events to have 53% power for overall test and thus approximate 80% power for B Overall test needs D=472 events for 80% power for detecting the diluted treatment effect
 limited to =25% of patients –Relative efficiency from Table 1.429/.641=.67 When procedure B has power 80%, standard test has power 80%*.67=53% Formula B.2 gives D’=230 events to have 53% power for overall test and thus approximate 80% power for B Overall test needs D=472 events for 80% power for detecting the diluted treatment effect")
93
Multiple Biomarker Design Have identified K candidate binary classifiers B 1, …, B K thought to be predictive of patients likely to benefit from T relative to C Eligibility not restricted by candidate classifiers For notation let B 0 denote the classifier with all patients positive

94
Test T vs C restricted to patients positive for B k for k=0,1,…,K –Let S(B k ) be log likelihood ratio statistic for treatment effect in patients positive for B k (k=1,…,K) Let S* = max{S(B k )}, k* = argmax{S(B k )} For a global test of significance –Compute null distribution of S* by permuting treatment labels –If the data value of S* is significant at 0.05 level, then claim effectiveness of T for patients positive for B k*
 be log likelihood ratio statistic for treatment effect in patients positive for B k (k=1,…,K) Let S* = max{S(B k )}, k* = argmax{S(B k )} For a global test of significance –Compute null distribution of S* by permuting treatment labels –If the data value of S* is significant at 0.05 level, then claim effectiveness of T for patients positive for B k*")
95
Test T vs C restricted to patients positive for B k for k=0,1,…,K –Let S(B k ) be log likelihood ratio statistic for treatment effect in patients positive for B k (k=1,…,K) Let S* = max{S(B k )}, k* = argmax{S(B k )} The new treatment is superior to control for the population defined by k* Repeating the analysis for bootstrap samples of cases provides – an estimate of the stability of k* (the indication) – an interval estimate S* (the size of treatment effect for the size of treatment effect in the target population)
 be log likelihood ratio statistic for treatment effect in patients positive for B k (k=1,…,K) Let S* = max{S(B k )}, k* = argmax{S(B k )} The new treatment is superior to control for the population defined by k* Repeating the analysis for bootstrap samples of cases provides – an estimate of the stability of k* (the indication) – an interval estimate S* (the size of treatment effect for the size of treatment effect in the target population)")
96
Adaptive Signature Design Boris Freidlin and Richard Simon Clinical Cancer Research 11:7872-8, 2005

97
Adaptive Signature Design End of Trial Analysis Compare E to C for all patients at significance level 0.04 –If overall H 0 is rejected, then claim effectiveness of E for eligible patients –Otherwise

98
Otherwise: –Using only the first half of patients accrued during the trial, develop a binary classifier that predicts the subset of patients most likely to benefit from the new treatment T compared to control C –Compare T to C for patients accrued in second stage who are predicted responsive to T based on classifier Perform test at significance level 0.01 If H 0 is rejected, claim effectiveness of T for subset defined by classifier

99
Classifier Development Using data from stage 1 patients, fit all single gene logistic models (j=1,…,M) Select genes with interaction significant at level
 Select genes with interaction significant at level ")
100
Classification of Stage 2 Patients For i’th stage 2 patient, selected gene j votes to classify patient as preferentially sensitive to T if

101
Classification of Stage 2 Patients Classify i’th stage 2 patient as differentially sensitive to T relative to C if at least G selected genes vote for differential sensitivity of that patient

102
Treatment effect restricted to subset. 10% of patients sensitive, 10 sensitivity genes, 10,000 genes, 400 patients. TestPower Overall.05 level test46.7 Overall.04 level test43.1 Sensitive subset.01 level test (performed only when overall.04 level test is negative) 42.2 Overall adaptive signature design85.3
 42.2 Overall adaptive signature design85.3.")
103
Empirical Power RR for Control Patients 25% Response Rate in Sensitive Subset Overall.05Overall.04Subset.01Overall Adaptive 98%49.545.475.885.7 95%43.038.563.175.0 87%36.731.734.551.6 80%31.628.417.638.8 71%26.022.66.326.3

104
Cross-Validated Adaptive Signature Design (to be submitted for publication) Wenyu Jiang, Boris Freidlin, Richard Simon
 Wenyu Jiang, Boris Freidlin, Richard Simon")
105
Cross-Validated Adaptive Signature Design End of Trial Analysis Compare T to C for all patients at significance level overall –If overall H 0 is rejected, then claim effectiveness of T for eligible patients –Otherwise

106
Otherwise Partition the full data set into K parts Form a training set by omitting one of the K parts. The omitted part is the test set –Using the training set, develop a predictive classifier of the subset of patients who benefit preferentially from the new treatment T compared to control C using the methods developed for the ASD –Classify the patients in the test set as sensitive (classifier +) or insensitive (classifier -) Repeat this procedure K times, leaving out a different part each time –After this is completed, all patients in the full dataset are classified as sensitive or insensitive
 or insensitive (classifier -) Repeat this procedure K times, leaving out a different part each time –After this is completed, all patients in the full dataset are classified as sensitive or insensitive.")
107
Compare T to C for sensitive patients by computing a test statistic S e.g. the difference in response proportions or log-rank statistic (for survival) Generate the null distribution of S by permuting the treatment labels and repeating the entire K- fold cross-validation procedure Perform test at significance level 0.05 - overall If H 0 is rejected, claim effectiveness of T for subset defined by classifier –The sensitive subset is determined by developing a classifier using the full dataset
 Generate the null distribution of S by permuting the treatment labels and repeating the entire K- fold cross-validation procedure Perform test at significance level overall If H 0 is rejected, claim effectiveness of T for subset defined by classifier –The sensitive subset is determined by developing a classifier using the full dataset.")
108
70% Response to T in Sensitive Patients 25% Response to T Otherwise 25% Response to C 20% Patients Sensitive ASDCV-ASD Overall 0.05 Test 0.4860.503 Overall 0.04 Test 0.4520.471 Sensitive Subset 0.01 Test 0.2070.588 Overall Power 0.5250.731

109
Does It Matter If the Randomization in the RCT Was Not “Stratified” By the Test? No Stratification improves balance of stratification factors in overall comparisons Stratification does not improve comparability of treatment (T) and control (C) groups within test positive patients or within test negative patients. In a fully prospective trial, stratification of the randomization by the test is only useful for ensuring that all patients have adequate test performed
 and control (C) groups within test positive patients or within test negative patients. In a fully prospective trial, stratification of the randomization by the test is only useful for ensuring that all patients have adequate test performed.")
110
Information about a predictive biomarker may develop following completion of the pivotal trials It may be infeasible to conduct a new prospective trial for a previously approved drug –KRAS for anti-EGFR antibodies in colorectal cancer –HER2 for doxorubicin in breast cancer

111
In some cases the benefits of a prospective trial can be closely achieved by the carefully planned use of archived tissue from a previously conducted randomized clinical trial

112
Use of Archived Specimens in Evaluation of Prognostic and Predictive Biomarkers Richard M. Simon, Soonmyung Paik and Daniel F. Hayes Claims of medical utility for prognostic and predictive biomarkers based on analysis of archived tissues can be considered to have either a high or low level of evidence depending on several key factors. Studies using archived tissues, when conducted under ideal conditions and independently confirmed can provide the highest level of evidence. Traditional analyses of prognostic or predictive factors, using non analytically validated assays on a convenience sample of tissues and conducted in an exploratory and unfocused manner provide a very low level of evidence for clinical utility.

113
Use of Archived Specimens in Evaluation of Prognostic and Predictive Biomarkers Richard M. Simon, Soonmyung Paik and Daniel F. Hayes For Level I Evidence: (i) archived tissue adequate for a successful assay must be available on a sufficiently large number of patients from a phase III trial that the appropriate analyses have adequate statistical power and that the patients included in the evaluation are clearly representative of the patients in the trial. (ii) The test should be analytically and pre-analytically validated for use with archived tissue. (iii) The analysis plan for the biomarker evaluation should be completely specified in writing prior to the performance of the biomarker assays on archived tissue and should be focused on evaluation of a single completely defined classifier. iv) the results from archived specimens should be validated using specimens from a similar, but separate, study.
 archived tissue adequate for a successful assay must be available on a sufficiently large number of patients from a phase III trial that the appropriate analyses have adequate statistical power and that the patients included in the evaluation are clearly representative of the patients in the trial. (ii) The test should be analytically and pre-analytically validated for use with archived tissue. (iii) The analysis plan for the biomarker evaluation should be completely specified in writing prior to the performance of the biomarker assays on archived tissue and should be focused on evaluation of a single completely defined classifier. iv) the results from archived specimens should be validated using specimens from a similar, but separate, study..")
114
Factor ABCD Clinical trialPRCT designed to address tumor marker Prospective trial not designed to address tumor marker, but design accommodates tumor marker utility. Accommodation of predictive marker requires PRCT Prospective observational registry, treatment and followup not dictated No prospective aspect to study Patients and patient data Prospectively enrolled, treated, and followed in RCT Prospectively enrolled, treated, and followed in clinical trial and, especially if a predictive utility is considered, a PRCT addressing the treatment of interest Prospectively enrolled in registry, but treatment and followup standard of care No prospective stipulation of treatment or followup; patient data collected by retrospective chart review Specimen collection, processing, and archival Specimens collected, processed and assayed for specific marker in real time Specimens collected, processed, and archived prospectively using generic SOPs. Assayed after trial completed Specimens collected, processed and archived with no prospective SOPs Statistical Design and analysis Study powered to address tumor marker question. Study powered to address therapeutic question; underpowered to address tumor marker question. Focused analysis plan for marker question developed prior to doing assays Study not prospectively powered at all. Retrospective study design confounded by selection of specimens for study. Focused analysis plan for marker question developed prior to doing assays Study not prospectively powered at all. Retrospective study design confounded by selection of specimens for study. No focused analysis plan for marker question developed prior to doing assays ValidationResult unlikely to be play of chance Although preferred, validation not required Result more likely to be play of chance that A, but less likely than C. Requires one or more validation studies Result very likely to be play of chance. Requires subsequent validation studies Result very likely to be play of chance. Requires subsequent validation TerminologyProspectiveProspective using archived samples Prospective /observational Retrospective/observational

115
Revised Levels of Evidence for Tumor Marker Studies Level of EvidenceCategory from Table 1Validation Studies Available IANone required IBOne or more with consistent results IIBNone or Inconsistent results IIC2 or more with consistent results IIICNone or 1 with consistent results or Inconsistent results IV-VDNA

116
New Paradigms for Clinical Trials in Predictive Medicine Developments in biotechnology have forced statisticians to focus on prediction problems This has led to important new methodological developments for p>>n problems in which number of genes is much greater than the number of cases Statistics has over-focused on inference. Many of the methods and much of the conventional wisdom of biostatistics are based on inference problems

117
Some statisticians believe that accurate prediction is not possible for p>>n Accurate prediction is often possible, but standard statistical methods for model building and evaluation are not effective

118
p>n prediction problems are not multiple comparison problems –Feature selection should be optimized for accurate prediction, not for controlling the false discovery rate Goodness of fit to training data should not be used to guide model building nor to evaluate model performance

119
Odds ratios, hazard ratios and statistical significance of regression coefficients are not proper measures of predictive accuracy

120
Validation of a predictive model means that the model predicts accurately for independent data

121
Prediction Based Clinical Trials Using cross-validation we can evaluate new methods for analysis of clinical trials in terms of their intended use which is informing therapeutic decision making

122
f j (x) = probability of response for patient with covariate vector x who receives treatment j
 = probability of response for patient with covariate vector x who receives treatment j")
123
Single Hypothesis Testing Based Decision Making in an RCT Test H 0 : E x [f T (x)] = E x [f C (x)] or f T (x) = f C (x) for all x If you reject H 0 then treat future patients with T, otherwise treat future patients with C
![Single Hypothesis Testing Based Decision Making in an RCT Test H 0 : E x [f T (x)] = E x [f C (x)] or f T (x) = f C (x) for all x If you reject H 0 then treat future patients with T, otherwise treat future patients with C](http://images.slideplayer.com/16/5007105/slides/slide_123.jpg "Single Hypothesis Testing Based Decision Making in an RCT Test H 0 : E x [f T (x)] = E x [f C (x)] or f T (x) = f C (x) for all x If you reject H 0 then treat future patients with T, otherwise treat future patients with C")
124
Other Approaches

125
Predicting the Effect of Analysis Methods on Patient Outcome At the conclusion of the trial randomly partition the patients into 10 equally sized sets P 1, …, P 10 Let D -i denote the full dataset minus data for patients in P i Using 10-fold complete cross-validation, omit patients in P i Analyze trial using only data in D -i with both the standard analysis and the alternative analysis

126
For each patient j in P i record the cross- validated treatment recommendations based on D -i

127
Let S T denote the set of cases for which the standard analysis recommends C and the alternative analysis recommends T Let S C denote the set of cases for which the standard analysis recommends T and the alternative analysis recommends C

128
For patients in S T compare outcomes for patients who received T versus those who received C For patients in S C compare outcomes for patients who received T versus those who received C

129
Hence, alternative methods for analyzing RCT’s can be evaluated in an unbiased manner with regard to their value to patients using the actual RCT data

130
Conclusions New biotechnology and knowledge of tumor biology provide important opportunities to improve therapeutic decision making Treatment of broad populations with regimens that do not benefit most patients is increasingly no longer necessary nor economically sustainable The established molecular heterogeneity of human diseases requires the use new approaches to the development and evaluation of therapeutics

131
Conclusions Some of the conventional wisdom about statistical analysis of clinical trials is not applicable to trials dealing with co- development of drugs and diagnostic –e.g. subset analysis if the overall results are not significant or if an interaction test is not significant or if the randomization was not stratified by the subsetting variable

132
Conclusions Can we develop new drugs in a manner more consistent with modern tumor biology and obtain reliable information about what regimens work for what kinds of patients? –The information doesn’t have to be perfect to be much better than what we currently have

133
Conclusions Co-development of drugs and companion diagnostics increases the complexity of drug development –It does not make drug development simpler, cheaper and quicker –But it may make development more successful and it has great potential value for patients and for the economics of health care

Similar presentations


 How.>")


 Design. Prospective Co-Development of Drugs and Companion Diagnostics 1. Develop a completely specified genomic classifier of the.>")


 Hajime Uno (Kitasato University) Tianxi Cai, Els Goetghebeur,>")

