Download presentation
Presentation is loading. Please wait.

1
Chapter 11 Environmental Performance of a Flowsheet

2
Introduction The end result of impact evaluation will be a set of environmental metrics (indices) which represent the major environmental impacts or risks of the entire process. The indices can be used in several important engineering applications during process design, including (1) the ranking of technologies, (2) the optimizing of in-process waste recycle/recovery processes, and (3) the evaluation of the modes of reactor operation.
 the ranking of technologies, (2) the optimizing of in-process waste recycle/recovery processes, and (3) the evaluation of the modes of reactor operation..")
3
Introduction Emissions from a process are the primary piece of information required for impact assessment. A suitable fate and transport model can transform the emissions into environmental concentrations. Information regarding toxicity or inherent impact is required to convert the concentration-dependent doses into probabilities of harm.

4
Steps for Environmental Impact Assessment 1.Estimates of the rates of releases for all chemicals in the process 2.Calculation of environmental fate and transport and environmental concentrations 3.The accounting for multiple measures of risk using toxicity and inherent environmental impact information

5
Level III Multimedia Fugacity Model (Mackay, 2001) This model predicts the steady-state concentrations in four environmental compartments, i.e., (1) air, (2) surface water, (3) soil, and (4) sediment, in response to a constant emission into an environmental region of defined volume.
 This model predicts the steady-state concentrations in four environmental compartments, i.e., (1) air, (2) surface water, (3) soil, and (4) sediment, in response to a constant emission into an environmental region of defined volume.")
7
Model Domain

9
Intermedia Transport

10
Fugacity Fugacity (Pa) is a thermodynamic property of a chemical and is defined as the “escaping tendency” of the chemical fro a given phase. Partitioning of a chemical between environmental phases can be described by the equilibrium criterion of equal fugacity in all phases. The fugacity is equal to partial pressure in the dilute limit. It is generally proportional to concentration, i.e., C=fZ, where Z is termed the fugacity capacity.

11
Fugacity in Air Phase

12
Fugacity Capacity in Air Phase

13
Fugacity and Fugacity Capacity in Water Phase

14
Fugacity in Solid Phase

17
Diffusive Intermedia Transport The diffusive rate of transfer from compartment i to compartment j is defined by A comparable expression exists for the transfer rate from compartment j to i. The difference between the two is the net transfer rate.

18
Non-Diffusive Intermedia Transport

19
Air/Water Transports Three processes are involved in air-to-water transport: diffusion (absorption), washout by rain and wet/dry deposition of aerosols. The conventional 2-film approach is taken for absorption using the following air-side and water- side mass transfer coefficients:

20
Air/Water Transport Parameters

23
Air/Soil Transport Parameters

26
Water/Sediment Transport Parameters

27
Soil-to-Water Transport Parameters

29
Advective Transport Chemical may directly enter into compartments by emissions and advective inputs from outside the model region. The total rate of inputs for each compartment i is

31
Reaction Loss Reaction processes occurring in the environment include biodegradation, photolysis, hydrolysis, and oxidation. A good approximation for reaction processes in the dilute limit commonly found in the environment is to express them as first order.

32
Reaction Loss

34
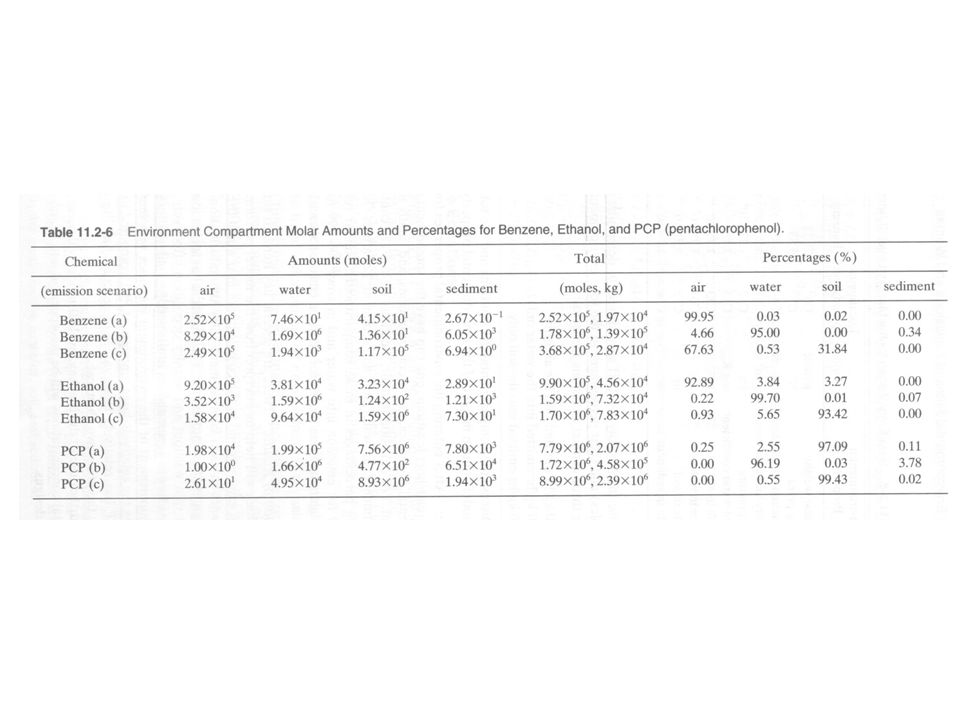
Example Benzene, ethanol, and pentachlorophenol (PCP) are examples of organic pollutants with very different environmental properties. Benzene and ethanol are volatile and have comparatively short reaction time half-lives. PCP has a long reaction half life, low volatility and water solubility, and strong sorptive properties. Benzene is the most reactive in air and ethanol is the most reactive in water, soil and sediment. Use the Mackay level III spreadsheet to determine the amounts of each chemical in the 4 compartments at steady state for 1.1000 kg/hr emitted into air only. 2.1000 kg/hr emitted into water only. 3.1000 kg/hr emitted into soil only.

Similar presentations


![Gas Solubilities Henry’s Law: [A]equilibrium = SA · pA](/7/1709850/big_thumb.jpg "Gas Solubilities Henry’s Law: [A]equilibrium = SA · pA>")


>")


 Multimedia.>")


 launched by the EPA in 1998: - Reduce.>")
 n Transmittance.>")
