Download presentation
Presentation is loading. Please wait.

1
Measurement Mike Davies, MD FACP Mark Murray and Associates

2
Review importance of measurement Review what to measure Review how to measure it Tools Interpretation of measures

3
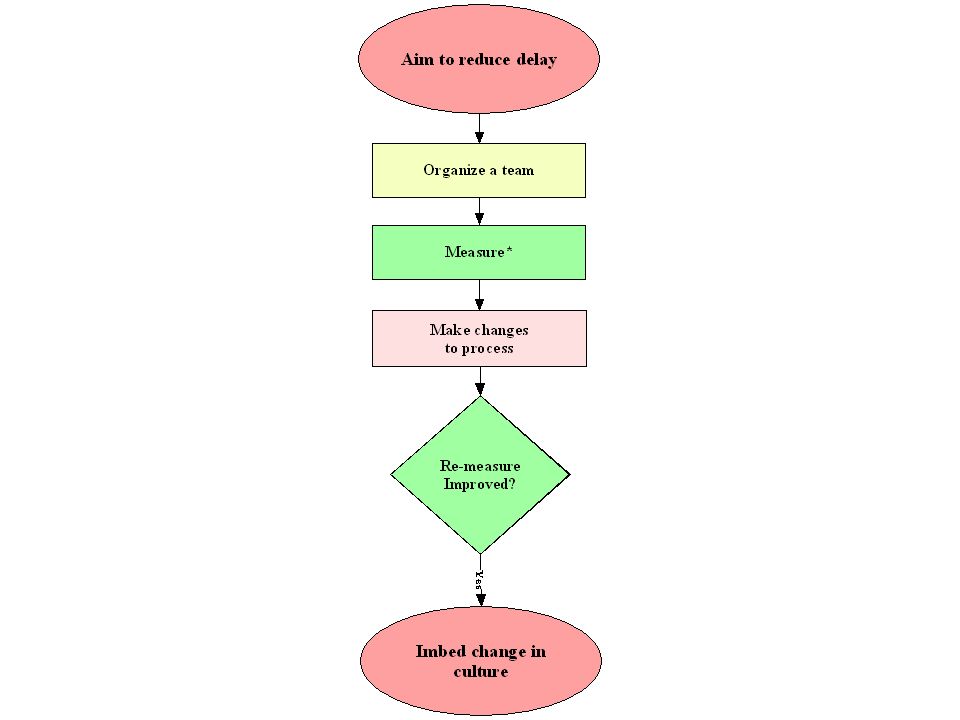
Importance of Measurement What is our aim? What will we change? How will we know a change is an improvement?

5
“Kinds” of Data Judgment –Research –Performance appraisal –“do something TO you” Improvement –Process improvement efforts –“do something WITH you”

6
Key Metrics Primary Care Delay Demand Supply Panel Size Continuity No show Lead time

7
Backlog Supply Activity Demand Lead Time Delay A B How to “See” Universe from which demand comes

8
Solution A for Delay Demand Supply

9
Solution B for Delay Demand Supply

10
Perfect Flow Demand Supply

11
Delay How long do patients wait?

12
Delay Third next available appointment (time to open space) Future open capacity (amount of open space) Actual Waiting (“A” to “B”)
 Future open capacity (amount of open space) Actual Waiting ( A to B )")
13
A B C Three Ways to Measure Delay D

15
Days to 3rd Next Available

16
Measurement of Delay “Actual Waiting” Method A B

17
Future Open Capacity 60-80-85%

18
Future Open Capacity Select a time period Count total (open and full) appointment slots within the period. This is the denominator. Then, count how many of those are open. This is the numerator. Graph this data on a run chart similar to the third next available appointment run chart.

19
Demand How much work is there?

20
Demand For Appointments Panel Universe” From Which Demand Comes Is……

21
Demand

22
Two Kinds of Demand External demand – work that comes from the world –Walk in –Call in –Write in –Referred in Internal demand – work we make for ourselves –Appointments we ask for in the future

23
Measuring Patient Demand Demand = –My patients appointment requests made today for today or future –My patients walk-ins to the clinic –Patients “deflected” to Urgent Care / Walk-in Clinic / Emergency Room/Partner –Done by hash marks on a paper

24
Predict Demand External From the “world” Walk in Call in Write in Includes “deflections” to other venues Internal From the provider herself

25
Which of these are counted as “demand”? Patient is seen today & rescheduled in 1 week? Patient walks in asking for appointment? Patient calls in requesting a med refill? Patient writes a letter requesting appointment? Pt. calls in asking the doctor to call her back? Pt. requests appointment, but we’re full, so they’re sent to the ER? Pt. e-mail medical question to the nurse? Patient asks for appt. today and receives it? Pt. schedules appt. for 1 year from today?

26
How do I measure demand? Option 1: “Tic” marks on paper –Often done 1 week per month –Allows one to categorize demand easily –Takes time to train staff and implement Option 2: (If schedule computerized) Computer report of “number of appointments made” –Misses requests for appointments ultimately not scheduled
 Computer report of number of appointments made –Misses requests for appointments ultimately not scheduled.")
27
Understanding Demand Demand is predictable Must understand total or “true” demand Must measure demand to really understand it

28
Demand Dr. Green Oct 14-18

29
Internal Demand External Demand

30
Check by hour of day

32
Supply How much resource is there to meet the demand?

33
Supply Measure Supply

34
Measuring Supply Number of appointments available in a given day. –Must consider appointment length and bookable hours available

35
How It Works Backlog Of Appts Supply Activity Or “Supply Used”

36
Measuring Supply 21 appointments per day (20 minutes each for 7 hours) 24 appointments per day (15 minutes each for 7 hours) 7 appointments per day (1 hour each for 7 hours) 15 appointments per day (20 min for 4 hours plus 1 hour each for 3 hours)
 24 appointments per day (15 minutes each for 7 hours) 7 appointments per day (1 hour each for 7 hours) 15 appointments per day (20 min for 4 hours plus 1 hour each for 3 hours)")
37
Supply Dr. Green Oct 14-18

38
Balance Supply and Demand

39
Dr. Green Supply/Demand Oct 14-18

40
Putting it Together

41
Individual Clinic Trend

42
Understand D and S Bottom Line 1. Establish equitable panels/case loads 2. Measure demand for appointments 3. Measure supply of appointments 4. Measure activity (“supply used”) 5. Use the information to plan and track improvements!
 5. Use the information to plan and track improvements!.")
43
Panels in PC Case Load in SC

44
Demand For Appointments Panel Universe” From Which Demand Comes Is……

45
Panels Why are panels important? –They define which patients have established a healing relationship with which providers –The establish and promote continuity –They equitably distribute the work (in PC) –They are the “universe” from which “demand” comes
 –They are the universe from which demand comes.")
46
Factors Affecting Panel Size Support Staff (10%+ variation) Rooms (5%+ variation) Midlevels (72% of MD panel size) Experience (Young providers less) New Providers (Take 15-18 months to build a full panel Part time vs Full time (equally productive)
 Rooms (5%+ variation) Midlevels (72% of MD panel size) Experience (Young providers less) New Providers (Take months to build a full panel Part time vs Full time (equally productive)")
48
Panel Effect of Panel Size Panel

50
Panel Report Example

51
Panels in Canada* *N ote, these are estimates and may not be accurate

52
Continuity “Of my patients visits to primary care, how many visits were to me?” My patients visit to me My patients total visits to primary care

53
ER Visits/Total Visits @ 10 Different Sites A16.15% B11.90% C17.26% D6.27% E2.84% F3.14% G0.89% H13.67% I2.52% J21.35%

55
Continuity Report Example

56
No Show No Show (“Lost Opportunity”) –% patients coded as no-show in computer –Conceptually includes those clinic appointments cancelled AFTER the appointment was supposed to occur.
 –% patients coded as no-show in computer –Conceptually includes those clinic appointments cancelled AFTER the appointment was supposed to occur.")
57
Lead Time Measure Demand Supply Lead Time

58
Check-in to Nurse Nurse to Room Dr. in to Dr. out Check-out to leave Lead Time Synchronization Point System Measuring Flow Through the Office

60
Time

61
Lead Time Study

62
How to Measure Cycle Time Option 1: Give patients a paper and ask them to record times they reach certain steps. Then tally the information. Option 2: Give patients a paper and ask staff to record times the patient reaches them. Option 3: Other

63
Flow Through the Office

64
Backlog Supply Activity Demand Lead Time Delay A B Measurement Summary (C)
")
65
Measurement Interpretation

66
Placeholder for BB movie

67
Clinic Weekly Demand, Supply

69
Average Clinic Delay

71
Possible Reasons for D>S Pattern With Delay Measure Stable or Decreasing No Shows Discontinuity Excessively Short RVI (Churning) Panel too big Deflections Other?
 Panel too big Deflections Other")
72
Average Clinic Delay

74
Possible Reasons for D>S Pattern With Delay Measure Increasing Growing demand or shrinking supply –Panels too big? –Losing providers?

75
Supply/Supply Used

77
Possible Reasons for Supply>Supply Used Panel too big Short RVI (Churning) Too little clinic supply relative to panel Consequence of Supply>Supply Used Increase productivity ($) Burnout (eventually)
 Too little clinic supply relative to panel Consequence of Supply>Supply Used Increase productivity ($) Burnout (eventually)")
78
Supply/Supply Used

79
Supply Variation Christmas Vacation Jamaica Winter Retreat Summer Family Holiday

80
Demand Variation FallWinterSummer Fall Winter

81
Advantages of Measuring Demand Plan for “big picture” variation –Seasons (Holiday, snowbird, return from snowbird, flu, vacation) –Contingency plan for staff –Vacation plan for staff Provides information about Red Zone Length
 –Contingency plan for staff –Vacation plan for staff Provides information about Red Zone Length")
82
TAKT Time Supply divided by demand Example: 480 minutes supply TAKT = 24 min 20 per day demand 480 minutes supplyTAKT = 16 min 30 per day demand

83
No-Shows 30% 10%

84
No-Shows 7% 45%

85
Case Study

86
Measurement Basics What is Aim? Is data connected to aim? What are the data definitions? Is the data collection sufficient? Is the data collection reasonably accurate? How is the data displayed? What does it mean? Where is it going?

87
What is the first question?

88
What is the next question?

89
Why is D>S?

90
What is the effect of no-shows on D>S?

91
What else could be causing more D than S? 89% Continuity 67% Continuity

92
What if continuity was better?

93
How “fast” do we need to go to do all the work today?

Similar presentations


>")
