Download presentation
Presentation is loading. Please wait.

1
Queue, Demand, Capacity, Variation and Flow
Essential measures for clinicians and managers

3
The queue Queues occur where demand has not been dealt with resulting in a backlog of work. The main reasons why queues develop is the mismatch between the variation in demand and capacity at specific times

4
The queue The NHS is a classic queue system
We place patients in queues all the time some patients are in multiple queues

5
The queue Every time the demands exceeds the capacity a queue is formed but Whenever capacity exceeds demand the extra capacity is lost or it is filled from the queue – often at short notice Filling slots at short notice can lead to longer waiting times and distort clinical priorities

6
Managing the queue - using evidence based tools
Ensure an element of patient choice in the booking process Use referral information services or referral management services Ensure waiting list data is accurate Reduce unnecessary “carve out”

7
Managing the queue Take unnamed referrals –refer to a service not a clinician Pool referrals Pool waiting lists See people in clinical and date order

9
Defining demand, capacity activity and queue
Demand on the services is all the requests or referrals into the service from all sources Capacity is all of the resources required to do the work and includes staff and equipment Activity is the work done, it is the throughput of the system Backlog is the demand which has not been dealt with – the queue or waiting list

10
Demand and capacity definitions:
Waiting list, queue = what we should have done Demand = All requests for a service = what we should do Capacity = what we could do Activity = what we did

11
Measuring demand, capacity activity and queue
Why is it important to understand the four measures of demand, capacity, activity and queue? To identify the bottleneck or constraint in the care process To increase capacity at the stage of the process where it will create the greatest outcome To reduce inappropriate demand to the constraint To redesign services or plan services

12
Measuring demand, capacity, activity and queue
Must be measured in the same units of time for the same period i.e. hourly, over a 24 hour period, weekly or monthly It is not possible to compare two or more items unless they are measured in the same unit of time It is important to compare the four measures on a single graph

13
Measure demand Multiply the number of patients referred from all sources by the time taken in minutes to process a patient Understand your demand – what it is (shape) and where it comes from (source)
 and where it comes from (source)")
14
Manage demand Right person, right place, right time
Understand and manage activity and capacity to meet changes in demand i.e. seasonal variation

15
Measure capacity Multiply the number of pieces of equipment by the time available in minutes available to the people with the necessary skills to use it

16
Measure activity Multiply the number of patients processed by the time in minutes it took to process each patient

17
Measure the backlog or queue
Multiply the number of patients waiting by the time it will take in minutes to process a patient

18
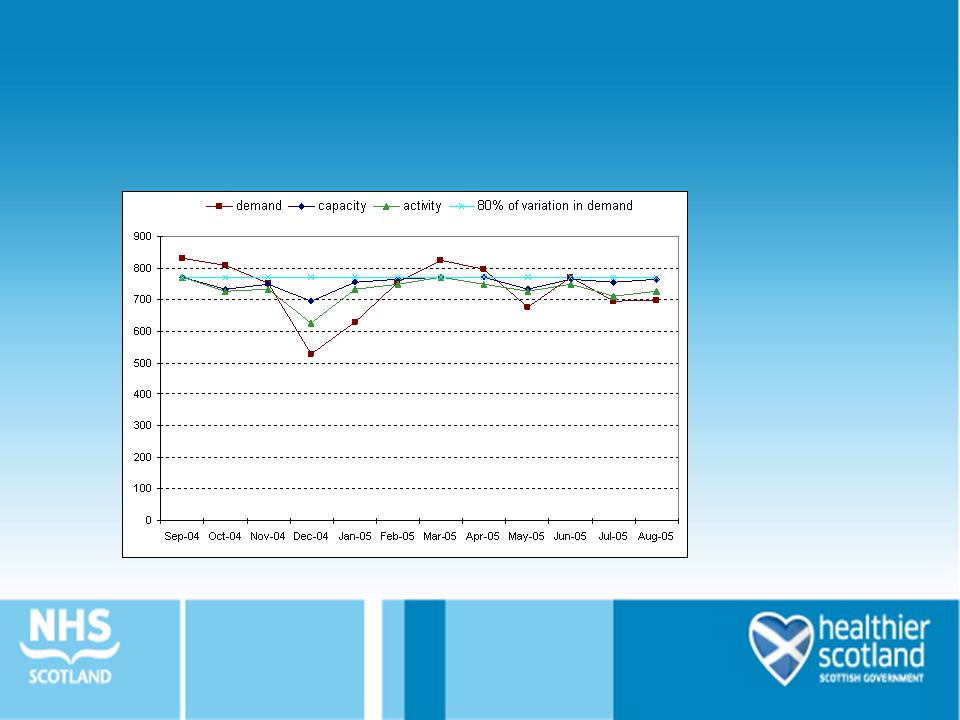
Compare the four measures
Convert the data on demand, capacity, activity and backlog or queue onto a common line graph

19
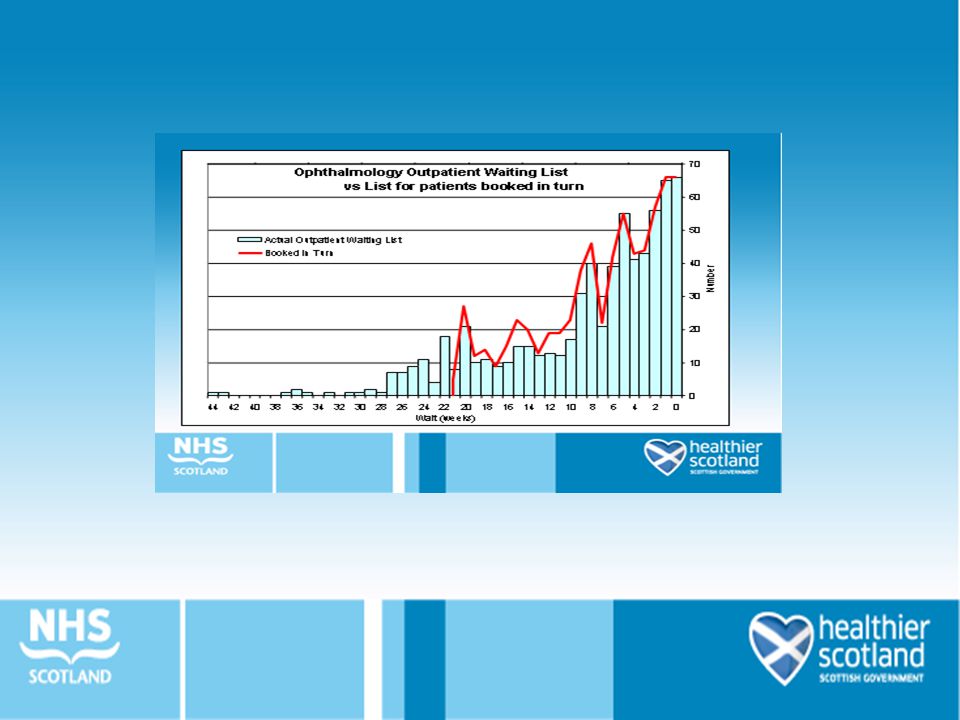
If av. Demand = av. Capacity, variation mismatch = queue
time Demand Capacity Can’t pass unused capacity forward

21
Understanding flow In the NHS flow is the movement of patients, information or equipment between departments, staff groups or organisations as part of their pathway of care Whilst process mapping looks at care processes from the patients perspective, flow analysis looks at the care process from a unit or departmental perspective

22
Flow modelling Supports service improvement – at specific bottlenecks or constraints, in specific clinical areas, or across whole health systems This tool will not tell you what should change – process mapping helps with identifying that Flow modelling will show how well scarce resources are being used and how much room there is for improvement

23
How to build the flow model
Define the patient group to be analysed and define the start and end points of the flow map In straightforward care processes a process map and process times will provide sufficient information to examine patient flow The Unscheduled Care Collaborative made extensive use of flow mapping and modelling

24
Understanding variation
Why is it important to understand variation Because the mismatch between the variation in demand and capacity is one of the main reasons that queues occur in the NHS

26
What variability? GP Number of patients Number of problems
Investigations Length of appointments

27
What variability? Outpatients Number of referrals Number of staff
Investigations needed Length of consultation

28
What variability? Ward -Length of pre-admission stay
-Length of post-op stay -Intensity of nursing required -Staffing levels

29
Variability Theatre Number of cases Length of cases Anaesthetic time
Recovery time Turnaround time

30
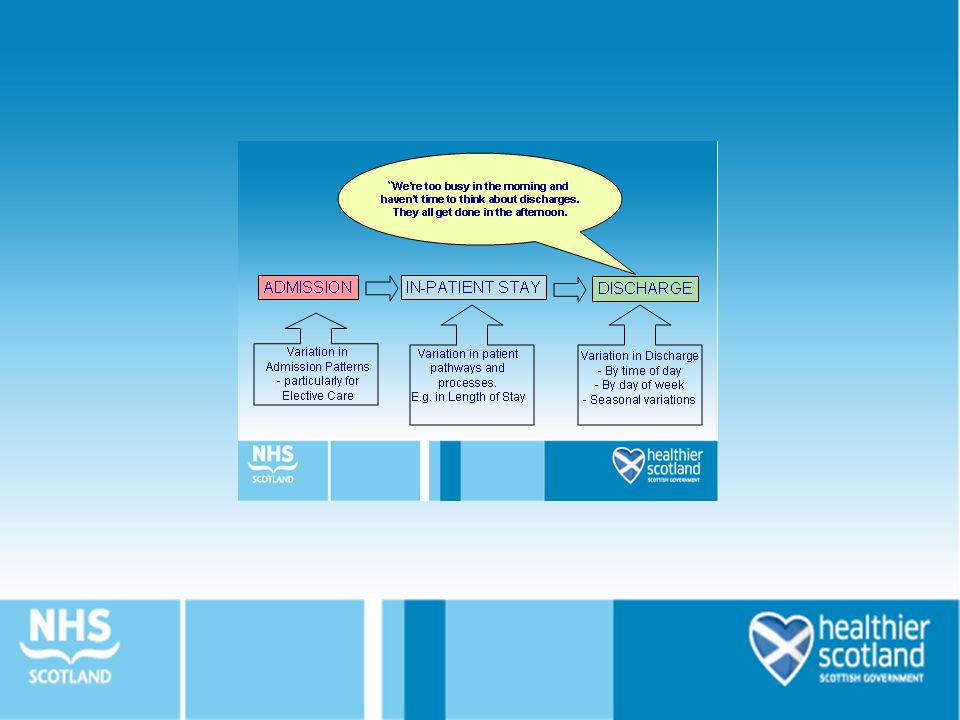
Bed availability - an example of the
problem of variation ADMISSION IN-PATIENT STAY DISCHARGE Variation in patient pathways and processes. E.g. in Length of Stay Variation in Discharge - By time of day - By day of week - Seasonal variations Variation in Admission Patterns - particularly for Elective Care

31
ADMISSION IN-PATIENT STAY DISCHARGE
“We always bring our hips in on Tuesday !” ADMISSION IN-PATIENT STAY DISCHARGE Variation in Admission Patterns - particularly for Elective Care Variation in Discharge - By time of day - By day of week - Seasonal variations Variation in patient pathways and processes. E.g. in Length of Stay

33
Understanding demand and capacity by hour of the day

37
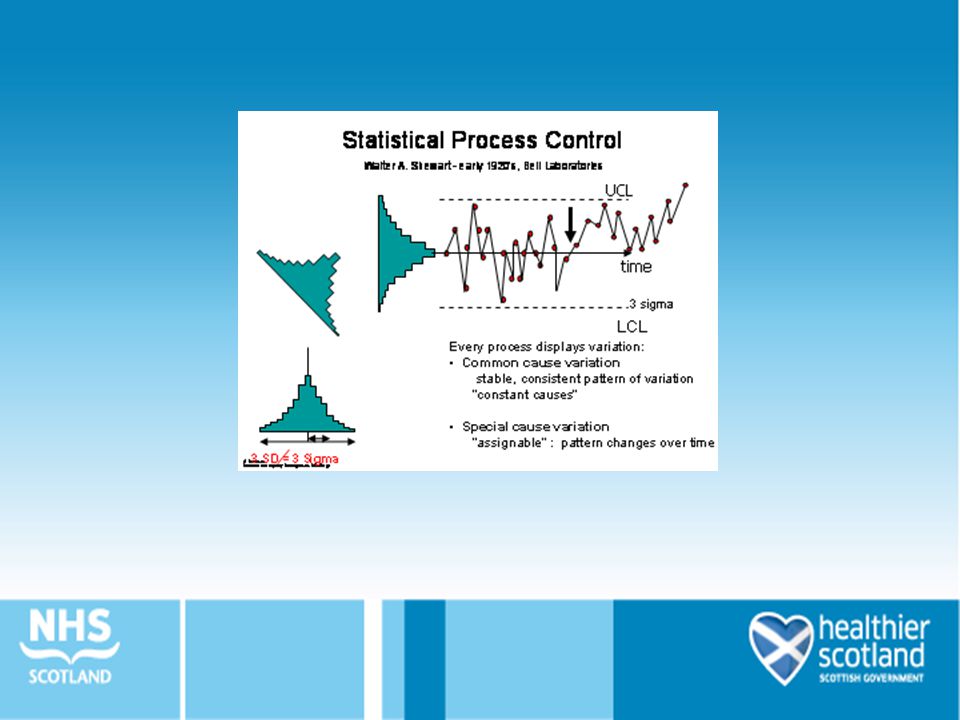
Analysing variation Statistical Process Control Two types of variation
Common cause – that which is natural and to be expected Special cause – which produces unusual or unexpected variation

38
Statistical process control
Two basic charts The run chart – a line graph – an ideal method of comparing sets of data The control chart – also run charts but with two distinct differences i.e.

40
Any questions?

Similar presentations


>")