Download presentation
Presentation is loading. Please wait.

1
Teleconnections: physical processes and applications Steven Feldstein April 2, 2009 Climate Prediction Center

2
The dominant Northern Hemisphere teleconnection patterns North Atlantic Oscillation Pacific/North American pattern

3
NORTH ATLANTIC OSCILLATION University of Hamburg

4
Earliest NAO observations Norse (Viking) settlers arrived in Greenland in CE 985. The Norse, who appeared to be very interested observers of the weather, also seemed to be aware of teleconnection patterns in the North Atlantic basin. There was an anonymous Norwegian book (approx. CE 1230), entitled the `King's Mirror'. This book, in the form of a discussion between father and son, wrote that severe weather in Greenland coincides with warmer weather at distant locations, and vice versa.
, entitled the `King s Mirror . This book, in the form of a discussion between father and son, wrote that severe weather in Greenland coincides with warmer weather at distant locations, and vice versa..")
5
Danish missionary Hans Egede (1745) wrote: “In Greenland, all winters are severe, yet they are not alike. The Danes have noticed that when the winter in Denmark was severe, as we perceive it, the winter in Greenland in its manner was mild, and conversely.” Hans Egede map in “History of Greenland” Walker (1932) used correlation analysis to find the dominant teleconnection patterns, including the NAO.
 used correlation analysis to find the dominant teleconnection patterns, including the NAO..")
6
SEASONAL ROTATED EOFS DAILY ROTATED EOFS seasonal NAO daily NAO seasonal PNA daily PNA Feldstein (2000) Corr=0.98Corr=0.97
 Corr=0.98Corr=0.97")
7
NAOPNA Period (years) Power Period (years) Power POWER SPECTRA An AR(1) process Power spectral density function Feldstein (2000) = 9.5 days = 7.7 days
 Power Period (years) Power POWER SPECTRA An AR(1) process Power spectral density function Feldstein (2000) = 9.5 days = 7.7 days")
8
DAILY NAO INDEX & FORECAST (since ~2002) Climate Prediction Center
 Climate Prediction Center")
9
Implication for interannual variability? Feldstein (2002)
")
10
Climate Noise: relationship between daily & interannual NAO variability Feldstein (2002) Most interannual NAO variability is from Climate Noise
 Most interannual NAO variability is from Climate Noise")
11
Physical processes of the NAO Projections Streamfunction tendency equation NAO Feldstein (2003)
")
12
NAO AMPLITUDE Nonlinear Linear High-frequency eddies Low-frequency eddies Divergence Vorticity Advection LinearNonlinear + NAO DRIVING MECHANISMS Feldstein (2003)
")
13
Benedict et al. (2004) Day 1 Day 4 Day 7 Day 10
 Day 1 Day 4 Day 7 Day 10")
14
MODEL SIMULATION NAO -NAO + Franzke et al. (2004) Initial perturbation Area of small potential vorticity gradient
 Initial perturbation Area of small potential vorticity gradient.")
15
Summary of Physical Processes Prominent Northern Hemisphere teleconnection patterns have a timescale of 7-10 days Interannual variability of most teleconnection patterns arises from climate noise, not necessarily from SST and/or sea ice The NAO is comprised of the remnants of breaking synoptic-scale waves; nonlinear process The PNA is primarily a linear dynamical process

16
Investigation of North Pacific Variability (Continuum Perspective) Describe the continuum of North Pacific SLP patterns based on daily, wintertime SLP data (1958-2005) Investigate intraseasonal (MJO) and interannual (ENSO) variability of North Pacific SLP field from continuum perspective Describe intraseasonal and interannual temporal changes in the frequency distribution of North Pacific SLP patterns in connection with the MJO and ENSO
 Describe the continuum of North Pacific SLP patterns based on daily, wintertime SLP data ( ) Investigate intraseasonal (MJO) and interannual (ENSO) variability of North Pacific SLP field from continuum perspective Describe intraseasonal and interannual temporal changes in the frequency distribution of North Pacific SLP patterns in connection with the MJO and ENSO")
17
Tropical Convection Associated with the Madden-Julian Oscillation (MJO) Phase 1 Phase 2 Phase 3 Phase 4 Phase 5 Phase 6 Phase 7 Phase 8 Time between Phases ~ 6 days 180۫° 60۫°W 20۫°E Dominant intraseaonal oscillation in the tropics MJO cycle: 30-60 days Shading OLR Time between phases ~ 6 days From Wheeler and Hendon (2004)
 Phase 1 Phase 2 Phase 3 Phase 4 Phase 5 Phase 6 Phase 7 Phase 8 Time between Phases ~ 6 days 180۫° 60۫°W 20۫°E Dominant intraseaonal oscillation in the tropics MJO cycle: days Shading OLR Time between phases ~ 6 days From Wheeler and Hendon (2004)")
18
Continuum of North Pacific SLP Patterns Timescale of each pattern ~ 5-10 days Lower Numbers: - Low Pressure - Positive PNA Higher Numbers: - High Pressure - Negative PNA 1 2 3 4 5 6 7 8 9 10 11 12 13 14 15 16 17 18 19 20 21 22 23 24 Timescale of each pattern ~ 5-10 days

19
Relationship between North Pacific SLP Patterns and the MJO Phase 1 Pattern 23Pattern 24 -100: No occurrence 0: Same frequency of occurrence as average 100: Twice as frequent as average 200: Three times as frequent as average Number of days after the onset of the MJO Phase Phase 2 Phase 3Phase 4 Pattern 2 Phase 5 120°E Phase 6Phase 7Phase 8 120 E Black: Significant above 99% Confidence Level Gray: Significant above 95% Confidence Level

20
Pattern Number All Winter Months La NiñaNeutral ENSOEl Niño 13.7 0.8 2.6 7.9 24.03.14.14.6 33.43.03.53.4 44.85.23.95.8 56.04.95.57.7 64.04.34.42.9 74.3 1.6 4.4 6.5 83.93.23.3 5.5 94.44.63.75.5 104.54.34.05.6 115.25.7 4.0 125.53.6 6.5 5.7 134.33.75.03.7 143.13.23.72.0 154.14.24.53.5 164.25.14.6 2.7 174.95.74.35.2 183.8 4.62.5 194.1 6.1 4.4 2.0 204.1 6.5 3.7 2.6 214.0 6.1 3.3 223.85.04.02.6 232.61.83.12.4 243.24.62.92.6 Relationship between North Pacific SLP Patterns and ENSO: Frequency of Occurrence (%) during La Niña, Neutral ENSO, and El Niño Months
 during La Niña, Neutral ENSO, and El Niño Months")
21
Implications of the Tropical OLR/North Pacific SLP Relationships Tropical convection associated with both the MJO and ENSO excites the PNA pattern. The MJO and ENSO, however, excite different members of the PNA continuum. North Pacific SLP field may be predictable 2 to 3 weeks in advance.

22
APPLICATION: Middle Eastern precipitation Is Middle East precipitation associated with the variability of a particular teleconnection pattern?

23
Data and methodology Data: daily precipitation data averaged over 12 sites in Israel. ( Ziv et al. 2006, Quart. J. Roy. Meteorl. Soc.) Calculate composite 300-hPa geopotential height field for dates with extreme precipitation Daily SL (Southern Levant) index obtained by projecting the daily 300-hPa geopotential height field onto composite pattern Feldstein and Dayan (2008) Middle Eastern precipitation
 Calculate composite 300-hPa geopotential height field for dates with extreme precipitation Daily SL (Southern Levant) index obtained by projecting the daily 300-hPa geopotential height field onto composite pattern Feldstein and Dayan (2008) Middle Eastern precipitation.")
24
Composite 300-hPa geopotential height field: Southern Levant (SL) pattern H L Middle Eastern precipitation Feldstein and Dayan (2008)
 pattern H L Middle Eastern precipitation Feldstein and Dayan (2008)")
25
300-hPa geopotential evolution - Middle Eastern precipitation Feldstein and Dayan (2008) -6 days-4 days-2 days 0 days+2 days+4 days +5 days+7days+9 days
 -6 days-4 days-2 days 0 days+2 days+4 days +5 days+7days+9 days")
26
Wave Packet & Middle East precip Wave packet first observed in the northeast Pacific. The packet travels 3/4 of the distance around the earth before decaying over the northwest Pacific Wave packet amplifies as it passes over western Europe and the Middle East. This coincides with enhanced precipitation over the Israel. The wave packets have an eastward group velocity with a near zero phase velocity. Are these wave packets related to the circumglobal teleconnection pattern (Branstator 2002)?
 .")
27
Circumglobal Teleconnection Pattern Time-averaged V over persistent event (lag -6 to lag +9 days) Correlation with EOF1 =0.83Correlation with EOF1 =-0.72 Wave packets associated with SL precip 300 wetdry EOF1
 Correlation with EOF1 =0.83Correlation with EOF1 =-0.72 Wave packets associated with SL precip 300 wetdry EOF1")
28
Feldstein and Dayan (2008) -6 days-4 days-2 days 0 days+2 days+4 days +5 days+7days+9 days Wave packet evolution & potential vorticity gradient
 -6 days-4 days-2 days 0 days+2 days+4 days +5 days+7days+9 days Wave packet evolution & potential vorticity gradient")
29
Some Implications The circumglobal wave packet may be a fundamental pattern of variability. The circumglobal wave packet can influence interannual Middle East precipitation through climate noise. Global warming --> poleward movement of extratropical wave guide (rising of tropopause) --> circumglobal wave packets move north of the Middle East --> disappearance of Jordan and Euphrates Rivers (Kitoh et al. 2008) Forecasting: circumglobal wave packets used for 7-day forecast of rain-gauge level precipitation with a hidden Markov model (Samuels, Lall, and Feldstein 2008) (water resources planning)
 --> circumglobal wave packets move north of the Middle East --> disappearance of Jordan and Euphrates Rivers (Kitoh et al. 2008) Forecasting: circumglobal wave packets used for 7-day forecast of rain-gauge level precipitation with a hidden Markov model (Samuels, Lall, and Feldstein 2008) (water resources planning).")
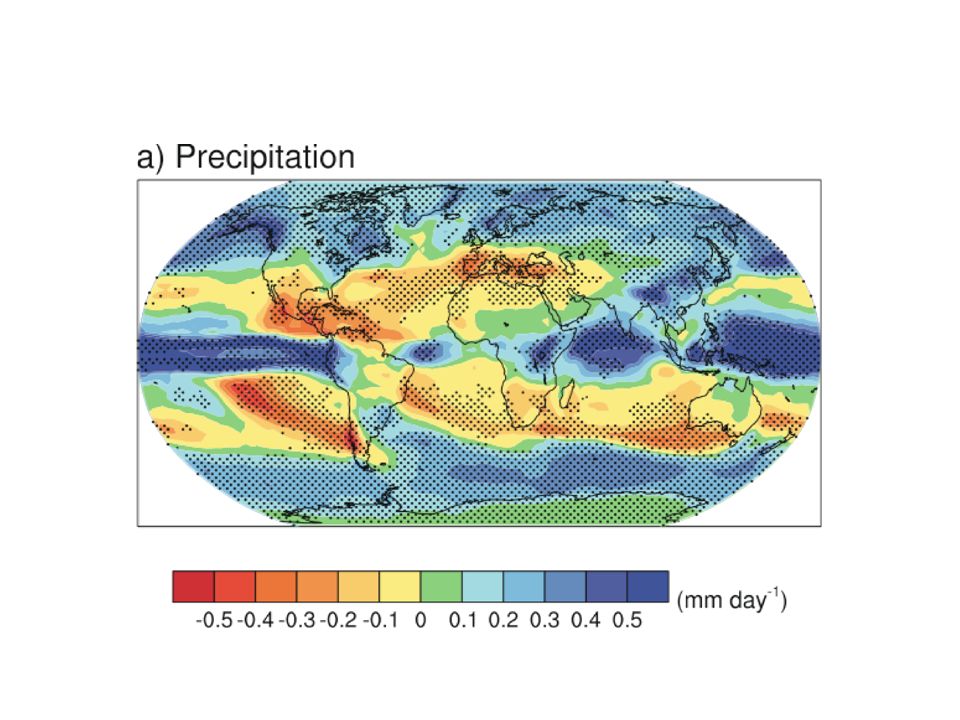
30
Precipitation change: ave(2080-2099) - ave(1980-1999) IPCC 2007
 - ave( ) IPCC 2007")
31
Concluding remarks Most of the major teleconnection patterns have a time scale of less than 10 days Most of the interannual variability of the major teleconnection patterns arises from climate noise The NAO arises from nonlinear processes (wave breaking), while the PNA arises from linear processes North Pacific and North Atlantic variability can be understood in terms of a continuum of teleconnection patterns The circumglobal wave packet excites Middle East precipitation Global warming: poleward movement of extratropical wave guide --> circumglobal wave packets bypass the Middle East.
, while the PNA arises from linear processes North Pacific and North Atlantic variability can be understood in terms of a continuum of teleconnection patterns The circumglobal wave packet excites Middle East precipitation Global warming: poleward movement of extratropical wave guide --> circumglobal wave packets bypass the Middle East.")
32
Middle East Precipitation Precipitation occurs when a circumglobal wave packet passes over western Europe & the Middle East The wave packet is initiated over the northeast Pacific, travels eastward, until it decays over the northwest Pacific; group velocity: about 25 degrees longitude/day phase velocity: close to zero Interannual variability of Middle East precip (droughts and floods) is associated with the winter-mean phase of wave packet. Much of the interannual Middle East precip variability is due to climate noise The circumglobal teleconnection pattern can be understood as a time average of the circumglobal wave packet confined to subtropical & extratropical wave guides (jets): a fundamental pattern Global warming: poleward movement of extratropical wave guide (rising of tropopause) circumglobal wave packets bypass the Middle East.
: a fundamental pattern Global warming: poleward movement of extratropical wave guide (rising of tropopause) circumglobal wave packets bypass the Middle East..")
33
Nonlinear eddy fluxes Vorticity advection Planetary vorticity advection Relative vorticity advection EA/WR streamfunction tendency equation LHS of streamfunction tend. equation RHS of streamfunction tend. equation Vorticity advection + nonlinear eddy fluxes Divergence

35
Circumglobal Teleconnection Pattern (Branstator 2002) -remote ENSO response -global change experiments From from NCAR Community Climate Model
 -remote ENSO response -global change experiments From from NCAR Community Climate Model")
36
7-day Precipitation forecast using nonhomogeneous hidden Markov model external parameter: circumglobal wave packet Samuels, Lall, Feldstein (2008)
")
37
Are the previous solutions robust? NAO + (35 model runs) NAO - (35 model runs) Franzke et al. (2004) low-lat initial perturbation high-lat initial perturbation mid-lat initial perturbation
 low-lat initial perturbation high-lat initial perturbation mid-lat initial perturbation.")
38
Are teleconnection patterns characterized by 1. a small number of recurrent regimes (NAO, PNA, etc.): enhanced predictability or 2. a continuum of patterns (NAO- and PNA-like patterns): reduced predictability Regimes vs. Continuum Franzke and Feldstein (2005)
: enhanced predictability or 2. a continuum of patterns (NAO- and PNA-like patterns): reduced predictability Regimes vs. Continuum Franzke and Feldstein (2005).")
39
Teleconnections become non-orthogonal BASIS FUNCTIONS : teleconnection patterns (e.g., NAO, PNA spatial patterns) : amplitude time series (e.g., NAO, PNA indices) Regimes vs. Continuum Define teleconnections as a sequence of one-point regression patterns Franzke and Feldstein (2005)
.")
40
Joint Probability Density Functions Teleconnections form a continuum WP NAO EA PNA Franzke and Feldstein (2005)
")
Similar presentations


: A global teleconnection, strongest in the Pacific, between the tropical oceans and.>")
>")

?>")


 and k-means clustering: Part 2 Steven Feldstein The Pennsylvania State University Trieste, Italy, October 21, 2013 Collaborators:>")