Download presentation
Presentation is loading. Please wait.

1
Climate Change and Agriculture -Vulnerability and Impact Analysis
S.Senthilnathan Assistant Professor Tamil Nadu Agricultural University

2
VULNERABILITY ANALYSIS
S. Senthilnathan Assistant Professor (Agrl. Economics), TNAU K.Palanisami Director, IWMI-TATA Water Policy Program, Hyderabad C.R. Ranganathan Professor, Mathematics, TNAU
, TNAU. K.Palanisami. Director, IWMI-TATA Water Policy Program, Hyderabad. C.R. Ranganathan. Professor, Mathematics, TNAU.")
3
Definitions of Vulnerability
vulnerability has three components (IPCC): Exposure, Sensitivity and Adaptive capacity. Exposure can be interpreted as the direct danger (i.e., the stressor), and the nature and extent of changes to a region’s climate variables (e.g., temperature, precipitation, extreme weather events). Sensitivity describes the human–environmental conditions that can worsen the hazard or trigger an impact. Adaptive capacity represents the potential to implement adaptation measures that help avert potential impacts (I) V = I - AC
: Exposure, Sensitivity and Adaptive capacity. Exposure can be interpreted as the direct danger (i.e., the stressor), and the nature and extent of changes to a region’s climate variables (e.g., temperature, precipitation, extreme weather events). Sensitivity describes the human–environmental conditions that can worsen the hazard or trigger an impact. Adaptive capacity represents the potential to implement adaptation measures that help avert potential impacts (I) V = I - AC.")
4
Construction of Composite Vulnerability Index
Vulnerability to CC is a comprehensive multi-dimensional process influenced by large number of related indicators. Composite indices are used as yardsticks to gauge the vulnerability of each region to CC. It helps to classify the sub-regions/districts based on a set of large multivariate data. The information contained in the large set is transformed into a small set of indices which would provide a convenient method for classification.

5
Normalization of Indicators using Functional Relationship
When the observed values are related positively to the vulnerability (for eg. higher the variability in rainfall, higher the vulnerability), the standardization is achieved by employing the formula yid = (Xid – Min Xid) / (Max Xid- Min Xid) When the values are negatively related to the vulnerability (for eg. higher the productivity of a crop, lower the vulnerability) yid = (Maxid –Xid) / (Max Xid- Min Xid) Index is constructed in such a way that it always lies between 0 and 1 so that it is easy to compare regions.
, the standardization is achieved by employing the formula. yid = (Xid – Min Xid) / (Max Xid- Min Xid) When the values are negatively related to the vulnerability (for eg. higher the productivity of a crop, lower the vulnerability) yid = (Maxid –Xid) / (Max Xid- Min Xid) Index is constructed in such a way that it always lies between 0 and 1 so that it is easy to compare regions.")
6
Moderately Vulnerable
The probability distribution, which is widely used in this context, is the Beta distribution. The Beta distribution is skewed. Let and be the linear intervals such that each interval has the same probability weight of 20 per cent. 1. Less vulnerable If 2. Moderately Vulnerable 3. Vulnerable 4. Highly vulnerable 5. Very highly vulnerable

7
Application to Tamil Nadu State, India

8
Indicators for calculating Vulnerability Index
Demographic Vulnerability Climatic Vulnerability Agricultural Vulnerability Occupational 1. Density of population Literacy rate Variance in 1.annual rainfall 2.south west monsoon 3.north east monsoon 4.maximum temperature 5.minimum temperature 6. No. of extreme events (harmful days >35 deg C) 1. Productivity of major crops 2.Cropping intensity 3.Irrigation intensity 4.Net area sown 5.Livestock population 1.No of cultivators 2.Agricultural labourers 3. Coastal length (Km)
 1. Productivity of major crops. 2.Cropping intensity. 3.Irrigation intensity. 4.Net area sown. 5.Livestock population. 1.No of cultivators. 2.Agricultural labourers. 3. Coastal length (Km)")
9
Vulnerability Index and ranks for the coastal districts, TN
S. No Districts Vulnerability Index Rank 1 Thiruvallur 0.472 7 2 Kancheepuram 0.491 6 3 Cuddalore 0.500 5 4 Nagapattinam 0.545 Thiruvarur 0.468 8 Tanjore 0.429 10 Pudukkotai 0.533 Ramnad 0.607 9 Thoothukudi 0.515 Tirunelveli 0.342 11 Kanyakumari 0.442

10
Classification of coastal districts in terms of vulnerability
S. No Classification Districts 1 Less vulnerable Tanjore, Tirunelveli 2 Moderately Vulnerable Thiruvarur, Kanyakumari 3 Vulnerable Thiruvallur, Kancheepuram, Cuddalore 4 Highly vulnerable Pudukkotai, Thoothukudi 5 Very high vulnerable Ramnad, Nagapattinam

11
Vulnerability Index - Methodology

12
Software for VI

13
Sample Output - 1

14
Sample Output-2

15
A Tutorial on Vulnerability Index Software Package

16
Quantifying the Impact of climate change on Rice production in Tamilnadu
S.SENTHILNATHAN H.ANNAMALAI V.PRASANNA JAN HAFNER Tamil Nadu Agricultural University, India & IPRC, Hawaii, USA

17
IPRC Regional climate model output into Applications
To study the possible Impact on Rice production For current climate a. with IMD observational data ( ) b. with ERA-Interim reanalysis data ( ) c. with IPRC_RegCM forced by ERA-Interim ( ) d. with IPRC_RegCM forced by GFDL ( ) For future climate scenarios a. with IPRC_RegCM forced by GFDL ( ) b. with IPRC_RegCM forced by GFDL ( )
 b. with ERA-Interim reanalysis data ( ) c. with IPRC_RegCM forced by ERA-Interim ( ) d. with IPRC_RegCM forced by GFDL ( ) For future climate scenarios. a. with IPRC_RegCM forced by GFDL ( ) b. with IPRC_RegCM forced by GFDL ( )")
18
Agro-climatic Zones of Tamilnadu

19
Agro Economic Model - Ricardian Approach
To assess the climate change induced impact on agriculture, many author used this approach. Climate change impacts are measured as changes in net revenue or land value (Dinar et al, 1998, Mendelsohn et al., 2001 and Kavikumar, 2003) The Ricardian model is specified as follows R= f(P, T, K) R is land value/net revenue per hectare T and P are temperature and precipitation K represents the control variables such as soil characteristics, literacy, population density etc Analysis is carried out using pooled cross-sectional, time-series data
 The Ricardian model is specified as follows. R= f(P, T, K) R is land value/net revenue per hectare. T and P are temperature and precipitation. K represents the control variables such as soil characteristics, literacy, population density etc. Analysis is carried out using pooled cross-sectional, time-series data.")
20
Agro-Economic Model Y = Rice Yield
Xit = Economic variables – Labour, fertilizer, irrigation, soil types etc. Wit = Climate variables – Rainfall, Tmax, Tmin and SR C = Cross-sectional fixed effect θ = Fixed effects for years i = Cross-sectional unit t = Year β and γ are respective co-efficients

21
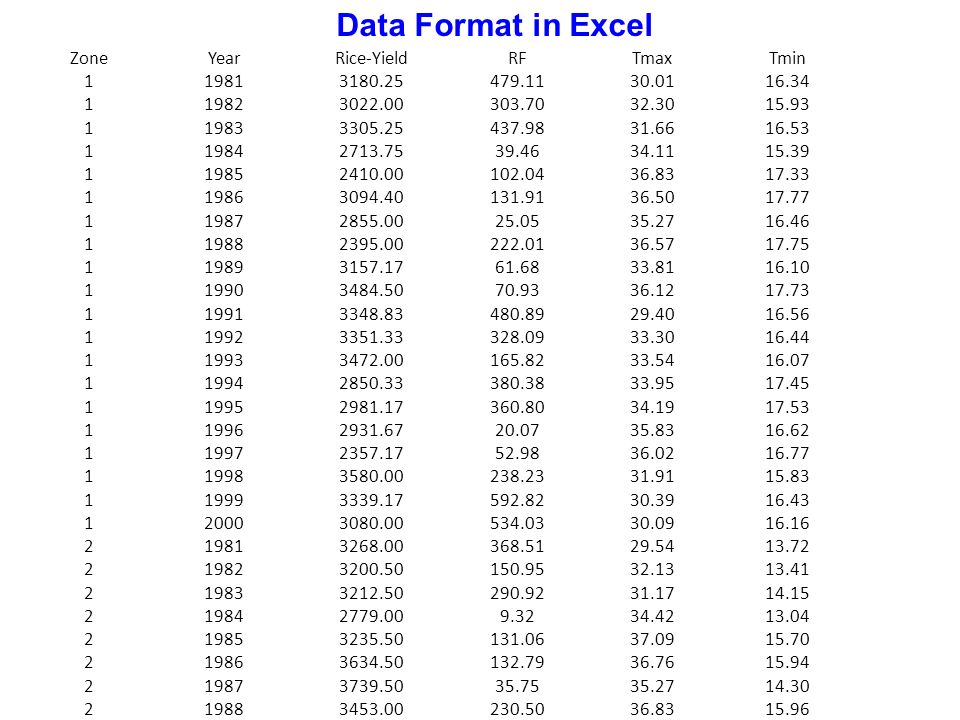
Data Format in Excel Zone Year Rice-Yield RF Tmax Tmin 1 1981 3180.25
479.11 30.01 16.34 1982 303.70 32.30 15.93 1983 437.98 31.66 16.53 1984 39.46 34.11 15.39 1985 102.04 36.83 17.33 1986 131.91 36.50 17.77 1987 25.05 35.27 16.46 1988 222.01 36.57 17.75 1989 61.68 33.81 16.10 1990 70.93 36.12 17.73 1991 480.89 29.40 16.56 1992 328.09 33.30 16.44 1993 165.82 33.54 16.07 1994 380.38 33.95 17.45 1995 360.80 34.19 17.53 1996 20.07 35.83 16.62 1997 52.98 36.02 16.77 1998 238.23 31.91 15.83 1999 592.82 30.39 16.43 2000 534.03 30.09 16.16 2 368.51 29.54 13.72 150.95 32.13 13.41 290.92 31.17 14.15 9.32 34.42 13.04 131.06 37.09 15.70 132.79 36.76 15.94 35.75 14.30 230.50 15.96 20.88 33.97 13.89
22
Regression Statistics
Regression Output SUMMARY OUTPUT Regression Statistics Multiple R R Square Adjusted R Square Standard Error Observations 120 ANOVA df SS MS F Significance F Regression 3 1.17E-07 Residual 116 Total 119 Coefficients t Stat P-value Lower 95% Upper 95% Lower 95.0% Upper 95.0% Intercept 3.46E-13 RF Tmax -5.978 2.55E-08 Tmin

23
Year Yield change (Kg/ha) % change 2050 362.19 10.78 2100 728.35 21.67
Variables Coefficients GFDL-Baseline TN GFDL- 2050 TN GFDL-2100 TN Constant RF 173.86 421.94 361.83 Tmax 32.89 33.63 36.68 Tmin 17.16 19.20 21.35 Ybase = ( *173.86) + ( *32.89) + (-1.249*17.16) = Y2050 = ( *421.94) + ( *33.63) + (-1.249*19.20) = Y2100 = ( *361.83) + ( *36.68) + (-1.249*21.35) = Year Yield change (Kg/ha) % change
 + ( *32.89) + (-1.249*17.16) = Y2050 = ( *421.94) + ( *33.63) + (-1.249*19.20) = Y2100 = ( *361.83) + ( *36.68) + (-1.249*21.35) = Year Yield change (Kg/ha) % change")
24
Data Format in Excel Zone Year Rice-Yield RF Tmax Tmin Z1 Z2 Z3 Z4 Z5
1981 479.11 30.01 16.34 1982 303.70 32.30 15.93 1983 437.98 31.66 16.53 1984 39.46 34.11 15.39 1985 102.04 36.83 17.33 1986 131.91 36.50 17.77 1987 25.05 35.27 16.46 1988 222.01 36.57 17.75 1989 61.68 33.81 16.10 1990 70.93 36.12 17.73 1991 480.89 29.40 16.56 1992 328.09 33.30 16.44 1993 165.82 33.54 16.07 1994 380.38 33.95 17.45 1995 360.80 34.19 17.53 1996 20.07 35.83 16.62 1997 52.98 36.02 16.77 1998 238.23 31.91 15.83 1999 592.82 30.39 16.43 2000 534.03 30.09 16.16 2 368.51 29.54 13.72 150.95 32.13 13.41 290.92 31.17 14.15 9.32 34.42 13.04 131.06 37.09 15.70 132.79 36.76 15.94 35.75 14.30 230.50 15.96 20.88 33.97 13.89

25
Prediction Variables Coefficients GFDL-Baseline-Zone-Avgs 1.00 2.00
3.00 4.00 5.00 6.00 Constant RF 0.38 GFDL Base-RF 251.40 191.25 185.75 175.12 152.36 87.27 Tmax -26.11 GFDL Base-Tmax 33.59 33.56 32.25 34.65 32.86 30.45 Tmin -71.85 GFDL Base-Tmin 16.66 14.49 14.58 16.79 18.11 22.32 Zone-1 Zone-2 Zone-3 Zone-4 Zone-5 Zone-6 0.00 Zone Zone 1 Zone 2 Zone 3 Zone 4 Zone 5 Zone 6 TN GFDL-Baseline GFDL- 2050 GFDL- 2100 Yield Change Z1 Z2 Z3 Z4 Z5 Z6 Baseline GFDL50 -74.23 -68.39 -55.06 -96.86 -23.09 GFDL100 % change-2050 2.44 1.92 1.51 3.53 3.23 0.58 % change-2100 10.53 9.18 8.52 12.79 11.42 7.31

26
Impact Analysis - Methodology

27
Thank you

Similar presentations


 Regression Estimation. Simple Linear Regression: review of least squares procedure 2.>")


