Download presentation
Presentation is loading. Please wait.

1
SACHIN SINHA, JOINT SECRETARY & DIRECTOR OF CENSUS OPERATIONS, MADHYA PRADESH 27 th FEBRUARY, 2015 CENSUS OF INDIA 2011 DATA DISSEMINATION WORKSHOP 1

2
2

3
Number of Administrative units in 2011 Census Madhya Pradesh 20012011 Divisions 9 10 Districts 45 50 Sub-districts 259 342 Towns 394 476 Statutory Towns339364 Census Towns55112 Villages 55,393 54,903 Inhabited villages52,11751,929 Uninhabited villages3,2762,974 3

4
4

5
POPULATION - CENSUS 2011 INDIA Total Population of the country is 1,21,08,54,977 (or 121.09 crore ) MADHYA PRADESH Total Population of the state is 7,26,26,809 (or 7.26 crore) As on 0.00 Hrs. of 1 st March, 2011 5

6
The population of Madhya Pradesh is more than that of many countries like Thailand, France, United Kingdom, Italy, Myanmar and South Africa. Its population is slightly lower than that of countries like Iran, Turkey and Germany. The population of Madhya Pradesh is higher than the combined population of Australia, Sri lanka and Afghanistan Sixteen countries in the world have population more than that of Madhya Pradesh. The increase in population during decade is higher than the total population of Greece (1.13 crore) A Comparison: Madhya Pradesh and Countries Madhya Pradesh and Other Countries Population (in Thousand) Germany82,057 Turkey75,705 Iran75,078 Madhya Pradesh72,627 Thailand68,139 France62,637 United Kingdom61,899 Italy60,098 Myanmar50,496 South Africa50,492 (Source: World Population Prospects, the 2008 Revision 2010) 6
 A Comparison: Madhya Pradesh and Countries Madhya Pradesh and Other Countries Population (in Thousand) Germany82,057 Turkey75,705 Iran75,078 Madhya Pradesh72,627 Thailand68,139 France62,637 United Kingdom61,899 Italy60,098 Myanmar50,496 South Africa50,492 (Source: World Population Prospects, the 2008 Revision 2010) 6.")
7
Persons with disability Adolescent & Youth Households with number of aged person 60 years and above Non workers by Main activity Households and number of members/female members seeking/ available for work Houseless households by household size Households by no. of literates in the household 7

8
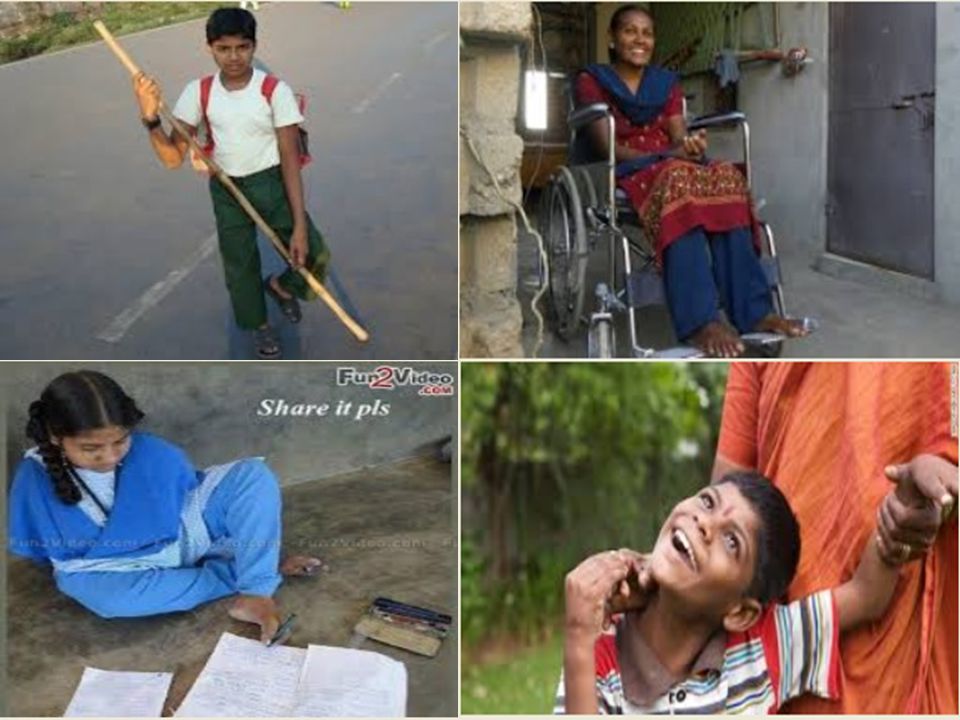
PERSONS WITH DISABILITY 8

10
Total disabled population and percentage to total population Total disabled populationPercentage to total population INDIA 2,68,14,9942.21 (2011) 2,19,06,7692.13(2001) MADHYA PRADESH 15,51,9312.14 (2011) 14,08,5282.33(2001) 10 Type of disability (% of total disabled) In seeingIn HearingIn Speech In Movement Mental Retardation Mental Illness Any Other Multiple Disability INDIA 18.7718.927.4520.285.622.7018.387.89 MADHYA PRADESH 17.4517.234.4726.085.012.5519.018.21
 2,19,06, (2001) MADHYA PRADESH 15,51, (2011) 14,08, (2001) 10 Type of disability (% of total disabled) In seeingIn HearingIn Speech In Movement Mental Retardation Mental Illness Any Other Multiple Disability INDIA MADHYA PRADESH")
11
TotalRuralUrban PersonsMalesFemalesPersonsMalesFemalesPersonsMalesFemales India2.212.402.012.242.432.032.172.341.98 M.P.2.142.361.892.102.331.872.222.461.97 Percentage of disabled to total population by residence

12
ADOLESCENT & YOUTH 12

13
Countries Adolescent Population ('000) Proportion of Adolescent Population WORLD6,99,80217.3 India* 2,53,236 20.9 China1,91,26414.1 United States of America43,05213.8 Indonesia43,43218.0 Brazil33,83217.3 Pakistan39,96223.1 Nigeria35,60422.3 Bangladesh32,24321.3 Russian Federation15,26910.6 Japan11,9849.4 Source : World Population Prospects, the 2012 revision * Census of India, 2011 PROPORTION OF ADOLESCENT POPULATION (10-19) India and selected countries - 2010
 Proportion of Adolescent Population WORLD6,99, India* 2,53, China1,91, United States of America43, Indonesia43, Brazil33, Pakistan39, Nigeria35, Bangladesh32, Russian Federation15, Japan11, Source : World Population Prospects, the 2012 revision * Census of India, 2011 PROPORTION OF ADOLESCENT POPULATION (10-19) India and selected countries")
14
Countries Youth Population ('000) Proportion of Youth Population WORLD7,24,98017.7 India*2,31,95119.2 China2,42,24417.8 United States of America43,95014.1 Indonesia40,53016.8 Brazil33,64617.2 Pakistan37,27121.5 Nigeria30,60119.2 Bangladesh30,70320.3 Russian Federation21,30614.8 Japan12,85110.1 Source : World Population Prospects, the 2012 revision * Census of India, 2011 PROPORTION OF YOUTH POPULATION (15-24) India and selected countries - 2010
 Proportion of Youth Population WORLD7,24, India*2,31, China2,42, United States of America43, Indonesia40, Brazil33, Pakistan37, Nigeria30, Bangladesh30, Russian Federation21, Japan12, Source : World Population Prospects, the 2012 revision * Census of India, 2011 PROPORTION OF YOUTH POPULATION (15-24) India and selected countries")
15
HOUSEHOLDS WITH NUMBER OF AGED PERSON 60 YEARS AND ABOVE 15

16
Country/ State Name No. of HH Number of aged persons 60 years and above in the household (in percentage) None1234+ India24,88,58,28168.721.69.30.40.1 Madhya Pradesh 1,50,57,52872.118.49.10.40.0 Households with number of aged persons 60 years and above (Total)
 None1234+ India24,88,58, Madhya Pradesh 1,50,57, Households with number of aged persons 60 years and above (Total).")
17
Country/ State Name No. of HH Number of aged persons 60 years and above in the household (in percentage) None1234+ India16,82,71,63467.522.19.90.40.1 Madhya Pradesh 1,10,60,75272.318.09.40.40.0 Households with number of aged persons 60 years and above (Rural)
 None1234+ India16,82,71, Madhya Pradesh 1,10,60, Households with number of aged persons 60 years and above (Rural).")
18
Country/ State Name No. of HH Number of aged persons 60 years and above in the household (in percentage) None1234+ India8,05,86,64771.220.57.90.40.1 Madhya Pradesh39,96,77671.719.48.50.40.0 Households with number of aged persons 60 years and above (Urban)
 None1234+ India8,05,86, Madhya Pradesh39,96, Households with number of aged persons 60 years and above (Urban).")
19
NON WORKERS BY MAIN ACTIVITY 19

20
Proportion of Non workers by main activity to total population State NameStudents Household duties DependentsPensionersRentiers Beggars, Vagrants OthersW.P.R. India25.213.716.71.10.060.033.439.8 Madhya Pradesh 26.210.416.71.00.030.042.243.5

21
Total population of age-group 15-24 and No. of students as non worker Total Population Total Population in age group 15- 24 Proportion of age group 15-24 to total population Non workers in age group 15-24 STUDENT as Non workers in age group 15-24 India1,21,08,54,97723,19,50,67119.1614,62,69,9318,94,91,072 Madhya Pradesh 7,26,26,8091,41,74,36819.5277,75,23349,93,686

22
HOUSEHOLDS AND NUMBER OF MEMBERS SEEKING/ AVAILABLE FOR WORK 22

23
Country/ State Name No. of HH Members in the households seeking / available for work (in percentage) None1234+ India24,88,58,28172.216.27.42.61.7 Madhya Pradesh1,50,57,52873.314.68.12.41.5 HOUSEHOLDS AND NUMBER OF MEMBERS SEEKING / AVAILABLE FOR WORK (TOTAL)
 None1234+ India24,88,58, Madhya Pradesh1,50,57, HOUSEHOLDS AND NUMBER OF MEMBERS SEEKING / AVAILABLE FOR WORK (TOTAL).")
24
Country/ State Name No. of HH Members in the households seeking / available for work (in percentage) None1234+ India16,82,71,63470.016.98.32.92.0 Madhya Pradesh 1,10,60,75272.414.48.92.51.7 HOUSEHOLDS AND NUMBER OF MEMBERS SEEKING / AVAILABLE FOR WORK (RURAL)
 None1234+ India16,82,71, Madhya Pradesh 1,10,60, HOUSEHOLDS AND NUMBER OF MEMBERS SEEKING / AVAILABLE FOR WORK (RURAL).")
25
Country/ State Name No. of HH Members in the households seeking / available for work (in percentage) None1234+ India8,05,86,64776.714.95.51.91.0 Madhya Pradesh39,96,77675.715.16.02.11.1 HOUSEHOLDS AND NUMBER OF MEMBERS SEEKING / AVAILABLE FOR WORK (URBAN)
 None1234+ India8,05,86, Madhya Pradesh39,96, HOUSEHOLDS AND NUMBER OF MEMBERS SEEKING / AVAILABLE FOR WORK (URBAN).")
26
26 HOUSEHOLDS AND NUMBER OF FEMALE MEMBERS SEEKING/ AVAILABLE FOR WORK

27
Country/ State Name No. of HH Female Members in the households seeking / available for work (in percentage) None1234+ India24,88,58,28182.014.13.10.70.2 Madhya Pradesh1,50,57,52882.114.42.70.60.1 HOUSEHOLDS AND NUMBER OF FEMALE MEMBERS SEEKING / AVAILABLE FOR WORK (TOTAL)
 None1234+ India24,88,58, Madhya Pradesh1,50,57, HOUSEHOLDS AND NUMBER OF FEMALE MEMBERS SEEKING / AVAILABLE FOR WORK (TOTAL).")
28
Country/ State Name No. of HH Female Members in the households seeking / available for work (in percentage) None1234+ India16,82,71,63480.515.13.40.80.2 Madhya Pradesh 1,10,60,75281.015.52.90.60.1 HOUSEHOLDS AND NUMBER OF FEMALE MEMBERS SEEKING / AVAILABLE FOR WORK (RURAL)
 None1234+ India16,82,71, Madhya Pradesh 1,10,60, HOUSEHOLDS AND NUMBER OF FEMALE MEMBERS SEEKING / AVAILABLE FOR WORK (RURAL).")
29
Country/ State Name No. of HH Female Members in the households seeking / available for work (in percentage) None1234+ India8,05,86,64785.011.82.50.60.2 Madhya Pradesh 39,96,77685.411.52.40.50.1 HOUSEHOLDS AND NUMBER OF FEMALE MEMBERS SEEKING / AVAILABLE FOR WORK (URBAN)
 None1234+ India8,05,86, Madhya Pradesh 39,96, HOUSEHOLDS AND NUMBER OF FEMALE MEMBERS SEEKING / AVAILABLE FOR WORK (URBAN).")
30
HOUSELESS HOUSEHOLDS BY HOUSEHOLD SIZE 30

31
Country/ State Name No. of Houseless households Houseless Population Mean household size India4,49,78717,73,0403.9 Madhya Pradesh37,8221,46,4353.9 AVERAGE HOUSELESS HOUSEHOLDS (TOTAL)
.")
32
Country/ State Name No. of Houseless households Houseless Population Mean household size India1,92,8918,34,6924.3 Madhya Pradesh19,31480,3804.2 AVERAGE HOUSELESS HOUSEHOLDS (RURAL)
.")
33
Country/ State Name No. of Houseless households Houseless Population Mean household size India2,56,8969,38,3483.7 Madhya Pradesh18,50866,0553.6 AVERAGE HOUSELESS HOUSEHOLDS (URBAN)
.")
34
HOUSEHOLDS BY NO. OF LITERATES IN THE HOUSEHOLD 34

35
India/State No. of Households Percentage of Households by number of literates in the household None1234+ India24,88,58,2819.712.420.718.738.4 Madhya Pradesh1,50,57,52812.115.020.917.334.7 Households by number of literates among the members of household age 7 years and above: 2011 (TOTAL)
.")
36
India/State No. of Households Percentage of Households by number of literates in the household None1234+ India16,82,71,63412.214.320.918.134.5 Madhya Pradesh 1,10,60,75214.717.221.917.229.1 Households by number of literates among the members of household age 7 years and above: 2011 (RURAL)
.")
37
India/State No. of Households Percentage of Households by number of literates in the household None1234+ India8,05,86,6474.78.620.220.046.6 Madhya Pradesh 39,96,7764.99.118.317.650.2 Households by number of literates among the members of household age 7 years and above: 2011 (URBAN)
.")
38
http://www.censusmp.gov.in
39
Directorate Census Madhya Pradesh

Similar presentations


>")