Download presentation
Presentation is loading. Please wait.

1
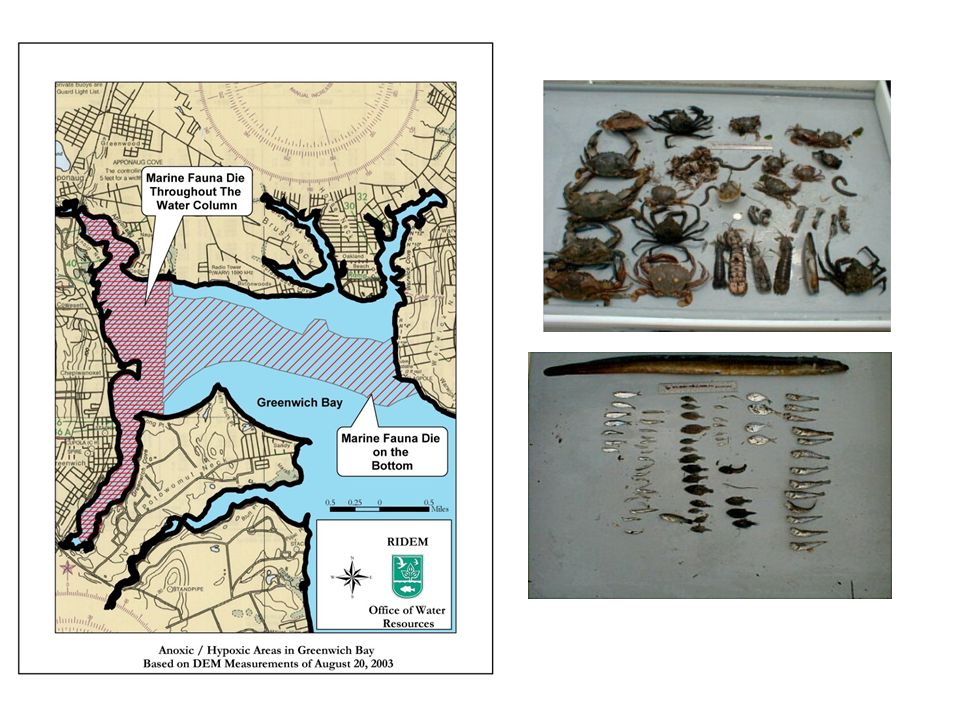
Anoxia in Narragansett Bay Can we predict it?

4
Narragansett Bay Fixed-Site Water Quality Monitoring Network Agencies: RIDEM-OWR, URI/GSO, NBNERR, NBC, NBNEP, & RWU Site Locations: West Passage, East Passage, Providence River, Seekonk River, West Greenwich Bay, & Mt. Hope Bay Funding: NOAA Bay Window Program, EPA Clean Water Act (sections 319 & 106), & NOAA National Estuary Program
, & NOAA National Estuary Program.")
6
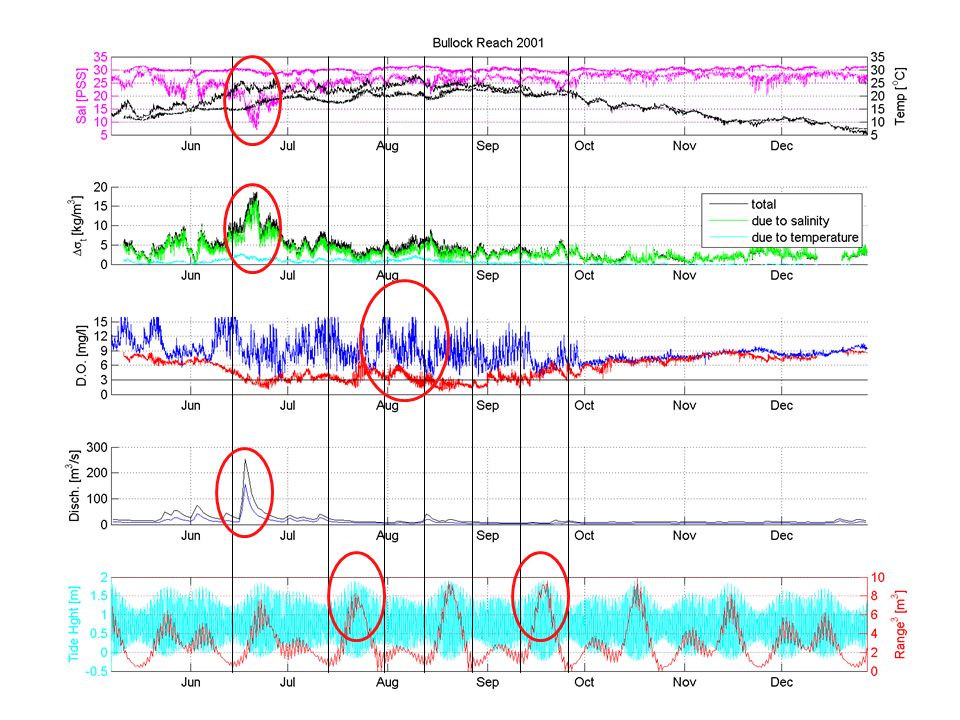
North Prudence Bottom Oxygen Levels: 2001-2006

8
Hypoxia Study Program Goals Predictive/modeling tools for decision makers Models that predict susceptibility to hypoxia Integrated parameterizations Transferability of results across systems Data to calibrate and verify models

9
Our approaches Hybrid Ecological-Hydrodynamic Modeling –Ecological model: simple Few processes, few parameters Parameters that can be constrained by measurements Few spatial domains (~20), as appropriate to measurements available Net exchanges between spatial domains: from hydrodynamic model –Hydrodynamic model: full physics and forcing of ROMS realistic configuration; forced by observed winds, rivers, tides, surface fluxes Applied across entire Bay, and beyond, at high resolution Passive tracers used to determine net exchanges between larger domains of ecological model Empirical-Statistical Modeling –Input-output relations, emphasis on empirical fit more than mechanisms –Development of indices for stratification, hypoxia susceptibility –Learn from hindcasts, ultimately apply toward forecasting
, as appropriate to measurements available Net exchanges between spatial domains: from hydrodynamic model –Hydrodynamic model: full physics and forcing of ROMS realistic configuration; forced by observed winds, rivers, tides, surface fluxes Applied across entire Bay, and beyond, at high resolution Passive tracers used to determine net exchanges between larger domains of ecological model Empirical-Statistical Modeling –Input-output relations, emphasis on empirical fit more than mechanisms –Development of indices for stratification, hypoxia susceptibility –Learn from hindcasts, ultimately apply toward forecasting")
10
An alternative approach? 4 state variables, 5 processes N P N Land-use Atmospheric deposition N P Productivity Temp, Light, Boundary Conditions Chl, N, P, Salinity Phytoplankton Sediment organics.. Physics Surface layer - - - - - - - - - Deep layer - - - - - - - - - Bottom sediment O 2 Flux to bottom Photic zone heterotrophy Benthic heterotrophy Denitri- fication O 2 coupled stoichiometrically BZI ƒ(Chl 10d ) ƒ[Chl] ƒ(OM,T) % Processes of the model & basis for formulations: mixing flushing
 ƒ[Chl] ƒ(OM,T) % Processes of the model & basis for formulations: mixing flushing.")
11
Field Work in Support of Ecological Models Historical Hypoxia based on benthic forams Water Column Metabolism Sediment Oxygen Demand Denitrification Rates Oxygen Surveys ( some with other funding) Survey of nutrient concentrations
 Survey of nutrient concentrations")
13
Accomplishments Physical model running. Ecological model started. Input output model started. One year of denitrification measurements. Historical foram survey completed. Half a year of metabolism measurements. Physical measurements made in the upper bay: currents upper east and west passages. water column profiling. neap tide studies. Intensive oxygen surveys conducted for two summers. Workshop conducted with environmental mangers.

15
Neap mixing Spring mixing

16
Production and Respiration Measurements Sampling 6 stations –Conimicut Point –North Prudence –Mount View –Bullocks Reach –Quonset Point –GSO Dock http://www.nbnerr.org/propertieshome.htm

17
Productivity and Respiration Throughout the Bay 9/18/2006

Similar presentations


 Need to relate “today’s”>")

 and Tracer Simulation Eugene Wei Coastal Survey.>")


