Download presentation
Presentation is loading. Please wait.

1
R.N. Szupiany & M.L. Amsler Consejo Nacional de Investigaciones Científicas y Técnicas (CONICET), Argentina. Facultad de Ingeniería y Ciencias Hídricas, Universidad Nacional del Litoral, Argentina. J.J. Fedele Saint Anthony Falls Laboratory, University of Minnesota, Minneapolis, USA. R.N. Szupiany & M.L. Amsler Consejo Nacional de Investigaciones Científicas y Técnicas (CONICET), Argentina. Facultad de Ingeniería y Ciencias Hídricas, Universidad Nacional del Litoral, Argentina. J.J. Fedele Saint Anthony Falls Laboratory, University of Minnesota, Minneapolis, USA. SECONDARY FLOW AT A SCOUR HOLE DOWNSTREAM A BAR-CONFLUENCE (PARANA RIVER, ARGENTINA)
, Argentina. Facultad de Ingeniería y Ciencias Hídricas, Universidad Nacional del Litoral, Argentina. J.J. Fedele Saint Anthony Falls Laboratory, University of Minnesota, Minneapolis, USA. R.N. Szupiany & M.L. Amsler Consejo Nacional de Investigaciones Científicas y Técnicas (CONICET), Argentina. Facultad de Ingeniería y Ciencias Hídricas, Universidad Nacional del Litoral, Argentina. J.J. Fedele Saint Anthony Falls Laboratory, University of Minnesota, Minneapolis, USA. SECONDARY FLOW AT A SCOUR HOLE DOWNSTREAM A BAR-CONFLUENCE (PARANA RIVER, ARGENTINA).")
2
INTRODUCTION Results are reported herein of a project whose main purpose is to study the flow pattern and its relationships with the bed sediment transport along the nodal units (confluence-constriction-expansion) of large braided streams as the Paraná River. Results are reported herein of a project whose main purpose is to study the flow pattern and its relationships with the bed sediment transport along the nodal units (confluence-constriction-expansion) of large braided streams as the Paraná River. The investigation is based on field measurements. The investigation is based on field measurements.
 of large braided streams as the Paraná River. The investigation is based on field measurements. The investigation is based on field measurements..")
3
INTRODUCTION Most reported experimental and numerical studies at river confluences, has been performed in small streams with limited depths and widths. Most reported experimental and numerical studies at river confluences, has been performed in small streams with limited depths and widths. The study of confluences in large rivers unlike the case in small streams are extremely scarce, essentially because of a lack of proper instrumentation. The study of confluences in large rivers unlike the case in small streams are extremely scarce, essentially because of a lack of proper instrumentation. The Doppler technology proved to be useful for accurate determinations of flow discharges in large streams but the reliability of its signals for other calculations such as the secondary circulation, still remain highly untested. The Doppler technology proved to be useful for accurate determinations of flow discharges in large streams but the reliability of its signals for other calculations such as the secondary circulation, still remain highly untested.

4
INTRODUCTION In this paper, a preliminary analysis of the secondary currents measured at a scour hole downstream of an asymmetrical bar-confluence in the Paraná River, Argentina, is presented. A methodology that allows for obtaining representative values of the time-averaged velocities with moving-vessel ADP measurements, was used.

5
MAIN FEATURES OF THE PARANÁ RIVER (Middle Reach) Mean discharge of 19500 m 3 s -1. Mean discharge of 19500 m 3 s -1. Water surface slope in the order of 10 -5. Water surface slope in the order of 10 -5. Channel bed composed largely by fine and medium sands. Channel bed composed largely by fine and medium sands. Channel planform pattern classified as braided with a meandering thalweg. Channel planform pattern classified as braided with a meandering thalweg. Mean widths between 600-2500 m Mean widths between 600-2500 m Depths ranging 5 to more than 12 m. Depths ranging 5 to more than 12 m.

6
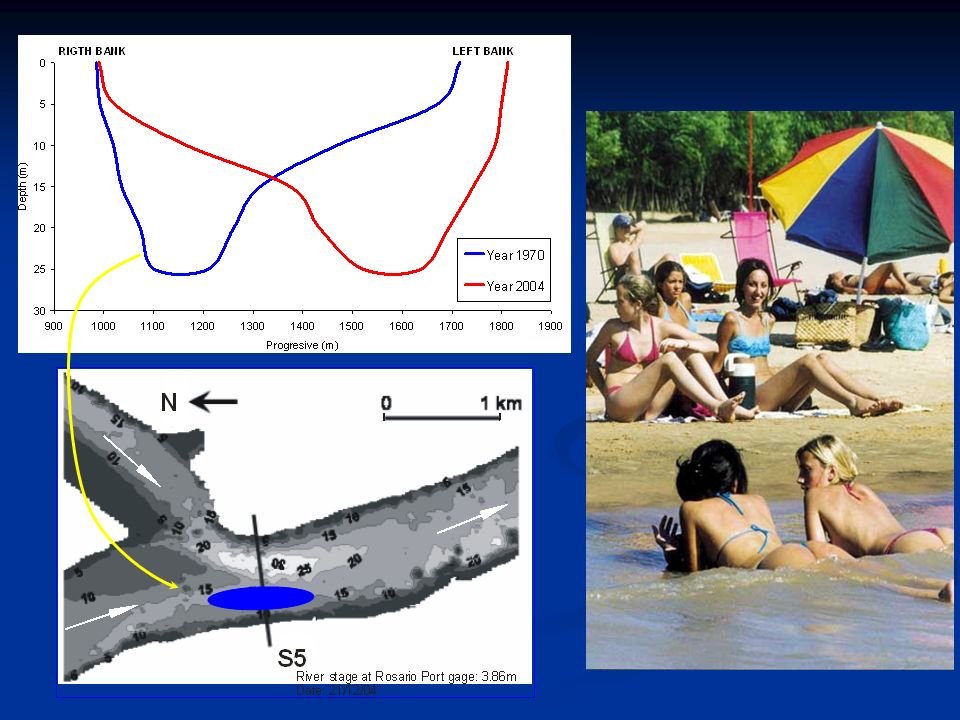
STUDY SITE AND MEASURING CROSS SECTION

7
DESCRIPTION OF FIELD MEASUREMENTS Equipments: ADP of 1000 kHz (moving-vessel measurements were performed). ADP of 1000 kHz (moving-vessel measurements were performed). Cell size of 0.75 m Cell size of 0.75 m Averaging interval of 10 seconds Averaging interval of 10 seconds DGPS DGPS Echo-sounder Echo-sounder Hydrographic Hydrographic vessel vessel
. Cell size of 0.75 m Cell size of 0.75 m Averaging interval of 10 seconds Averaging interval of 10 seconds DGPS DGPS Echo-sounder Echo-sounder Hydrographic Hydrographic vessel vessel.")
8
DESCRIPTION OF FIELD MEASUREMENTS Methodology: Bathymetry of the confluence zone based on cross section measurements each separated 100 m. Bathymetry of the confluence zone based on cross section measurements each separated 100 m. ADP velocity measurements at seven cross sections located along the braid-bar confluence. ADP velocity measurements at seven cross sections located along the braid-bar confluence. A procedure was used that requires at least five transects recorded with the ADP at each cross section to obtain representative time- averaged horizontal velocity data (Szupiany & Amsler, 2005).
..")
9
ANALYSIS OF VELOCITY DATA SECONDARY CURRENTS Methods classification (Lane et al. 2000): The centerline definition. The centerline definition. The discharge continuity definition. The discharge continuity definition. The zero net cross-stream discharge definition. The zero net cross-stream discharge definition. The Rozovskii definition. The Rozovskii definition. Much discussion still remains regarding which of the above methods yield the most realistic secondary velocity field. In this study in a large alluvial river with its constraints for data collection, the discharge continuity procedure and the centerline definition were discarded.
: The centerline definition. The centerline definition. The discharge continuity definition. The discharge continuity definition. The zero net cross-stream discharge definition. The zero net cross-stream discharge definition. The Rozovskii definition. The Rozovskii definition. Much discussion still remains regarding which of the above methods yield the most realistic secondary velocity field. In this study in a large alluvial river with its constraints for data collection, the discharge continuity procedure and the centerline definition were discarded..")
10
The Rozovskii definition (basic expressions): : orientation of v respecting the north; : orientation respecting the north of the depth average velocity vector v N, v E : north and eastward components of the point velocity vectors where: PRIMARY COMPONENT SECONDARY COMPONENT North Depth average velocity vector Point velocityvectors p v s v
: : orientation of v respecting the north; : orientation respecting the north of the depth average velocity vector v N, v E : north and eastward components of the point velocity vectors where: PRIMARY COMPONENT SECONDARY COMPONENT North Depth average velocity vector Point velocityvectors p v s v ")
11
RESULTS MAIN HYDRAULIC CONDITIONS AT THE CONFLUENCE SECTIONS S4(LB) S3(RB) S5 Mean flow velocity (m s -1 ) 0.90 1.12 1.25 Width (m) 680 750 900 Discharge (m 3 s -1 ) 7036 10610 17646 Maximum depth (m) 18 16 31 ----------------------------------------------------------------------- Junction angle (degrees) 65 Flow momentum ratio, M* 0.53 Discharge ratio0.67 Discharge ratio 0.67 ( , water density, Q, total discharge, V, cross-section average velocity and the subscripts L and R denote left and right branch) *
 S3(RB) S5 Mean flow velocity (m s -1 ) Width (m) Discharge (m 3 s -1 ) Maximum depth (m) Junction angle (degrees) 65 Flow momentum ratio, M* 0.53 Discharge ratio0.67 Discharge ratio 0.67 ( , water density, Q, total discharge, V, cross-section average velocity and the subscripts L and R denote left and right branch) *")
12
STUDY SITE AND MEASURING CROSS SECTION

13
RESULTS MORPHOLOGIC CONDITIONS AT THE CONFLUENCE

14
RESULTS HORIZONTAL SECONDARY CURRENTS Horizontal secondary currents in section S5 (average values of 5 transects).
.")
15
RESULTS VERTICAL SECONDARY CURRENTS Vertical secondary currents in section S5 (average values of 5 transects).
.")
16
RESULTS HORIZONTAL SECONDARY CURRENTS Horizontal secondary currents in section S5 (average values of 5 transects). Horizontal secondary currents in section S5 (values from 1 transect).
..")
17
CONCLUDING REMARKS The secondary circulation in the scour hole downstream of a bar-confluence in a large braided river was obtained applying the Rozovskii method. The secondary circulation in the scour hole downstream of a bar-confluence in a large braided river was obtained applying the Rozovskii method. The results presented herein must be viewed as the first step of an investigation that includes intercomparison of methods to check which one better represents the secondary structures at confluences and nodes of large rivers like the Paraná.

18
CONCLUDING REMARKS Making allowance for the statement above, two counter-rotating surface convergent secondary currents clearly characterize the mean flow structure at the scour hole downstream the studied bar confluence. Making allowance for the statement above, two counter-rotating surface convergent secondary currents clearly characterize the mean flow structure at the scour hole downstream the studied bar confluence. Similar patterns have been observed in laboratory and in small natural streams (McLelland et al. 1996, Rhoads 1996, between others). The two secondary cells locate on either side of the mixing interface at 260-300 m from left bank.
. The two secondary cells locate on either side of the mixing interface at m from left bank..")
19
CONCLUDING REMARKS Apparently the strength of the left secondary cell is larger than the right one, something that could be related with several factors such as: the flow momentum value M (<1), flow scale and confluence asymmetry. Apparently the strength of the left secondary cell is larger than the right one, something that could be related with several factors such as: the flow momentum value M (<1), flow scale and confluence asymmetry.
, flow scale and confluence asymmetry..")
20
CONCLUDING REMARKS An averaging method specifically designed (Szupiany & Amsler 2005) to record representative mean flow velocity values with moving-vessel ADP measurements was used to obtain the previous results. An averaging method specifically designed (Szupiany & Amsler 2005) to record representative mean flow velocity values with moving-vessel ADP measurements was used to obtain the previous results. In this manner a large number of average point primary velocities at a given cross-section of a large river is rapidly possible to obtain.
 to record representative mean flow velocity values with moving-vessel ADP measurements was used to obtain the previous results. In this manner a large number of average point primary velocities at a given cross-section of a large river is rapidly possible to obtain..")
21
CONCLUDING REMARKS The previous conclusion would be also an indirect evidence in the Paraná River of the statement by Rhoads (1996), referring to the two secondary cells as a mechanism to transport high-velocity, near-surface fluid downward toward the bed over the zone of maximum channel depth and inward along the bed toward each bank. The previous conclusion would be also an indirect evidence in the Paraná River of the statement by Rhoads (1996), referring to the two secondary cells as a mechanism to transport high-velocity, near-surface fluid downward toward the bed over the zone of maximum channel depth and inward along the bed toward each bank. Note that the secondary velocities near the bed of the left cell appear to be of the same order than those near the water surface.
, referring to the two secondary cells as a mechanism to transport high-velocity, near-surface fluid downward toward the bed over the zone of maximum channel depth and inward along the bed toward each bank. Note that the secondary velocities near the bed of the left cell appear to be of the same order than those near the water surface..")
23
The condition of M<1, would have important morphologic consequences since the scour hole appears displaced towards the left bank thus preventing the existence of the separation zone and bar region observed downstream the junction corner in small streams (Best 1987, McLelland et al. 1996). (Bathymetric measurements complemented with visual inspections by the authors, revealed an intense erosive process on the left bank at S5) SOME APPLIED IMPLICATIONS
. (Bathymetric measurements complemented with visual inspections by the authors, revealed an intense erosive process on the left bank at S5) SOME APPLIED IMPLICATIONS.")
26
THE END THANK YOU !

27
The zero net cross-stream discharge definition Considering the entire cross section Dividing in 2 sectors the cross section

28
The zero net cross-stream discharge definition Applying the Rozaovskii method Dividing in 3 sectors the cross section

Similar presentations


, F. Liébault (1), H.>")


 and discharge at a location in a flowing system. Expressed as an equation,>")


>")
