Download presentation
Presentation is loading. Please wait.

1
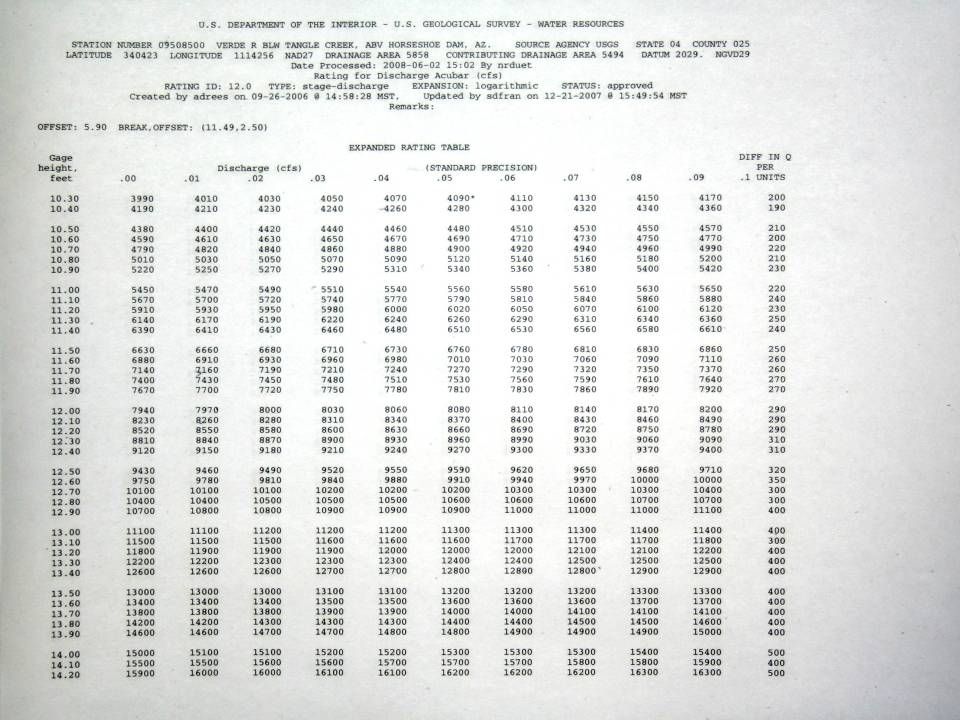
Stage – Discharge Rating Numerical relationship between water elevation (stage) and discharge at a location in a flowing system. Expressed as an equation, table, or graph

2
A channel or conveyance determines the stage for a given discharge by the geometry (cross-sectional area, length, and slope) available, and by the roughness of the materials in the channel. These features are called the “control” Controls can be artificial or natural, and are commonly classified as sectional, channel, and overbank. These control features determine the slope of the stage discharge relationship.

9
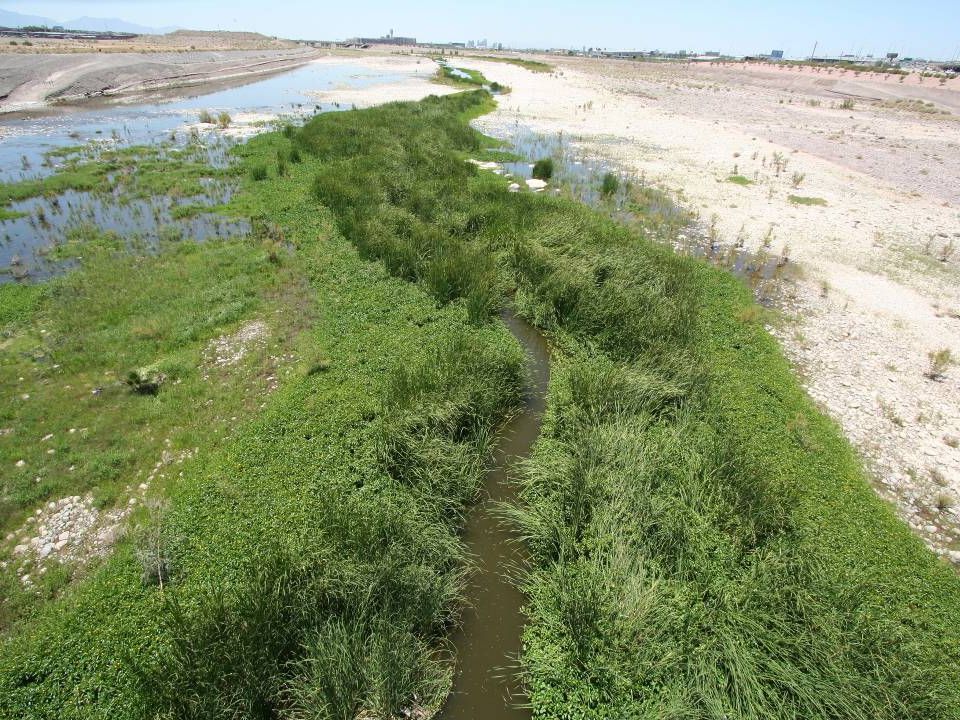
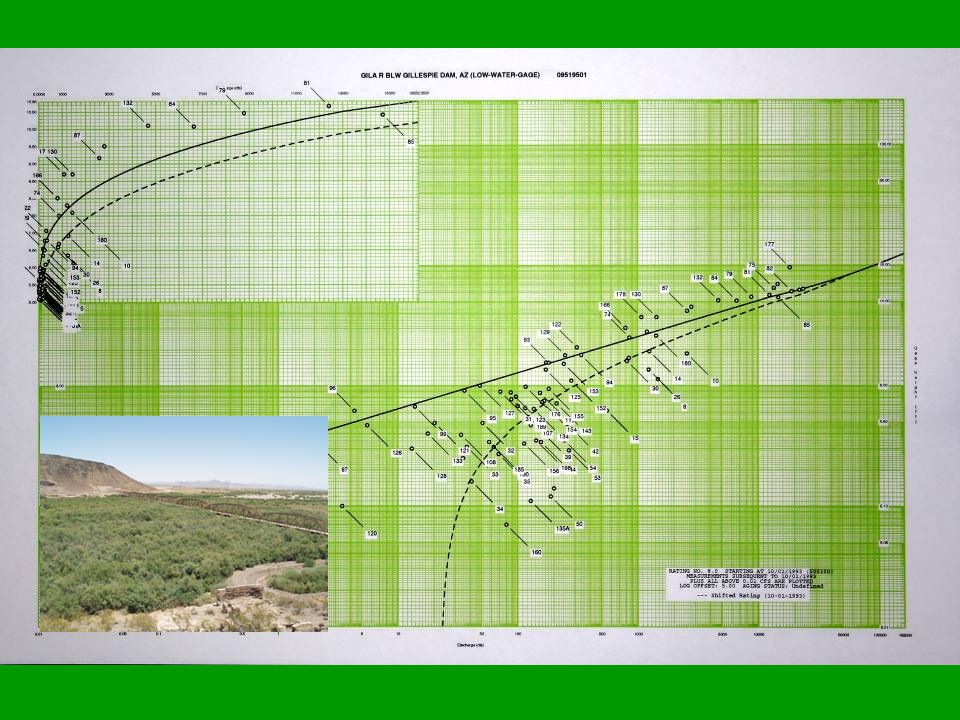
Gila River at Gillespie Bridge Channel roughness and cross section area impacted by heavy vegetation

13
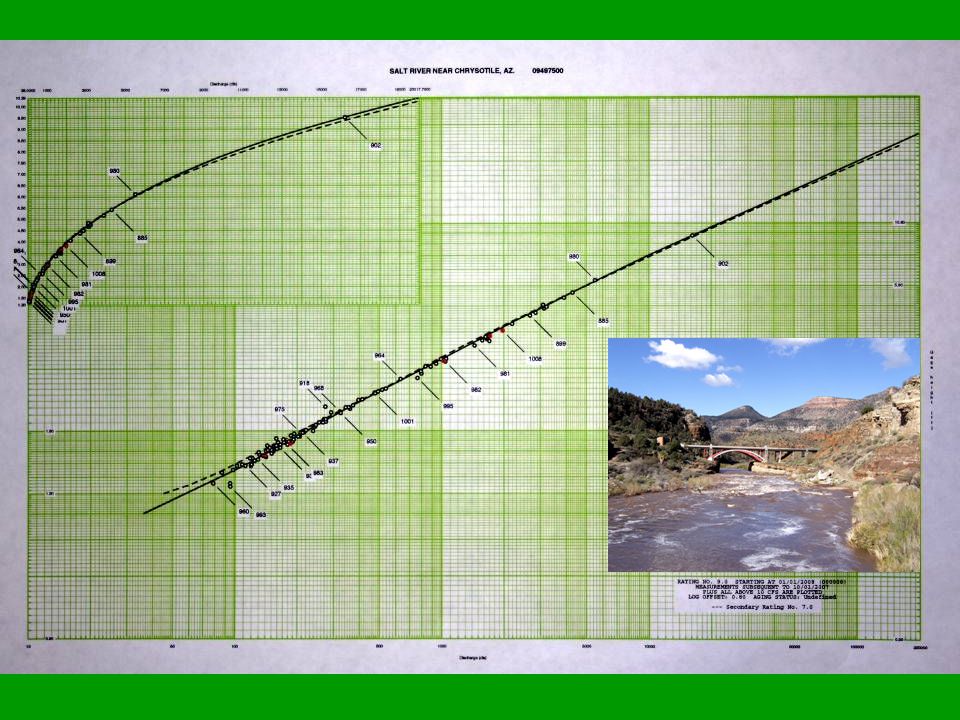
Salt River nr Cibeque Gage height controlled by downstream riffle

14
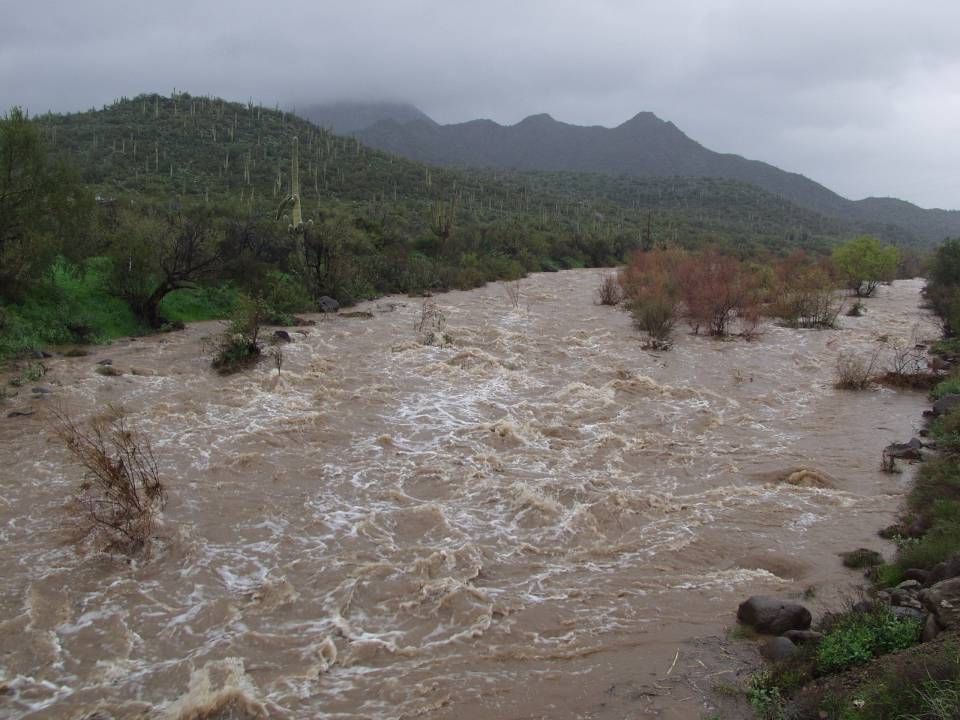
Gila River blw San Carlos Reservoir Channel hemmed in by cliffs

15
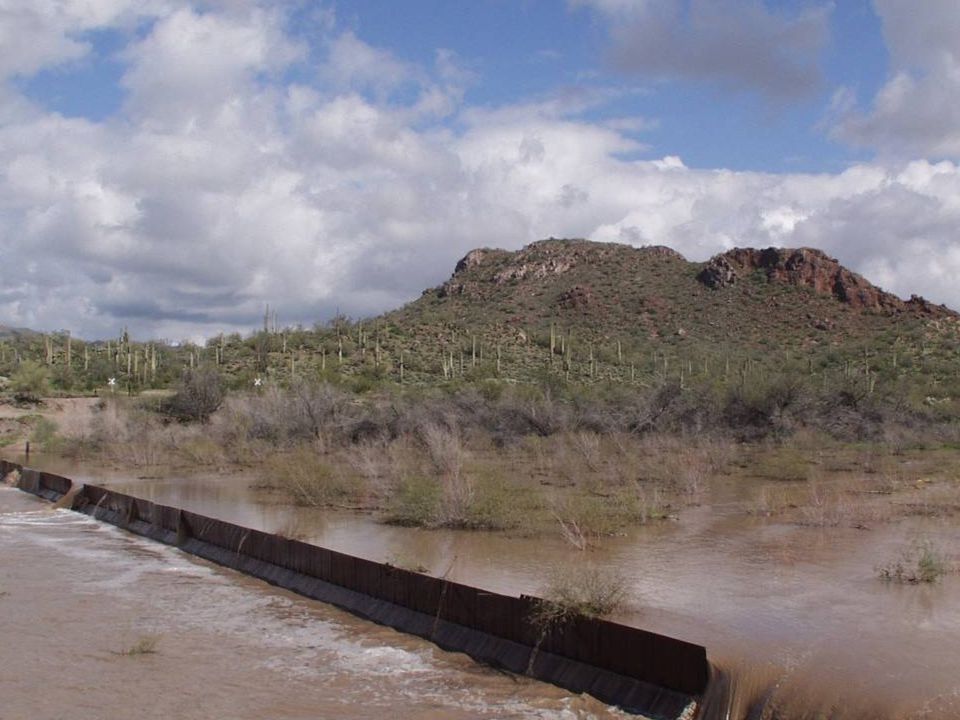
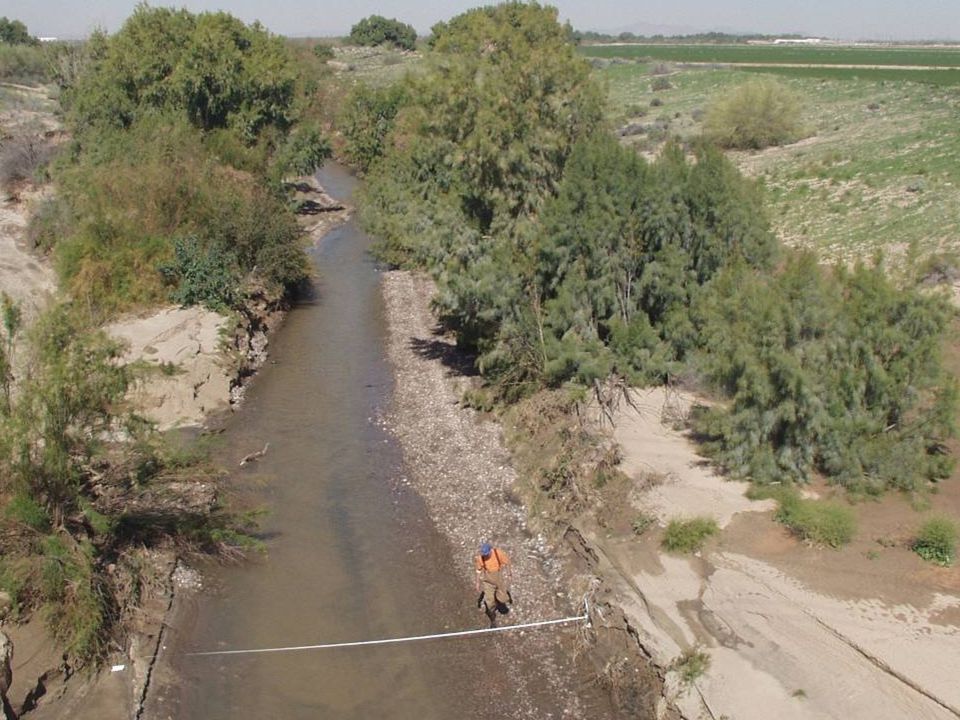
Verde River blw Tangle Creek. Low flow channel at right impacted by riparian growth. Note how channel width expands with higher flows

17
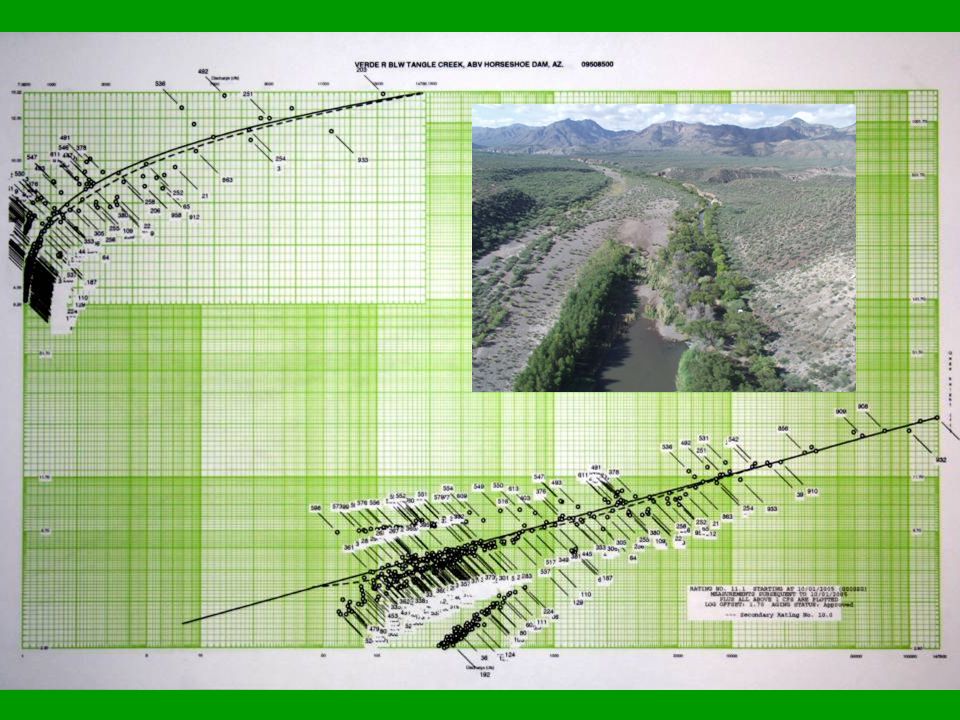
Rating plots as straight line on log scale

19
Q = a(GH-e) b note that the relationship is not linear Where: a = coefficient e = point of zero flow b = slope of the relation b is almost always greater than 2 Common equation used for Section Controls
 b note that the relationship is not linear Where: a = coefficient e = point of zero flow b = slope of the relation b is almost always greater than 2 Common equation used for Section Controls")
20
Common Equation used to relate water discharge to channel conditions Channel Control Q= 1.486/n AR 2/3 S 1/2 Where: A= Cross section area R= Hydraulic radius ( area/wetted perimeter S= Energy Slope n= Manning’s “n” (roughness coefficient) Gage height in this example is buried in the area term on the right. This equation hints at how complex the relationship can be.

28
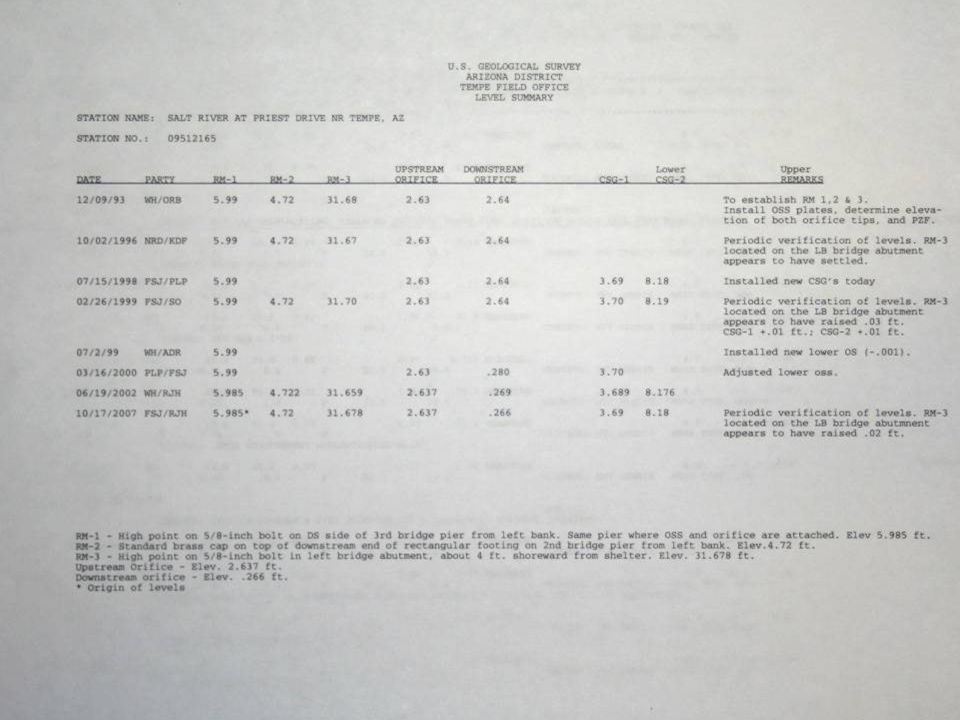
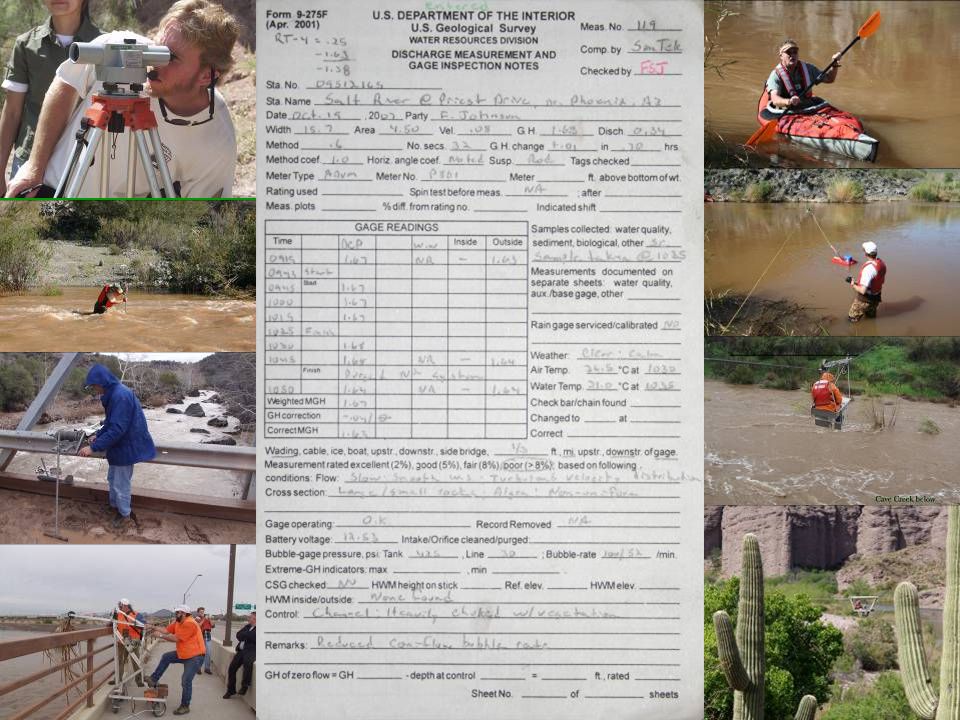
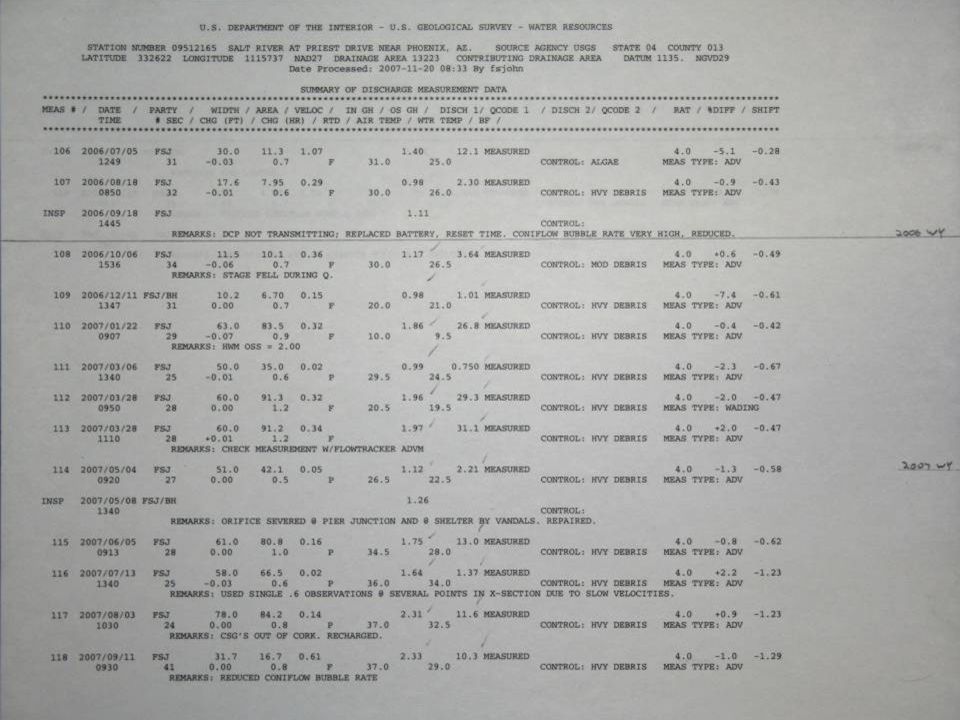
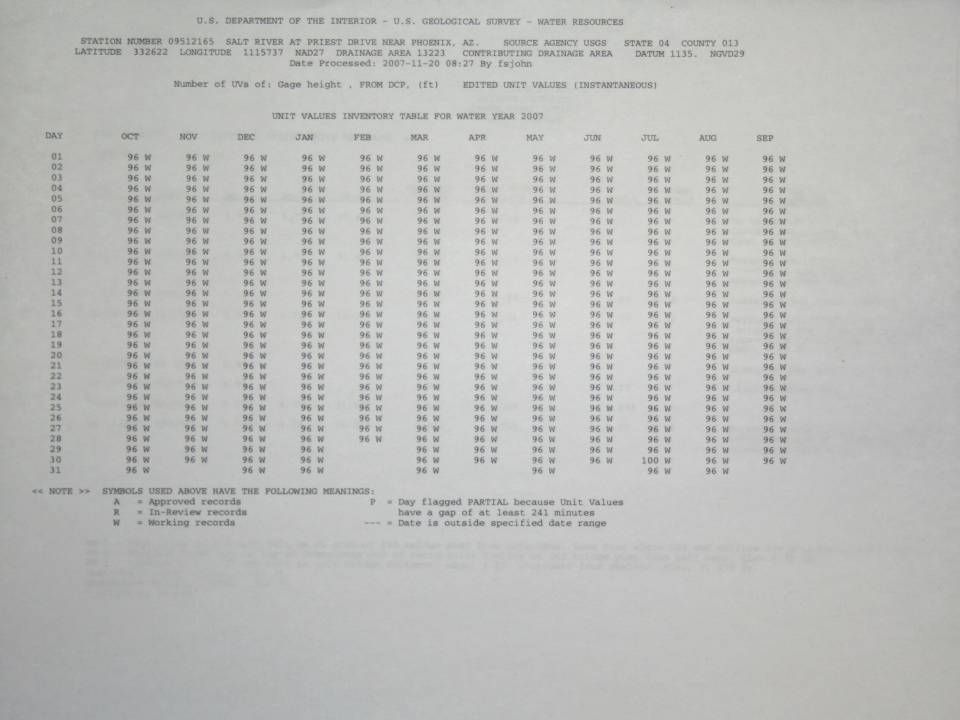
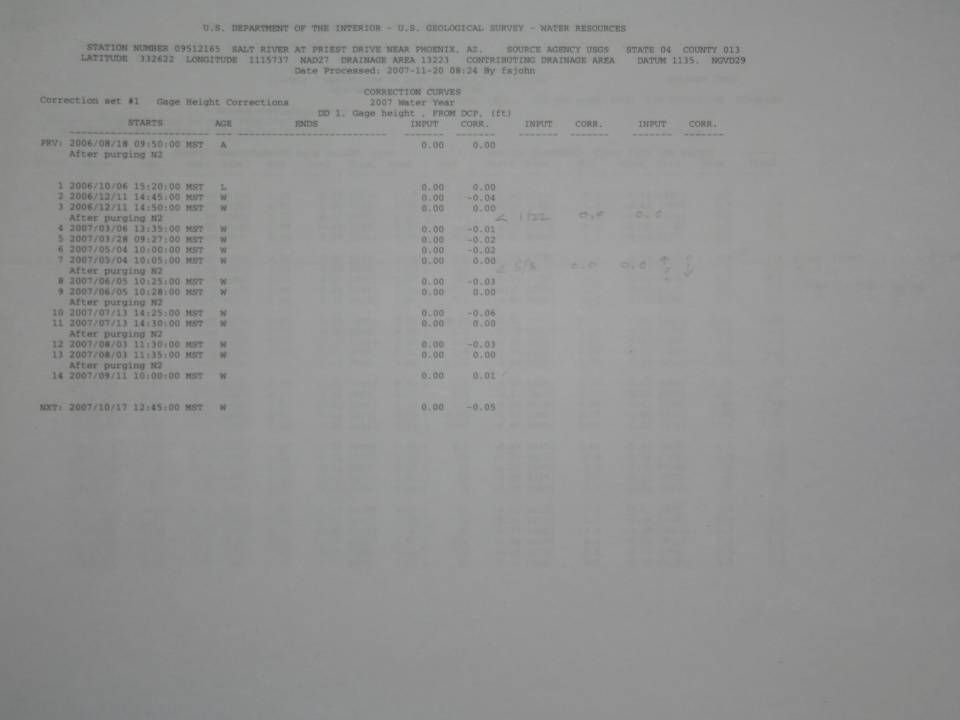
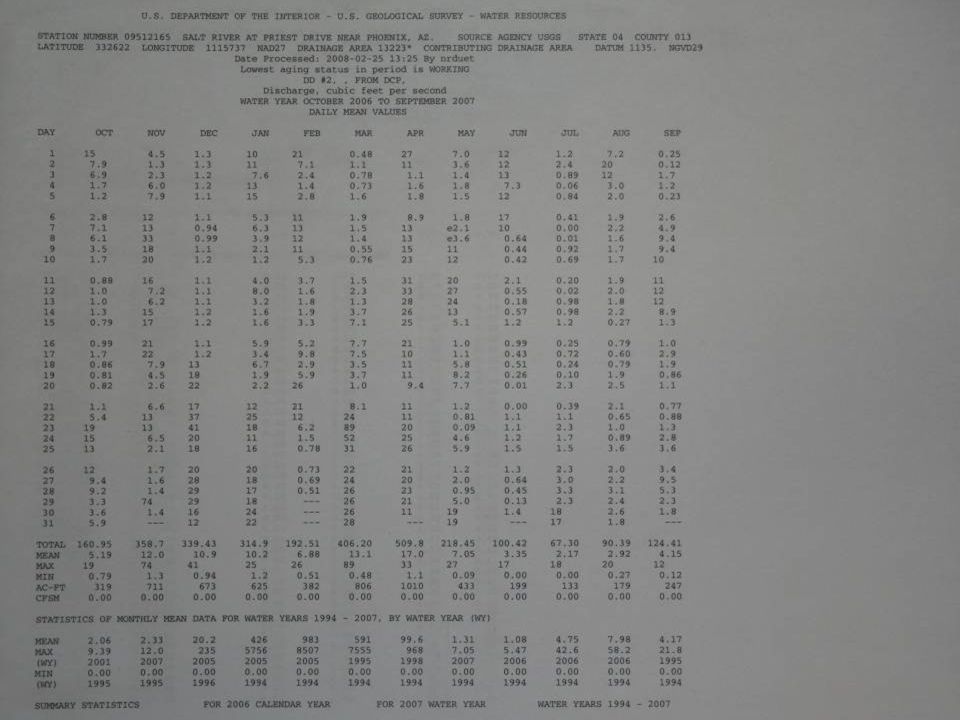
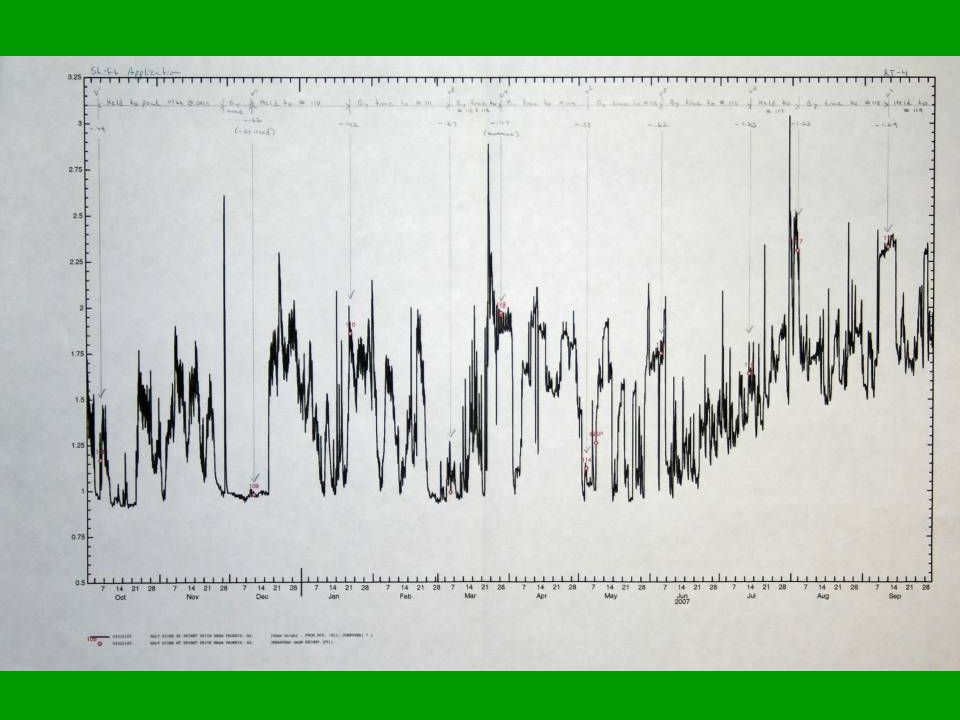
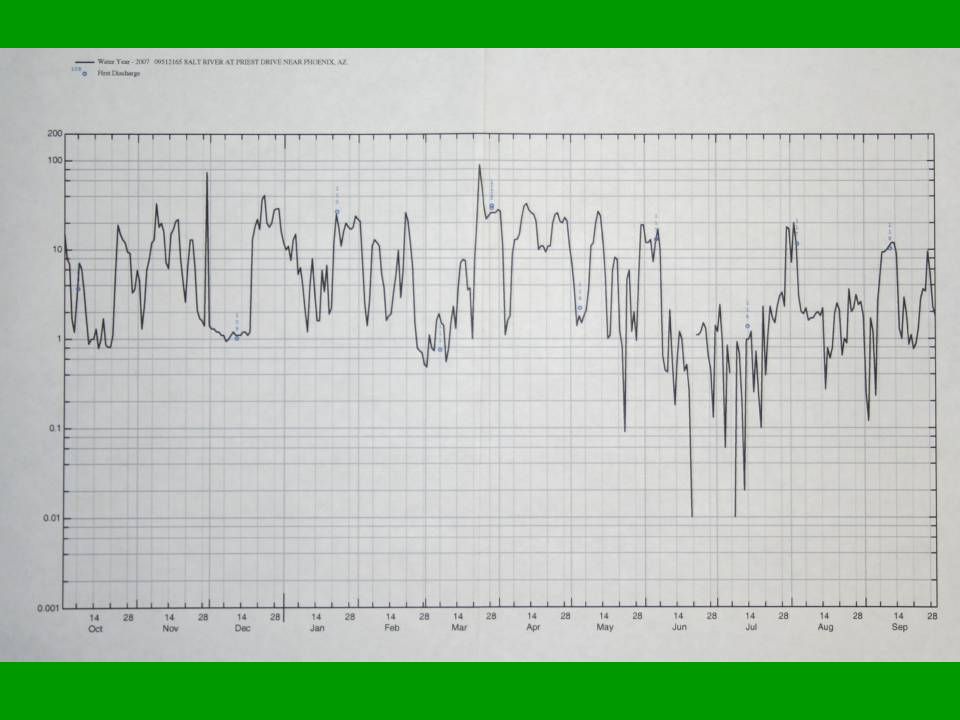
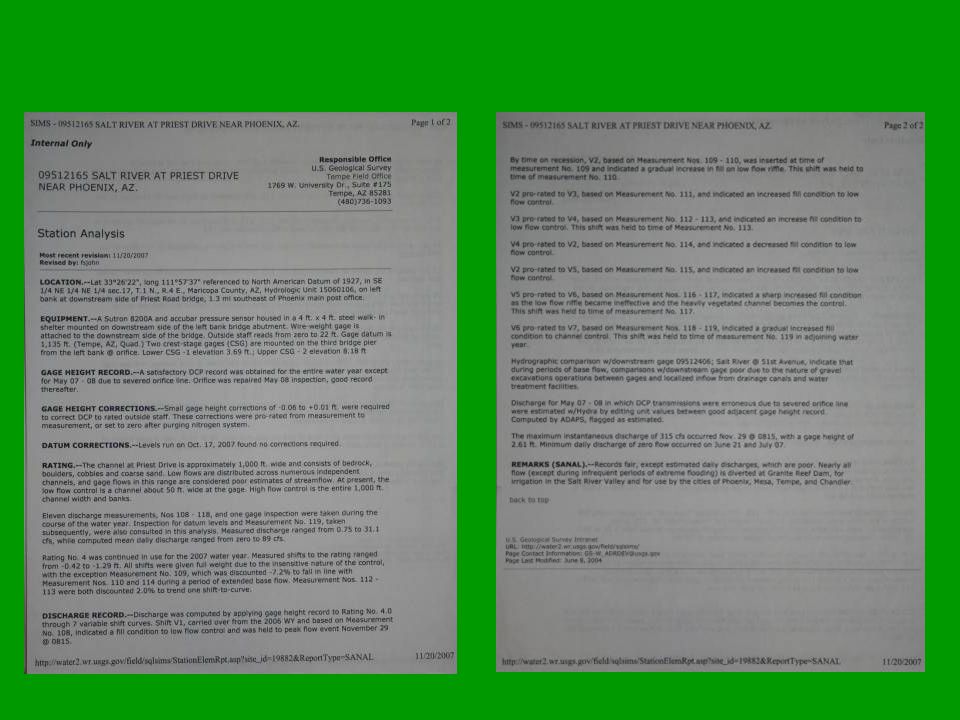
Records computation steps 1.Establishment and maintenance of a vertical datum and reference gage such as a staff plate. 2.Installation and frequent calibration of stage recording equipment (almost all data are telemetered directly into the data base 3.Documentation of channel conditions 4.Calibration measurements 5.Field notes 6.Data entry of field observations 7.Monitoring data for completeness and quality 8.Corrections applied to gage height record to match observations 9.Rating/Shift analysis… development of temporary shift curves, or is new rating required 10.Processing of primary record 11.Check peak recorded values against observed high water marks 12.Check that shift and gage height corrections application is accurate 13.Plot hydrograph of daily values …. Does it make sense? 14.Compare hydrograph to near by sites…. 15.Write station analysis 16.Records are checked 17.Records are reviewed 18.Records of daily values and statistics are published

29
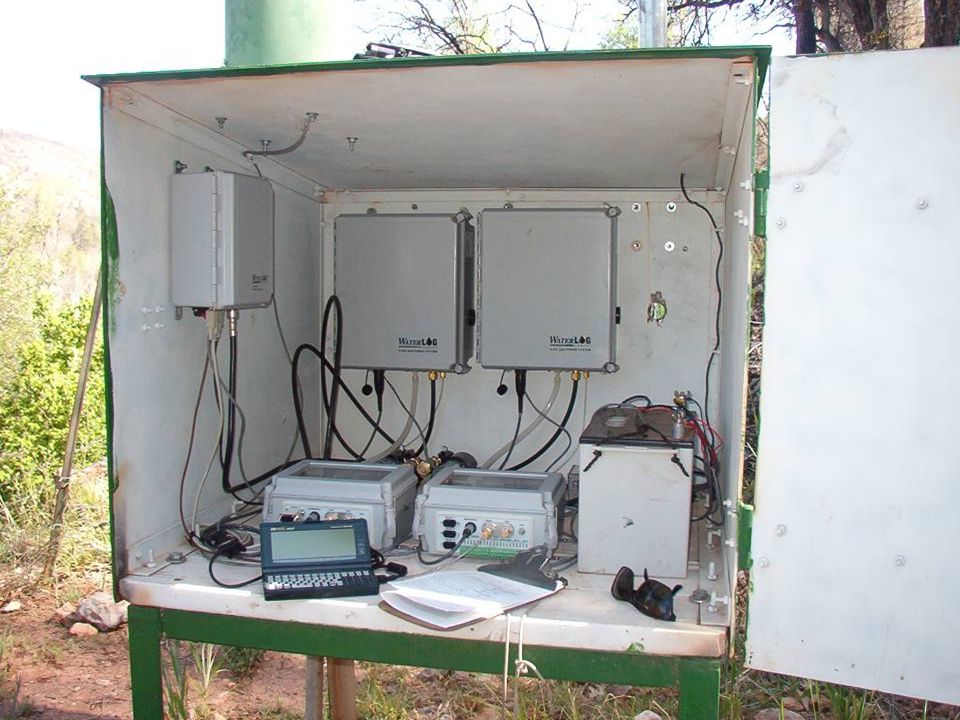
Reference Gage

Similar presentations


 PRIMARY VALIDATION: –BASED ON KNOWLEDGE OF INSTRUMENTATION AND METHODS OF MEASUREMENT WITH ASSOCIATED ERRORS.>")


 Snake River near Murphy Carl Rundberg Pete Vidmar.>")


