Download presentation
Presentation is loading. Please wait.

1
Group 6: III-ACSAD Reported By: Arias, Kristine De Jesus, Relly

3
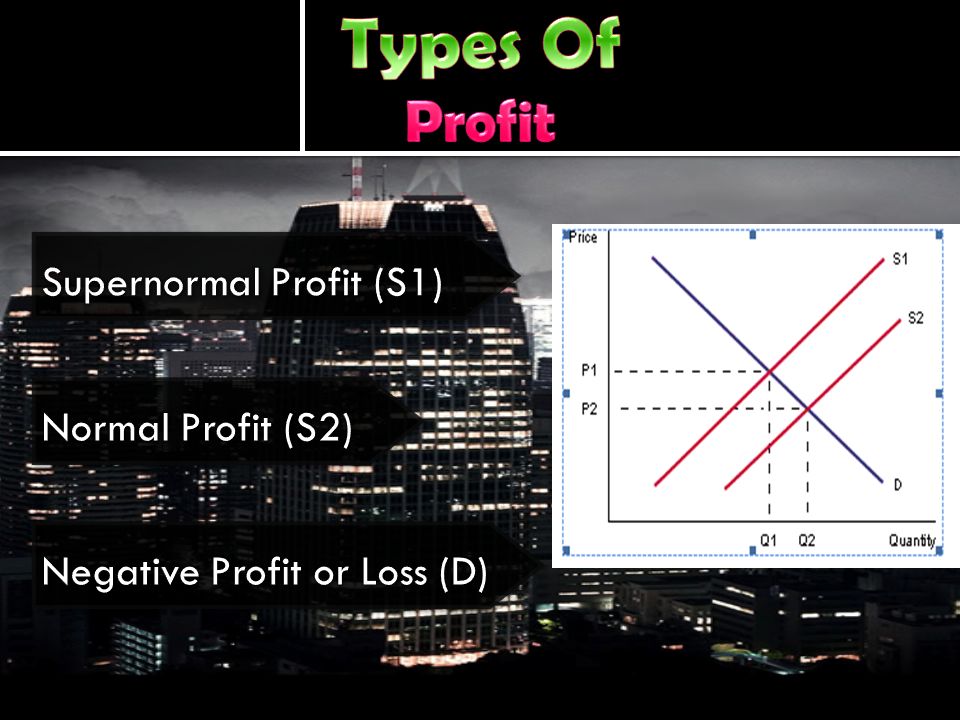
Total Cost The cost of all factors of production. Total Cost The cost of all factors of production. Total Revenue The total amount of money that the firm receives from sales of its product or other sources. Total Revenue The total amount of money that the firm receives from sales of its product or other sources.

8
A monopolist maximizes profit by choosing a quantity where marginal revenue equals marginal cost A process that companies undergo to determine the best output and price levels in order to maximize its return. A monopolist maximizes profit by choosing a quantity where marginal revenue equals marginal cost A process that companies undergo to determine the best output and price levels in order to maximize its return. Total Revenue – Total cost Method Marginal Revenue – Marginal Cost Method Total Revenue – Total cost Method Marginal Revenue – Marginal Cost Method

10
(This is complicated but very useful to compare profit maximization under different market condition) Stage1: To find profit maximizing output, we use MC & MR curves. To maximize profit Marginal Revenue must be equal to Marginal Cost. i.e. MR=MC Why profit maximize when MR=MC? To find out the answer to this question, observe when MR=/= (not equal to) MC. MC MRMR 132 5 3 1010 4
 MC. MC MRMR")
11
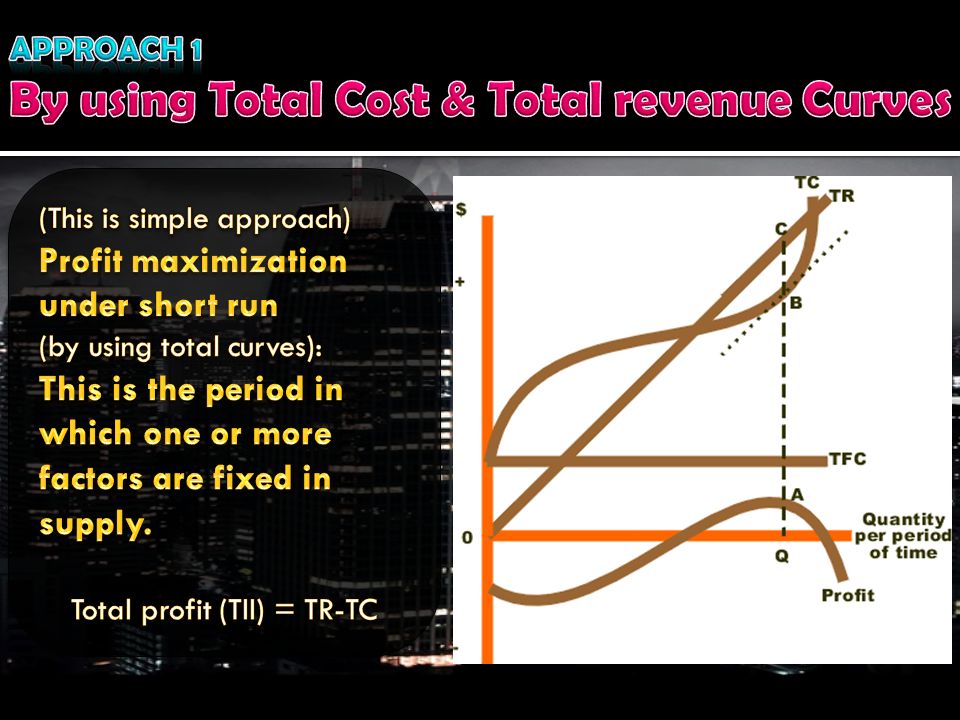
PROFIT = TR-TC Total Revenue (TR): This is the total income a firm receives. Total cost: refers to the total expense incurred in reaching a particular level of output; if such total cost is divided by the quantity produced, average or unit cost is obtained. MARGINAL REVENUE:IS THE CHANGE IN REVENUE WHICH COMES FROM SELLING AN ADDITIONAL UNIT OF OUTPUT. MARGINAL COST:IS THE CHANGE IN COST WHICH COMES FROM PRODUCING AN ADDITIONAL UNIT OF OUTPUT.

12
AC AND AR ARE THE AVERAGE COST AND REVENUE COST CURVES. MC IS THE MARGINAL COST AND MARGINAL REVENUE. WHEN OUTPUT REACHES OM,MARGINAL REVENUE EQUALS MARGINAL COST AT E. HENCE PQRS IS THE PROFIT. BEYOND OM OUTPUT,THE MC CURVE IS HIGHER THAN MR CURVE WHICH INDICATES LOSSES. THUS PROFITS ARE MAXIMUM WHEN MR=MC. AC AND AR ARE THE AVERAGE COST AND REVENUE COST CURVES. MC IS THE MARGINAL COST AND MARGINAL REVENUE. WHEN OUTPUT REACHES OM,MARGINAL REVENUE EQUALS MARGINAL COST AT E. HENCE PQRS IS THE PROFIT. BEYOND OM OUTPUT,THE MC CURVE IS HIGHER THAN MR CURVE WHICH INDICATES LOSSES. THUS PROFITS ARE MAXIMUM WHEN MR=MC.

Similar presentations


 Quantity Demanded (Q) Total Revenue (R) Change in Total Revenue (ΔR) Marginal Revenue (ΔR.>")


 is the income generated from the sale of output in product markets. There are two main.>")


