Download presentation
Presentation is loading. Please wait.

2
Examination of the dynamics of imperfect markets with the aid of cost and revenue curves. The dynamics of imperfect markets with the aid of cost and revenue curves Monopolies Oligopolies Monopolistic competition

3
Imperfect market: a market in which at least one firm has market power. Imperfectly competitive markets include… Monopoly Monopoly Oligopoly Oligopoly Monopolistic competition Monopolistic competition

4
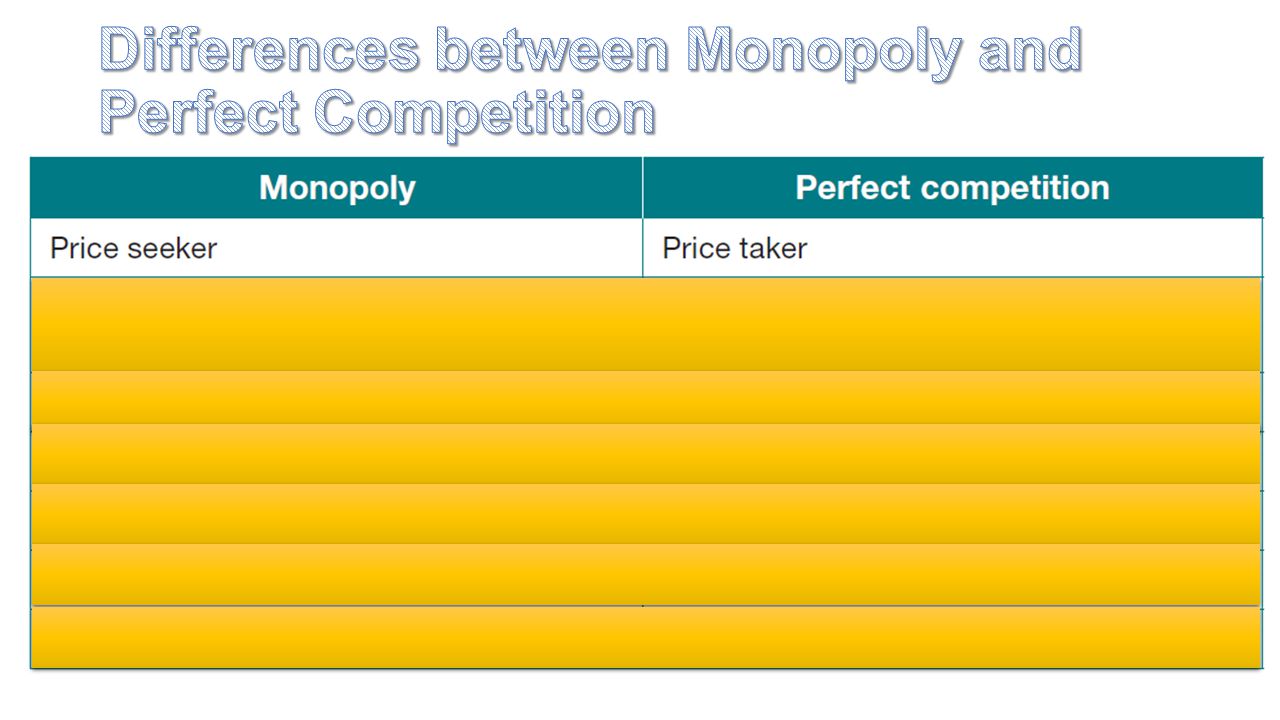
Imperfectly competitive firm faces downward sloping demand curve for its product. Can set market price by fixing quantity it supplies therefor a price setter/maker.

5
TR maximised where MR = zero. MR curve cuts X axis halfway btwn. origin and where AR/demand curve, cuts horizontal axis. Imperfectly competitive must reduce price if they wish to sell more causing TR to increase by smaller amounts MR curve negatively sloped & below AR/demand curve.

6
Monopoly: one firm in the industry responsible for total supply of output. Able to change market price by changing quantity it supplies. Supplies quantity that enables it to maximise profits (MR = MC).
..")
7
Single seller (price maker) Unique product Complete barriers to entry Incomplete information Can make economic profit in the long run.
 Unique product Complete barriers to entry Incomplete information Can make economic profit in the long run.")
8
Must choose combination of P & Q

9
Downward-sloping D curve means increased sales = decreased price. Therefore MR will be less than price.

10
Same as for any other producer

11
NORMAL PROFITS: NORMAL PROFITS: AC = AR (demand) curve Total revenue = Total cost ECONOMIC PROFITS: ECONOMIC PROFITS: AR < AC Total revenue > Total cost ECONOMIC LOSSES: ECONOMIC LOSSES: AC > AR Total revenue < Total cost LR: only normal or economic profits.
 curve Total revenue = Total cost ECONOMIC PROFITS: ECONOMIC PROFITS: AR < AC Total revenue > Total cost ECONOMIC LOSSES: ECONOMIC LOSSES: AC > AR Total revenue < Total cost LR: only normal or economic profits.")
Similar presentations