Download presentation
Presentation is loading. Please wait.

1
Lesson 11-1

2
Rebecca and Tova have math class right after lunch. Rebecca always eats a hot lunch on days when she has an exam, because she has a theory that people score a little higher on math exams when they have eaten a hot meal. Tova is very skeptical of this theory. How can Rebecca and Tova test whether the theory is valid?

3
Rebecca and Tova write down as many of their own exam scores as they can remember, and they record whether they had a cold lunch or hot lunch on the days of those exams. They ask a few of their friends to give them the same information. Then they find the average of all the scores associated with a cold lunch and all the scores associated with a hot lunch. This type of study, in which data are collected from a sample convenient to the investigators, is called anecdotal. Though it is not an accurate or scientific kind of study, this approach is used very frequently. Here are three better ways to collect sample data for a study.

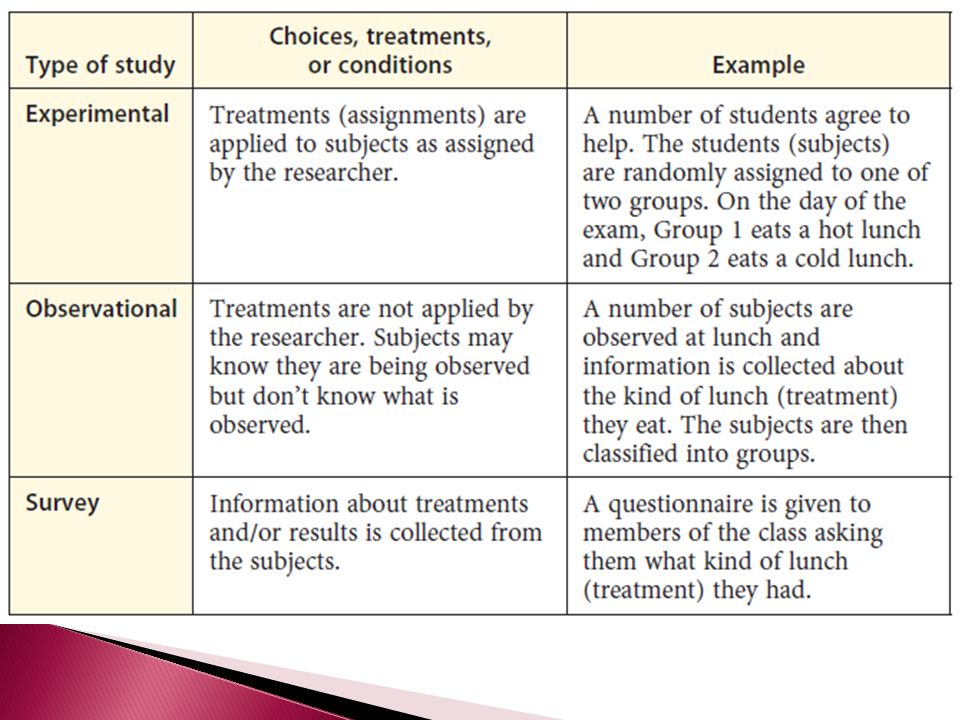
5
The diagram shows the stages of an experimental study.

6
After using any of these methods to collect information about the type of lunch students ate, Rebecca and Tova would need to learn the exam scores for the students who participated in the study. For this study it would be best if they gave the names of the students in each lunch-type group to the teacher, who could provide the mean and standard deviation of the exam scores of each group. Each type of study has advantages and disadvantages. In the investigation you will use two of the methods to conduct a study.

7
Consider this hypothesis: Listening to music while doing math homework will shorten the time it takes to complete the assignment. Your group will design two studies that could test this hypothesis. Choose two of the types of study described on the previous page, and describe how you would collect sample data for the study. Provide enough detail so that another group could use your description to collect data in the same way. Keep in mind these points as you design your study:

8
If you design an experiment, you must describe what treatments will be used and how subjects will be assigned to a treatment. To design an observational study, you must describe what is to be observed and measured and how you’ll decide which subjects to observe. A survey plan must address who will be surveyed, the method of survey (interview, paper questionnaire, e-mail, and so on), and the exact questions to be asked.
, and the exact questions to be asked..")
9
When the assignment of treatments in an experiment is done so that the groups are not biased, then the conclusions of the experiment may indicate causation. If Rebecca implements a carefully designed experimental study, she might find that students having a hot lunch did much better on exams than those eating a cold lunch. If so, she would have evidence that eating the hot lunch “caused” the students to perform better on the exam. However, if Rebecca used either an observational study or a survey, she could conclude only that there’s an association between the type of lunch and exam scores. Careful experimental studies are the primary way to learn about causation. Only a huge observational study over a long period of time can indicate causation. On the other hand, observational studies and surveys are often more practical than experimental studies, and they do not require subjects to give up control of their own treatment.

10
In all types of studies, a major concern is to minimize bias that will invalidate the results. In experimental studies, the way subjects are assigned to a treatment may affect the data. Observational studies may omit consideration of some subjects. Surveys may be biased by the selection of the participants, by the truthfulness of the subjects, and by how the questions are phrased.

11
Brandon surveyed some students and found that the average amount of sleep for female students was much higher than that for male students. Later, a thorough follow-up study concluded that the average amount of sleep was the same for males and females. Give some possible reasons for the discrepancy in the results. How could Brandon design a better survey?

12
The original survey may have been biased by how Brandon selected the students to be sampled. For example, the only males he sampled might have been friends who had similar sleeping patterns to his own. Or students who were reluctant to talk about their sleep habits may have declined to participate. Or the participants may have misunderstood the questions. One way Brandon could minimize bias is to choose subjects randomly. In addition, Brandon should ask some other people to review the questions in his survey to make sure the phrasing of the questions does not influence the answers given or the likelihood that a person would choose not to respond.

13
No matter how the data are collected, a researcher must be concerned about over- or under-representing subgroups of the population. For instance, Brandon might have overrepresented his male friends.

14
As another example, suppose you want to design a study about the effectiveness of a new fertilizer. If all of your evidence comes from using the fertilizer on tomato plants, then your conclusion can be only about tomato plants, not about all plants. If your data come from several types of plants, but most of your data are from tomato plants, then the data will be biased because one segment of the population is overrepresented. A study based on biased data will not necessarily have incorrect conclusions, but the methods of data collection should be described so that those who read about the study know of the sampling bias.

15
Newspapers or other sources do not always include enough information about a study to determine whether the statistics are reliable. As an educated consumer, before accepting a conclusion from a study you need to know how the data were collected and whether any bias or other errors could be present.

16
Evaluate each of these statistics. ◦ Arthur says that 71.43% of students hate the new school dress code. He interviewed seven people in the parking lot after school and asked them, “Do you like the way the school is forcing us to dress?” ◦ Betty claims that the typical student spends $19.93 on fast food every month. She passed out a survey to the 30 students in her algebra class, and 20 of the surveys were returned. The survey question read, “How much did you spend last week at fast-food restaurants?” ◦ Carl states that the number of students with multiple suspensions has increased by 67% in the last 10 years. He found out from school records that last year there were 5 students with multiple suspensions and 11 years ago there were only 3 students.

17
Although none of these students have lied about their results, all of them are using biased data or misrepresenting a statistic to make a point. a)Arthur’s conclusion does not match his question. A participant may object to being forced to dress in a certain way, but find nothing objectionable in the present dress code. Or subjects may have one small issue with the current code but overall think that it is fair. Arthur’s sample is biased because it didn’t include students who weren’t in the parking lot (such as those involved in after-school activities). Therefore, the students that he sampled may not share the same view about uniforms as the other students in the school.
Arthur’s conclusion does not match his question. A participant may object to being forced to dress in a certain way, but find nothing objectionable in the present dress code. Or subjects may have one small issue with the current code but overall think that it is fair. Arthur’s sample is biased because it didn’t include students who weren’t in the parking lot (such as those involved in after-school activities). Therefore, the students that he sampled may not share the same view about uniforms as the other students in the school..")
18
b)Betty multiplied her one-week figures to obtain a monthly value. This assumes that spending is uniform every week. You do not know whether the value is a mean or a median value. You do not know why 1/3 of the people did not return the survey. If participants had similar reasons for not returning the survey, it may be they had similar spending habits also. Because Betty chose to sample only students from algebra class, her coverage of students is biased.

19
c)c. Carl’s claim may sound as if he has many years of data instead of only two years. Also, the population of the school needs to be considered. Suppose there are 600 students at the school. Although it is true that there was an increase of 67% in the actual number of students with multiple suspensions, the ratio of students with multiple suspensions in the student body increased by only from 3/600 to 5/600. Also, if the population of the school has increased in the last ten years, the suspension rate may have actually decreased.

Similar presentations


 (6, 11) (10, 2)>")


 of experiments James M. Curran Department of Statistics, University of Auckland>")


