Download presentation
Presentation is loading. Please wait.

1
Poor mans temp attribution CCMVal DT attribution CCMval radiation comparison Piers Forster

2
Cordero and Forster, 2006 30N-30S 1979-2000 AR4 models

3
Cordero and Forster, 2006 50 hPa

4
CCMval Validation of Chemistry Climate Models – entering 3 rd year –Eyring et al. papers –Myself and Victor Formichev doing CCMVal radiation intercomparison. Victor does stratopause up – may extend to J values for chemists –May part is now supported by small grant so should progress faster

7
Cagnazzo et al ACP, 2007 Improvements to ECHAM5 SW scheme

8
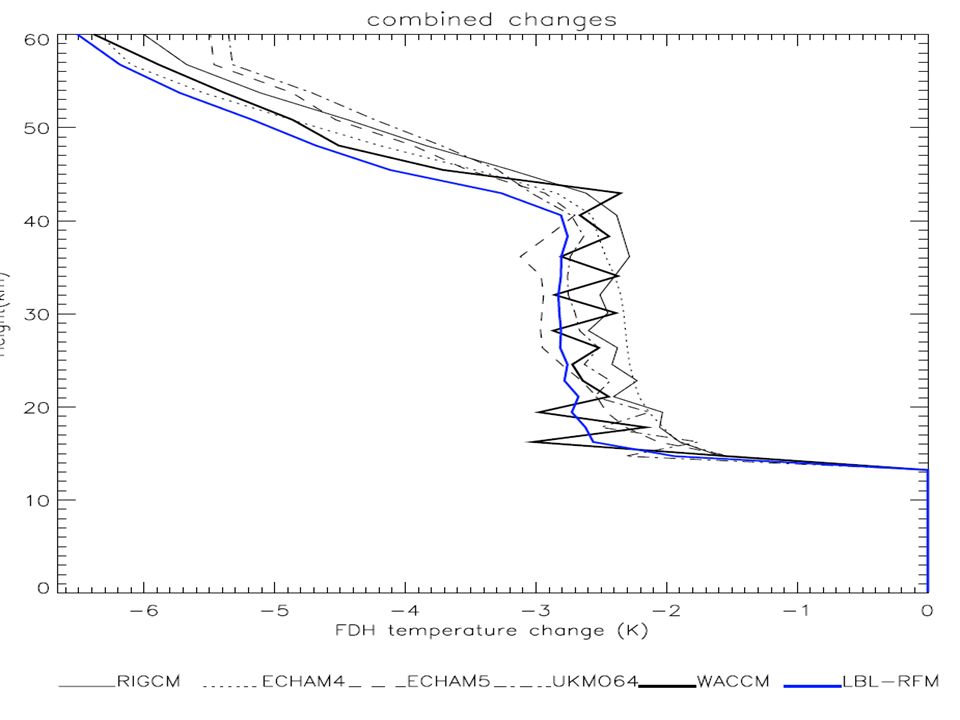
CCMVal Radiation: Future Testing Radiation schemes About 8 CCM groups signed up, hopefully get all involved Follow Collins et al. 2006 procedure Questionnaire for groups to document radn scheme Website with zonally averaged Jan climatology ERA40, up to 0.1 hPa Series of clear sky GHG perturbations: Ozone, water vapour, CO2, CH4, N2O Look at fluxes and heating rates –Maybe FDH calculations Maybe extend to: aerosol and cloud Worrying about truthing : LBL and Discrete-Ordinate Model (One so far + others)
.")
9
Problems with strat attribution IPCC type climate models: poor radiation schemes and resolution Coupled chemistry models are also now common and dont prescribe ozone Dont trust tropical tropopause response or polar stratospheric dynamical response Information lost in broad weighting functions

10
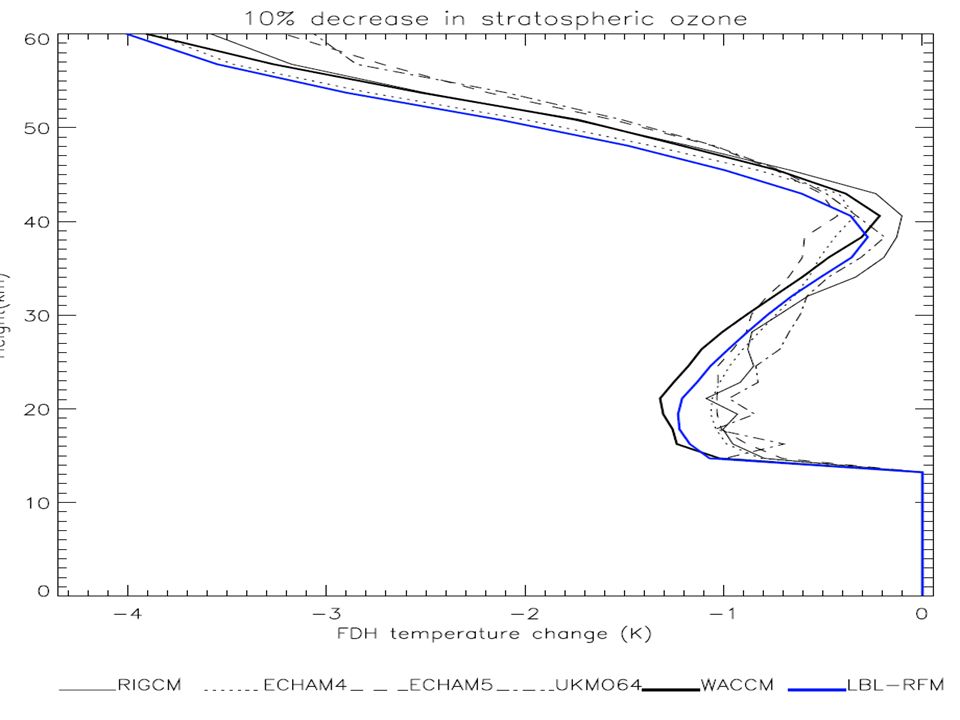
The answer Go back to doing Fixed Dynamical Heating rate calculations at high vertical resolution with accurate radiation schemes –Just like Ive always done!

11
Randel and Wu ozone - actual absolute monthly values – includes QBO and solar cycle effect on ozone, LLGHGs FDH

12
Tropics: lower strat

13
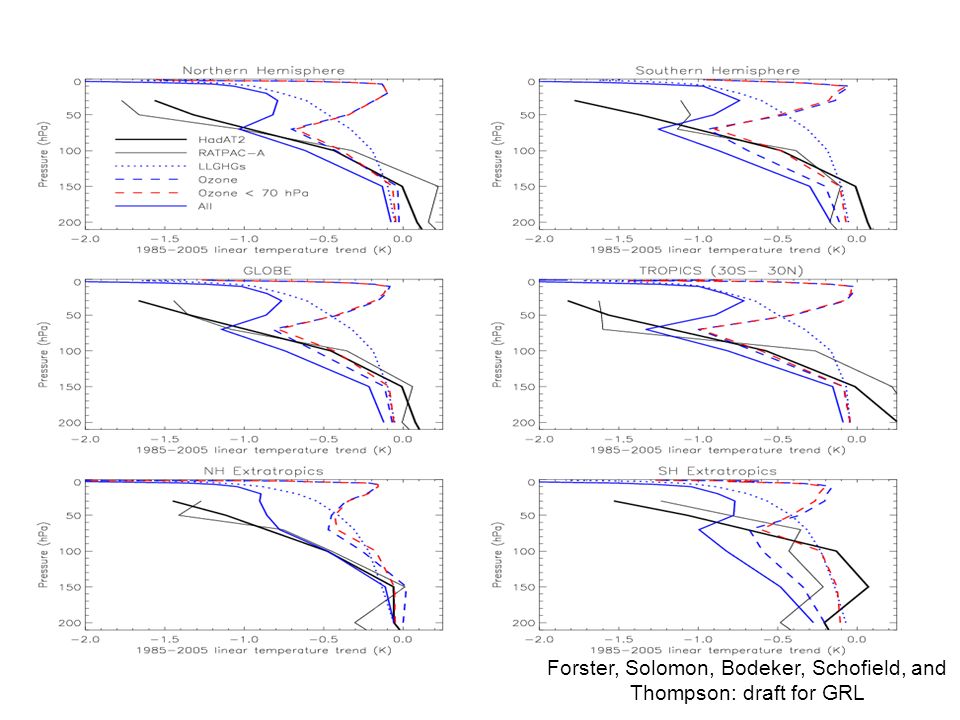
Forster, Solomon, Bodeker, Schofield, Thompson

14
Forster, Solomon, Bodeker, Schofield, and Thompson: draft for GRL

17
CCMVAL Temperature trends Austin et al. paper Simulations of temperature from models from 1970s until 2000 Output of zonally averaged, ozone, water vapour, llghgs, temp, (aerosols?) My task Do FDH temperature calcs with ozone and LLGHG trends from model to attribute model trends – i.e. understand model temp response
 My task Do FDH temperature calcs with ozone and LLGHG trends from model to attribute model trends – i.e. understand model temp response.")
18
Top of Atmosphere Fluxes

28
1985-2005 trends

Similar presentations


 2. Weighting functions.>")

. Significant quantitative differences.>")
 Picture: Strat Hour - July 05, 2006 The University.>")


