Download presentation
Presentation is loading. Please wait.

1
2011-12 KCS DATA OVERVIEW

2
Accountability Results Composite School Performance 2011-12 School2010-112011-12 1-Year Change 2-Year Change Met All AMO Targets?Growth? ALB76.70%74.00%-2.70%-5.00%YesYes- High KIS68.30%67.10%-1.20%-2.10%No KMS73.70%74.40%0.70%3.90%No Yes- Expected FP75.70%76.90%1.20%5.90%YesYes- High FLW74.60%71.90%-2.70%-1.30%No JP73.80%74.60%0.80%4.00%YesYes- High SB66.30%68.80%2.50%-1.10%NoYes- High WW73.10%71.4%-1.70%3.70%No

3
Three Ways to Meet AMOs Meet the target outright -The target is indicated by the yellow line which is the target for 2011-12. Meet the target using Safe Harbor*- If applicable, this is indicated by the red hash mark. If a school decreases the number of students not proficient by 10% in one year then they get credit for meeting that goal. Meet the target using Confidence Interval*- This is indicated by the hash mark the color of the performance bar. The confidence interval is a way of taking into account the precision of the performance composite. *Confidence Interval analysis is independent of the Safe Harbor calculations cannot be combined with Safe Harbor for any one student subgroup.

8
Reading Results

11
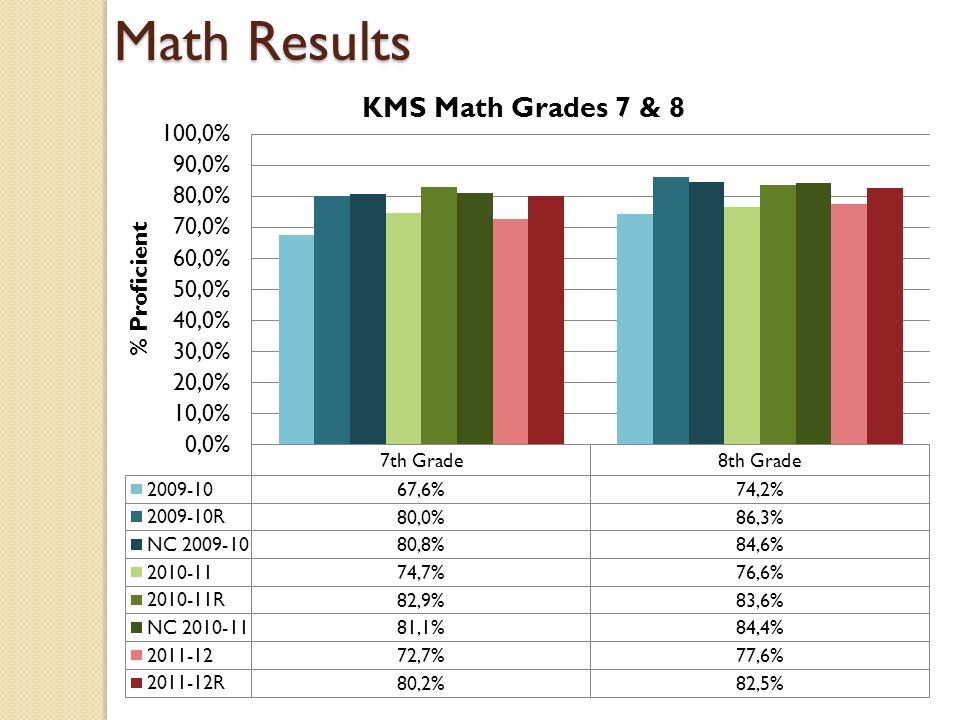
Math Results

14
EOC Results

15
MAKE UP OF THE READING EOG * The percentage of Informational Reading is going to increase significantly on the READY assessments. Goal 2: Apply strategies and skills to comprehend text that is read, heard, and viewed Goal 3: Make connections through the use of oral language, written language and media and technology

16
Goal Summaries

18
2011-12 Summary Graduation Rate of 82.8% AMO Results do not paint the whole picture for KCS 7 of 8 schools met all of their Math AMOs 7 of 8 schools met 80% or more of their Reading AMOs Celebrate our progress in the many areas of sustained student growth Have worked throughout the year to create a strategic plan for continued growth

19
New in 2012-13 New Curriculum and New Tests ◦ Online for all EOC’s and Science Assessments ◦ EXPLORE, PLAN & ACT ◦ New paper/pencil format for ELA and Math Re-norming of EOGs and EOCs New Accountability Model ◦ Using AMOs rather than AYP ◦ Using new measures for high school ACT, Work Keys, Future Ready Core, Grad Project, English 11 replaces English1 ◦ Using new growth model (EVAAS) New Reporting MSLs & Standard 6
 New Reporting MSLs & Standard 6")
20
Purpose of Measures of Student Learning Measure student learning in subjects and grades that are not part of the state testing program for Standard 6 of the teacher evaluation process. “Standard 6: Teachers contribute to the academic success of students. The work of the teacher results in acceptable, measureable progress for students based on established performance expectations using appropriate data to demonstrate growth.” Measures of Student Learning (MSLs) are NOT part of school or district accountability.
 are NOT part of school or district accountability..")
21
MEASURES OF STUDENT LEARNING Timeline: Phase 1 Phase 1: Fall 2012* *Fall semester MSLs will be available to LEAs on November 7, 2012. High School Science Courses High School ELA Courses High School Math Courses Occupational Course of Study Courses High School Core Social Studies Courses Earth/Environmental Science ELA IPre-calculusELA I, III, and IVWorld History PhysicsELA III Advanced Functions and Modeling Financial Management Civics & Economics ChemistryELA IVGeometryIntroductory MathU.S. History Physical Science Algebra II/Integrated Math III Applied ScienceAmerican History I American History II Phase 1: Spring 2013 Grade 3- N/AGrade 4- N/AGrade 5- N/AGrade 6- N/AGrade 7Grade 8 Science Social Studies

22
MEASURES OF STUDENT LEARNING Timeline: Phases 2 & 3 Phase 2: Fall 2013 High School Social Studies CoursesHealthful Living 21 st Century Global GeographyHealth Education Grade 9 PsychologyPhysical Education Grade 9 Sociology World Humanities American Humanities The Cold War 21 th Century Civil Liberties and Rights Turning Points in American History Phase 2: Spring 2014 Healthful Living Health Education Grades 3–8 Physical Education Grades 3–8 Phase 3: 2014–15 School Year More information coming soon.

23
K-2 MSLs DPI is currently working with the General Assembly and the early learning community on a grades K-3 reading assessment that would function like a running record and could be used to measure growth. There is a chance that DPI might be able to get the system up and running by second semester of 2012–2013, but it’s more likely this program would roll out in 2013–2014.

24
2012-13 Testing Schedule W-APT Testing o Begins August 27 th AIG Testing at Grades 3 and 5 o September 13 th and October 3 rd EXPLORE, PLAN, Work Keys and ACT o EXPLORE & PLAN window October 16 th o ACT- March 5 th (Make up- March 19 th ) ACCESS Testing o February 1 st - March 15 th READY EOGs & online READY EOCs o Last 15 days of the school year/semester EXTEND1 o April 15 th - June 14 th EXTEND2 EOGs and EOCs o Last 25 days of the school year MSLs in Grades 7-12 o Near the end of each semester
 ACCESS Testing o February 1 st - March 15 th READY EOGs & online READY EOCs o Last 15 days of the school year/semester EXTEND1 o April 15 th - June 14 th EXTEND2 EOGs and EOCs o Last 25 days of the school year MSLs in Grades 7-12 o Near the end of each semester")
25
Math Results

27
Reading Results

Similar presentations


 “No Child Left Behind” (2002) Adequacy Committee February 6,2008.>")


>")


