Download presentation
Presentation is loading. Please wait.

1
Melissa Davy Office for National Statistics
Pseudo-cohort analysis - trends in smoking data using the General Household Survey Melissa Davy Office for National Statistics

2
Introduction Why we carried out pseudo cohort analysis (PCA)
The advantages and disadvantages The survey we used in our analysis The methods we used Work through an example

3
Why is it useful to look at cohort analysis?
Interested in inequalities over time and by birth cohort People in different birth cohorts have different experiences Cohort analysis provides a better understanding of how events change over time

4
What is pseudo-cohort analysis?
- panel data - same individual Pseudo-cohort analysis - cross-sectional data - average experience of a given cohort For example - aged 20 to 25 in a 1980 survey = 21 to 26 in 1981 = 22 to 27 in 1982 = 44 to 49 in 2004.

5
Advantages of pseudo-cohort analysis
Uses data that are already available New sample each year so no problem of non-random attrition Less burden on respondents More frequent data

6
Disadvantages of pseudo-cohort analysis
Variations in the nature of the samples surveyed Looking at average experience of the cohort limits the use of the data Recall bias Not straightforward Small cell sizes

7
General Household Survey
Dataset goes back more than 30 years The GHS covers a range of topics Relatively large sample size High quality data source

8
Extracting the data – create a database which includes all survey years – create a birth cohort variable Disadvantages - Time consuming Advantages Valuable research tool Exploiting full potential of the GHS data Makes time series analysis easier

9
Creating the dataset Long process documented in:
Uren Z (2006) The GHS Pseudo Cohort Dataset (GHSPCD): Introduction and Methodology. Survey Methodology Bulletin, no 59, pp25-37. Available at: contains over 40 variables, records for over 800,000 individuals.
 The GHS Pseudo Cohort Dataset (GHSPCD): Introduction and Methodology. Survey Methodology Bulletin, no 59, pp Available at: ID=1637. contains over 40 variables, records for over 800,000 individuals.")
10
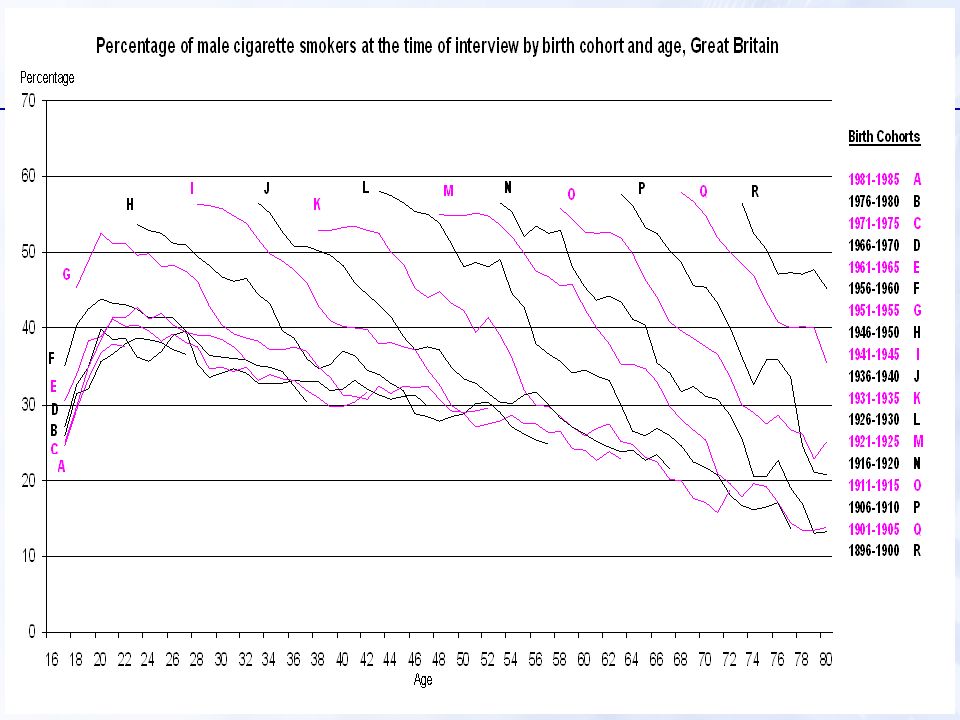
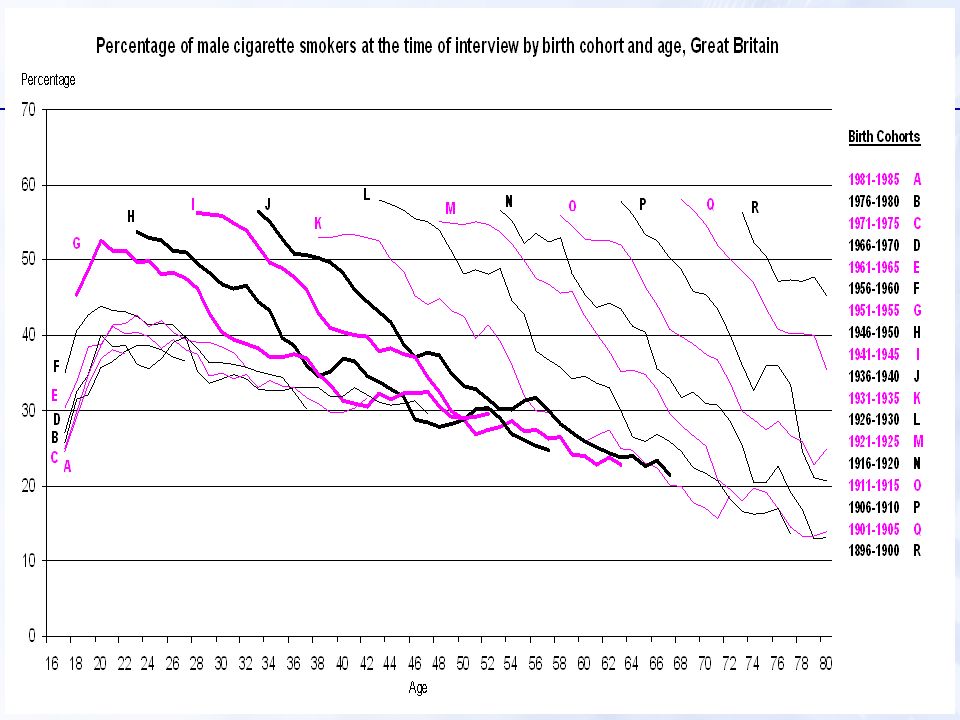
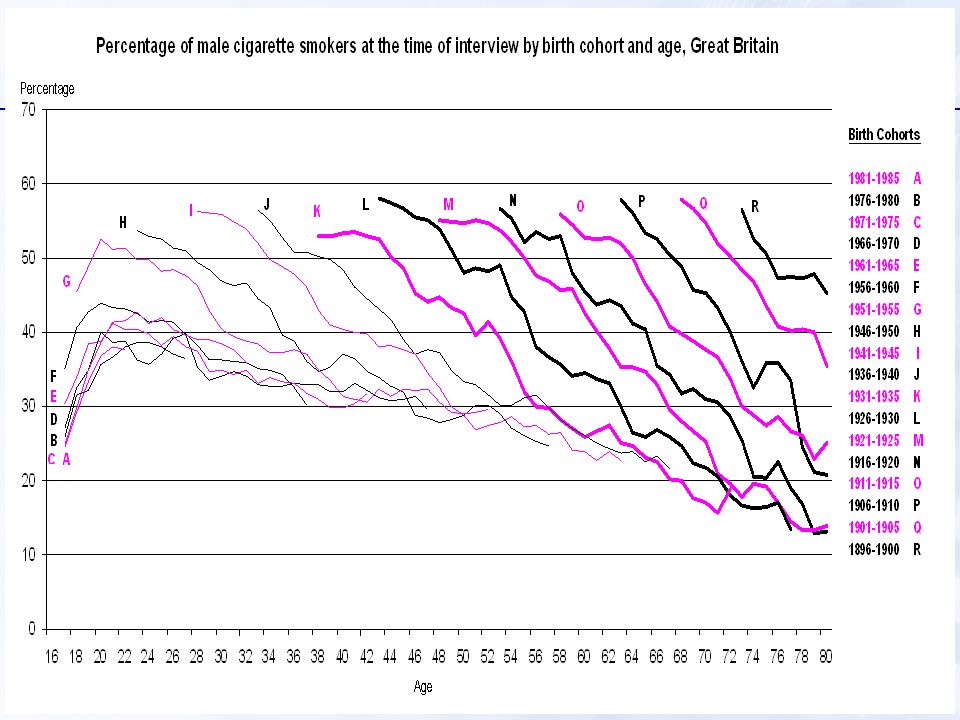
The smoking example Analysis of smoking among men trends over time
trends by age pseudo-cohort analysis - interaction of time and age

24
Main findings At every age, men smoke less than the previous generation. Not due to established smokers giving up more rapidly In the most recent cohorts - fewer men were starting to smoke but were then giving up at a slower rate than in the past. Smoking prevalence rates may be stabilising.

25
Conclusion Pseudo-cohort analysis gives us a better understanding of the GHS smoking data

Similar presentations


 Anita Ratcliffe.>")


 rolling programme>")

>")


