Download presentation
Presentation is loading. Please wait.

1
Local demographic rates from the 2001 census When is a proportion a most difficult thing to estimate? Ludi Simpson and Matt Bowen, Centre for Census and Survey Research, March 16 th 2004

2
Rochdale 43 African older women 28 economically active = 65% National=60% Census – (almost) all women –but one years women –is it robust enough to use in a forecast? Alternatives: –Use local rate –Collapse categories – use Black –Use national rate as more robust –Weight local and national Bradford top up rule: weight with national women to 100 (43*65% + 57*60%) = 62%
 = 62%.")
3
Rochdale 43 African older women 28 economically active = 65% National=60% Is 65% a Rochdale feature, or is it sampling error? How best to estimate each local rate? Does it matter? –Many rates to measure, most by age and sex Children/Women ratios: general fertility rate Migration rate, in and out Economic activity rate Household headship rate –With smaller samples, often wildly volatile –Require comparison between areas –Require best estimates of underlying or long term rates

4
Ethnic group demography ONS: National projections with ethnic group dimension Home Office: Community Cohesion Dept of Work and Pensions: raise economic activity; neighbourhood effects Local authorities: housing access Methods: small area estimation

5
Economic activity of women aged 25-74, Census 2001 Black: workers; Dark grey: Home/family; Light grey: Other Source: Census 2001 Table ST108, excluding retired

6
Extraction from SASPAC or csv files to SPSS Matrix commands to reshape giving ethnic group, population, economic activity variables

7
355 local authorities with Pakistani women aged 25-74 Oldham

8
National p=0.249 Confidence interval for LAD population n = ± sqrt(p*(p-1)/(n-1)
/(n-1)")
9
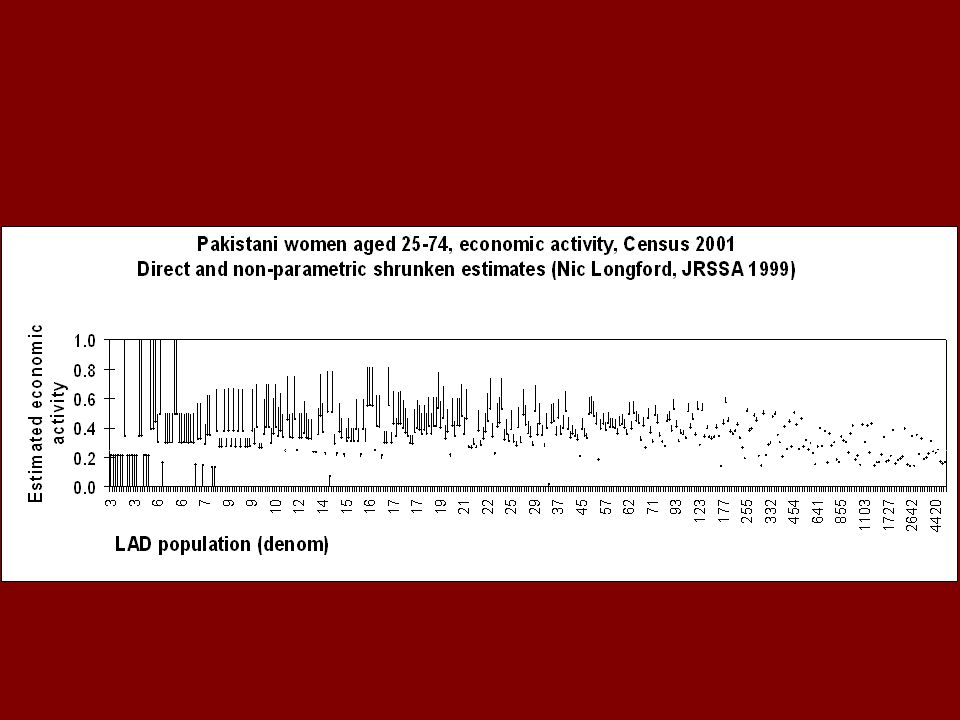
Economic activity, related to number of women P= 0.238P=0.444P=0.502

10
local area heterogeneity believe area proportion small samples weight to national mean Nic Longford, shrinkage estimators, JRSS(A) 1999 –No distributional assumptions –The area sample as a proportion of the whole –The combination of area and national proportions that minimises Mean Square Error of estimate from true local mean: Usually
 1999 –No distributional assumptions –The area sample as a proportion of the whole –The combination of area and national proportions that minimises Mean Square Error of estimate from true local mean: Usually")
12
Predict local means and shrink to those Combine two approaches to small area estimation –Model similarity of locality to others, to find their predicted mean Only as good as the model –Rely on direct local estimate when n is large Software limitations

13
Predictors of area economic activity

14
Modelling options for a rate p P as continuous variable, normal errors –No equivalent of shrinkage Numerator as count, denominator as offset, Poisson errors P as an aggregate 0-1 variable, Binomial errors: logistic –Not SPSS –MLwiN –STATA

15
Logistic transformation of proportion to avoid predicted values outside [0,1]
![Logistic transformation of proportion to avoid predicted values outside [0,1]](http://images.slideplayer.com/3/793075/slides/slide_15.jpg "Logistic transformation of proportion to avoid predicted values outside [0,1]")
16
Snijders and Bosker, 1999 Estimation procedures for these [binary outcome multilevel] models are still in a state of active development, with different and disputed levels of bias, mean square error and stability, dependent on starting values, data, complexity of the model and small group sizes
![Snijders and Bosker, 1999 Estimation procedures for these [binary outcome multilevel] models are still in a state of active development, with different and disputed levels of bias, mean square error and stability, dependent on starting values, data, complexity of the model and small group sizes](http://images.slideplayer.com/3/793075/slides/slide_16.jpg "Snijders and Bosker, 1999 Estimation procedures for these [binary outcome multilevel] models are still in a state of active development, with different and disputed levels of bias, mean square error and stability, dependent on starting values, data, complexity of the model and small group sizes")
17
Multilevel logistic model

18
MLwiNeth % mean ageuk-varianceExtra- parameters of pop2574born % LADsbinomial White Briton0.006-0.078-0.0720.0201.0 Irish-0.044-0.099-0.0100.0151.2 Other White-0.016-0.054-0.0090.0241.2 Caribbean / White-0.365-0.046-0.0140.007ns1.7 African / White-0.772-0.0250.000ns0.029*1.8 Asian / White-0.492-0.030-0.0100.0391.7 Other mixed-0.341-0.020-0.003ns0.013ns1.9 Indian-0.025-0.015ns-0.0030.1071.5 Pakistani-0.1810.008ns-0.0110.2081.7 Bangladeshi-0.054-0.010ns-0.0210.2352.7 Other Asian-0.0690.034-0.0140.1322.5 Caribbean-0.024-0.0790.007*0.0332.4 African-0.036-0.0480.006ns0.1392.1 Other Black-0.012ns-0.035-0.001ns0.021ns2.4 Chinese-0.212-0.038-0.003ns0.0410.7 Other-0.1080.008ns-0.009*0.0931.1

19
LAD predicted economic activity from fixed model, 3 predictors

20
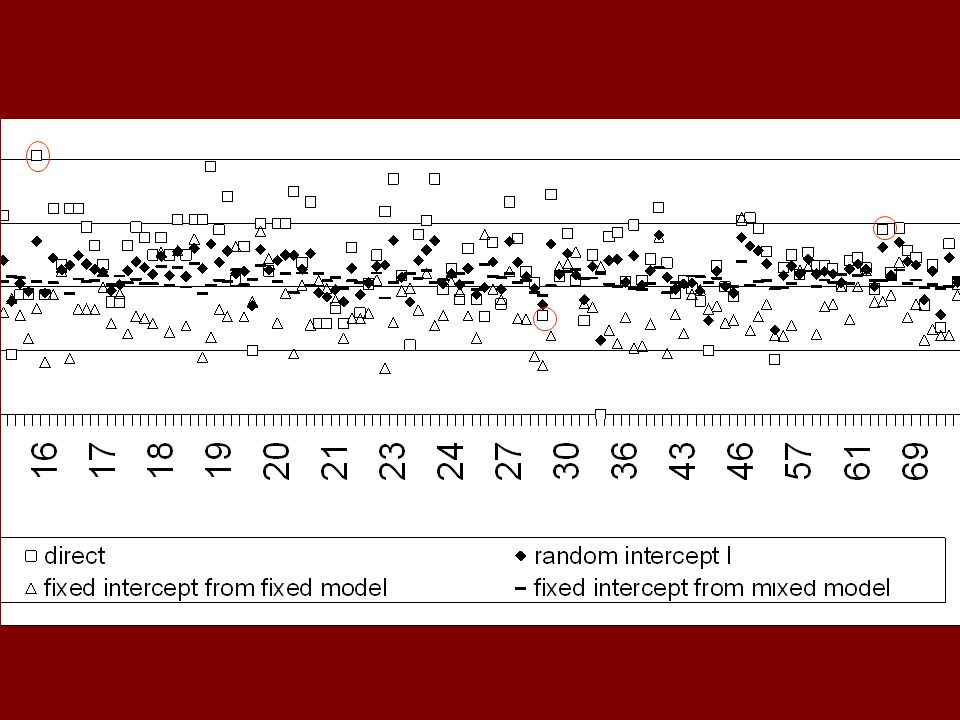
Shrinkage from observed proportion towards modelled proportion

23
Shrinkage with random intercept only, NOT equal to shrinkage to the overall mean

24
Conclusions Shrinkage using variance components models is suitable for small area estimation –especially where the area populations vary greatly It makes little difference to proportions based on populations over 100 Modelling allows borrowing strength from similar areas –The model must fit well The software for mixed models does not shrink to the overall mean (or fixed effects prediction in the case of continuous predictors) –Software and documentation under development
 –Software and documentation under development")
Similar presentations


 Conference on Community, Migration and Ethnicity.>")
>")


