Download presentation
Presentation is loading. Please wait.

1
Carnegie Institution for Science 1530 P Street, NW Washington, DC 20005 April 18-21, 2011 Teach Epidemiology Professional Development Workshop Day 3

2
2 Revised Teach Epidemiology

3
3

4
4 A picture of the occurrence, the distribution, and the types of the diseases of mankind, in distinct epochs of time and at various points on the earth's surface, and... render an account of the relations of those diseases to the external condition. (Hirsch, 1883) What is epidemiology?
 What is epidemiology .")
5
5 The science of the mass phenomena of infectious diseases, or as the natural history of infectious diseases... an inductive science, concerned not merely with describing the distribution of the disease, but fitting it into a consistent philosophy. (Frost, 1927) What is epidemiology?
 What is epidemiology .")
6
6 Epidemiology may be defined as the study of the distribution of a disease or condition in a population and of the factors that influence this distribution. (Lilienfeld, 1957) What is epidemiology?
 What is epidemiology .")
7
7 Epidemiology is defined as the factors determining the frequency and distribution of disease in human populations. For many years the word covered only and quite specifically, the study of the spread and decline of communicable disease in human populations and the prophylaxis and control of those diseases... the scope includes all disease, acute or chronic, physical or mental, communicable or non- communicable. (Epidemiology: A Guide to Teaching Methods, 1973) What is epidemiology?
 What is epidemiology .")
8
8 Epidemiology is a method of reasoning about disease that deals with the biologic inferences derived from observations of disease phenomena in population groups. (Lilienfeld, 1977) What is epidemiology?
 What is epidemiology .")
9
9... the study of the distribution and determinants of health-related states or events in specified populations and the application of this study to the control of health problems. (Gordis, 2009) What is epidemiology?
 What is epidemiology .")
10
10

14
14 Ecologic Study Ecological Fallacy An error in inference due to failure to distinguish between information obtained from groups versus individuals. An association observed between variables at a population level does not necessarily hold true for individual members of these populations.

16
16 Outcome +- + - Exposure a c b d Ecologic Study

17
17

18
18

19
19

20
20

21
21

22
22 Random Assignment

23
23 Random Assignment

24
24 Healthy People E Random Assignment E O O O O Blinding Trial Investigators Participants Assessors

25
25 External Data Monitoring Board Ethical Issues

26
26 Time Check 9:45 AM

27
27

28
28 Revised Teach Epidemiology

29
29 National Research Council, Learning and Understanding Teach Epidemiology Enduring Epidemiological Understandings Knowledge that “… is connected and organized, and … ‘conditionalized’ to specify the context in which it is applicable.”

30
30 Association Found Between Coffee and Pancreatic Cancer Associated Teach Epidemiology

31
31 What do we mean when we say that there is an association between two things? Associated TiedRelated Linked Things that are associated are linked in some way that makes them turn up together. Associated Teach Epidemiology

32
32 Things that are associated are linked in some way that makes them turn up together. Associated Teach Epidemiology

33
33 Suicide Higher in Areas with Guns Smoking Linked to Youth Eating Disorders Snacks Key to Kids’ TV- Linked Obesity: China Study Family Meals Are Good for Mental Health Lack of High School Diploma Tied to US Death Rate Study Links Spanking to Aggression Breakfast Each Day May Keep Colds Away Study Concludes: Movies Influence Youth Smoking Study Links Iron Deficiency to Math Scores Kids Who Watch R-Rated Movies More Likely to Drink, Smoke Pollution Linked with Birth Defects in US Study Depressed Teens More Likely to Smoke Associated Teach Epidemiology

34
34 Epidemiologic studies that are concerned with characterizing the amount and distribution of health and disease within a population. Descriptive Epidemiology Teach Epidemiology

35
35 Epidemiologic studies that are concerned with determinants of disease and the reasons for relatively high or low frequencies of disease in specific population subgroups. Analytical Epidemiology Teach Epidemiology

36
36 Hypothesis Formulating Descriptive Epidemiology Testing Analytical Epidemiology An unproven idea, based on observation or reasoning, that can be supported or refuted through investigation An educated guess Hypothesis Teach Epidemiology

37
37 Hypothesis: Buprenorphine will stop heroin addicts from using heroin. Making Group Comparisons and Identifying Associations Teach Epidemiology

38
38 Population Trial 1 Making Group Comparisons and Identifying Associations

39
39 Population 500 Heroin Addicts Sample 100 Heroin Addicts 10 Weeks Trial 1 Making Group Comparisons and Identifying Associations

40
40 Population 500 Heroin Addicts Sample 100 Heroin Addicts 10 Weeks 21 Heroin Addicts Tested Negative for Heroin Trial 1 Making Group Comparisons and Identifying Associations

41
41 Bupe Tested Positive for Heroin Total 1002179 Tested Negative for Heroin Trial 1 Making Group Comparisons and Identifying Associations Teach Epidemiology

42
42 When you can measure what you are speaking about, and express it in numbers, you know something about it. Lord Kelvin But when you cannot measure it, when you cannot express it in numbers, your knowledge is of a meager and unsatisfactory kind. Making Group Comparisons and Identifying Associations Teach Epidemiology

43
43 A measure of how often an outcome occurs in a defined population in a defined period of time. It consists of a numerator and a denominator. Risk The numerator is the number of people in the population or sample who experienced the outcome and the denominator is the total number of people in the population or sample. Population / Sample Outcome Denominator Numerator Making Group Comparisons and Identifying Associations Teach Epidemiology

44
44 … the risk of a negative heroin test was 21 / 100 in a 10-week period 21 tested negative for heroin 100 study subjects Numerator Denominator Risk Making Group Comparisons and Identifying Associations Teach Epidemiology

45
45 A measure of how often an outcome occurs in a defined group of people in a defined period of time. The likelihood of an outcome occurring. Risk / Rate Making Group Comparisons and Identifying Associations Teach Epidemiology

46
46 Trial 1 Bupe Tested Positive for Heroin 1002179 Tested Negative for Heroin 21 100 or 21 % Calculating Risk Risk of Negative Heroin Test Total Making Group Comparisons and Identifying Associations Teach Epidemiology

47
47 Process of predicting from what is observed in a sample to what is true for the entire population. Inference Making Group Comparisons and Identifying Associations Teach Epidemiology

48
48 Trial 1 What does this tell you about the hypothesis? Buprenorphine will stop heroin addicts from using heroin. Inference Probe Bupe Tested Positive for Heroin 1002179 Tested Negative for Heroin 21 100 or 21 % Risk of Negative Heroin Test Total Making Group Comparisons and Identifying Associations Teach Epidemiology

49
49 People who participate in a trial, but do not get the treatment. People whose results are compared to the group that was treated. Control Group Making Group Comparisons and Identifying Associations Teach Epidemiology

50
50 21 100 or 21 % 1007921 Tested Positive for Heroin Tested Negative for Heroin Bupe Control Group Extend and label the table to include a control group. Risk of Negative Heroin Test Total Making Group Comparisons and Identifying Associations Teach Epidemiology

51
51 100 ? or ? % No Bupe Control Group Making Group Comparisons 21 100 or 21 % 1007921 Tested Positive for Heroin Tested Negative for Heroin Bupe Risk of Negative Heroin Test Total Making Group Comparisons and Identifying Associations Teach Epidemiology

52
52 100 ? or ? % No Bupe Making Group Comparisons 21 100 or 21 % 1007921 Tested Positive for Heroin Tested Negative for Heroin Bupe ExposureExposure Outcome / Disease ab cd Risk of Negative Heroin Test Total Making Group Comparisons and Identifying Associations Teach Epidemiology

53
53 21 100 or 21 % Total 1007921 Bupe 100 ? or ? % No Bupe Tested Negative for Heroin Tested Positive for Heroin Risk of Negative Heroin Test Making Group Comparisons and Identifying Associations Teach Epidemiology

54
54 A cross-classification of data where categories of one variable are presented in rows and categories of another variable are presented in columns The simplest contingency table is the 2x2 table. Contingency Table Making Group Comparisons and Identifying Associations Teach Epidemiology

55
55 Population 500 Heroin Addicts Sample 100 Heroin Addicts 10 Weeks 21 Heroin Addicts Tested Negative for Heroin Trial 1 Making Group Comparisons and Identifying Associations

56
56 Trial 2 Total ? 100 ? % a b c d Bupe Tested Negative for Heroin Tested Positive for Heroin No Bupe100 ? ? % Risk of Negative Heroin Test Making Group Comparisons and Identifying Associations Teach Epidemiology

57
57 E Assigned E O O O O Making Group Comparisons and Identifying Associations Volunteer Heroin Addicts Teach Epidemiology

58
58 21 100 21% 2179100 or a b c d Bupe Trial 2 No Bupe Probe Total Tested Negative for Heroin Tested Positive for Heroin Risk of Negative Heroin Test Making Group Comparisons and Identifying Associations Teach Epidemiology

59
59 21 100 21% 2179100 or a b c d Bupe Trial 2 No Bupe Total Tested Negative for Heroin Tested Positive for Heroin Risk of Negative Heroin Test 21 100 21% 2179100 or Making Group Comparisons and Identifying Associations Teach Epidemiology

60
60 21 100 21% 2179100 or a b c d Bupe Trial 2 No Bupe Total Tested Negative for Heroin Tested Positive for Heroin Risk of Negative Heroin Test 21 100 21% 2179100 or Inference: Process of predicting from what is observed in a sample to what is occurring in the entire population Making Group Comparisons and Identifying Associations Teach Epidemiology

61
61 When you can measure what you are speaking about, and express it in numbers, you know something about it. Lord Kelvin But when you cannot measure it, when you cannot express it in numbers, your knowledge is of a meager and unsatisfactory kind. Making Group Comparisons and Identifying Associations Teach Epidemiology

62
62 The value obtained by dividing one quantity by another Ratio Making Group Comparisons and Identifying Associations Teach Epidemiology

63
63 21 100 21% 2179100 or a b c d Bupe Trial 2 No Bupe Total Tested Negative for Heroin Tested Positive for Heroin Risk of Negative Heroin Test 21 100 21% 2179100 or Ratio: The value obtained by dividing one quantity by another Risk Ratio: The ratio of two risks 1 Risk Ratio Making Group Comparisons and Identifying Associations Teach Epidemiology

64
64 21 100 21% 2179100 or a b c d Bupe Trial 2 No Bupe Total Tested Negative for Heroin Tested Positive for Heroin Risk of Negative Heroin Test 21 100 21% 2179100 or Ratio: The value obtained by dividing one quantity by another Risk Ratio: The ratio of two risks 1 Risk Ratio Create a formula a a + b c c + d Making Group Comparisons and Identifying Associations Teach Epidemiology

65
65 21 100 21% 2179100 or a b c d Bupe Trial 2 No Bupe Total Tested Negative for Heroin Tested Positive for Heroin Risk of Negative Heroin Test 21 100 21% 2179100 or 1 Risk Ratio Relative Risk: The ratio of the risk of an outcome among the exposed to the risk of the outcome among the unexposed. Relative Risk Making Group Comparisons and Identifying Associations Teach Epidemiology

66
66 21 100 21% 2179100 or a b c d Bupe Trial 2 No Bupe Total Tested Negative for Heroin Tested Positive for Heroin Risk of Negative Heroin Test 21 100 21% 2179100 or 1 Risk Ratio Relative Risk Inference: Process of predicting from what is observed in a sample to what is occurring in the entire population The inference here is that there is no effect of Buprenorphine Making Group Comparisons and Identifying Associations Teach Epidemiology

67
67 Trial 3 ? 100 ? % 100 or a b c d Bupe No Bupe Total Tested Negative for Heroin Tested Positive for Heroin Risk of Negative Heroin Test ? 100 ? % 100 or Making Group Comparisons and Identifying Associations Teach Epidemiology

68
68 21 100 21% 2179100 or a b c d Bupe No Bupe Total Tested Negative for Heroin Tested Positive for Heroin Risk of Negative Heroin Test Trial 3 Making Group Comparisons and Identifying Associations Teach Epidemiology

69
69 21 100 21% 2179100 or a b c d Bupe No Bupe Total Tested Negative for Heroin Tested Positive for Heroin Risk of Negative Heroin Test 62 100 62% 6238100 or Trial 3 Making Group Comparisons and Identifying Associations Teach Epidemiology

70
70 21 100 21% 2179100 or a b c d Bupe No Bupe Total Tested Negative for Heroin Tested Positive for Heroin Risk of Negative Heroin Test 62 100 62% 6238100 or Inference: Process of predicting from what is observed in a sample to what is occurring in the entire population Trial 3 Making Group Comparisons and Identifying Associations Teach Epidemiology

71
71 21 100 21% 2179100 or a b c d Bupe No Bupe Total Tested Negative for Heroin Tested Positive for Heroin Risk of Negative Heroin Test 62 100 62% 6238100 or Relative Risk Relative Risk: The ratio of the risk of an outcome among the exposed to the risk of the outcome among the unexposed. 0.34 Trial 3 Making Group Comparisons and Identifying Associations Teach Epidemiology

72
72 21 100 21% 2179100 or a b c d Bupe No Bupe Total Tested Negative for Heroin Tested Positive for Heroin Risk of Negative Heroin Test 62 100 62% 6238100 or Relative Risk 0.34 The heroin addicts who received Bupe were ___ times as likely to test negative for heroin as those who did not receive Bupe. 0.34 Trial 3 Making Group Comparisons and Identifying Associations Teach Epidemiology

73
73 21 100 21% 2179100 or a b c d Bupe No Bupe Total Tested Negative for Heroin Tested Positive for Heroin Risk of Negative Heroin Test 62 100 62% 6238100 or Relative Risk 0.34 Inference: Process of predicting from what is observed in a sample to what is occurring in the entire population. Trial 3 Making Group Comparisons and Identifying Associations Teach Epidemiology

74
74 Trial 4 ? 100 ? % 100 or a b c d Bupe No Bupe Total Tested Negative for Heroin Tested Positive for Heroin Risk of Negative Heroin Test ? 100 ? % 100 or Making Group Comparisons and Identifying Associations Teach Epidemiology

75
75 21 100 21% 2179100 or a b c d Bupe No Bupe Total Tested Negative for Heroin Tested Positive for Heroin Risk of Negative Heroin Test Trial 4 Making Group Comparisons and Identifying Associations Teach Epidemiology

76
76 21 100 21% 2179100 or a b c d Bupe No Bupe Total Tested Negative for Heroin Tested Positive for Heroin Risk of Negative Heroin Test 6 100 6% 694100 or Trial 4 Making Group Comparisons and Identifying Associations Teach Epidemiology

77
77 21 100 21% 2179100 or a b c d Bupe No Bupe Total Tested Negative for Heroin Tested Positive for Heroin Risk of Negative Heroin Test 6 100 6% 694100 or Relative Risk Relative Risk: The ratio of the risk of an outcome among the exposed to the risk of the outcome among the unexposed. 3.5 Trial 4 Making Group Comparisons and Identifying Associations Teach Epidemiology

78
78 21 100 21% 2179100 or a b c d Bupe No Bupe Total Tested Negative for Heroin Tested Positive for Heroin Risk of Negative Heroin Test 6 100 6% 694100 or Relative Risk 3.5 The heroin addicts who received Bupe were ___ times as likely to test negative for heroin as those who did not receive Bupe. 3.5 Trial 4 Making Group Comparisons and Identifying Associations Teach Epidemiology

79
79 21 100 21% 2179100 or a b c d Bupe No Bupe Total Tested Negative for Heroin Tested Positive for Heroin Risk of Negative Heroin Test 6 100 6% 694100 or Relative Risk 3.5 Inference: Process of predicting from what is observed in a sample to what is occurring in the entire population. Trial 4 Making Group Comparisons and Identifying Associations Teach Epidemiology

80
80 21 100 21% 2179100 or Bupe Trial 1 Total Tested Negative for Heroin Tested Positive for Heroin Risk of Negative Heroin Test What do the results tell us about the hypothesis that Buprenorphine will stop heroin addicts from using heroin? Nothing Making Group Comparisons and Identifying Associations Teach Epidemiology

81
81 Trial 1 Trial 2 Trial 3 Trial 4 Making Group Comparisons and Identifying Associations Teach Epidemiology

82
82 Nothing Bupe Total Trial 1 Trial 2 Trial 3 Trial 4 Risk of Negative Heroin Test Tested Negative for Heroin Tested Positive for Heroin 1002179 90 or 21% 21 100 Making Group Comparisons and Identifying Associations Teach Epidemiology

83
83 Risk of Negative Heroin Test Nothing Bupe Total Trial 1 Trial 2 Trial 3 Trial 4 Bupe No Bupe Bupe No Bupe Bupe Total Relative Risk No Bupe Total Relative Risk Total Tested Negative for Heroin Tested Positive for Heroin Relative Risk Risk of Negative Heroin Test Tested Negative for Heroin Tested Positive for Heroin Risk of Negative Heroin Test Tested Negative for Heroin Tested Positive for Heroin Risk of Negative Heroin Test Tested Negative for Heroin Tested Positive for Heroin 1002179 90 or 21% 21 100 Making Group Comparisons and Identifying Associations Teach Epidemiology

84
84 Risk of Negative Heroin Test Nothing Bupe Total Trial 1 Trial 2 Trial 3 Trial 4 Bupe No Bupe Bupe No Bupe Bupe Total Relative Risk No Bupe Total Relative Risk Total Tested Negative for Heroin Tested Positive for Heroin Relative Risk Risk of Negative Heroin Test Tested Negative for Heroin Tested Positive for Heroin Risk of Negative Heroin Test Tested Negative for Heroin Tested Positive for Heroin Risk of Negative Heroin Test Tested Negative for Heroin Tested Positive for Heroin 1002179 90 or 21% 21 100 2179 90 or 21% 21 100 2179 90 or 21% 21 100 2179 90 or 21% 21 100 Making Group Comparisons and Identifying Associations Teach Epidemiology

85
85 Risk of Negative Heroin Test Nothing Bupe Total Trial 1 Trial 2 Trial 3 Trial 4 Bupe No Bupe Bupe No Bupe Bupe Total Relative Risk No Bupe Total Relative Risk Total Tested Negative for Heroin Tested Positive for Heroin Relative Risk Risk of Negative Heroin Test Tested Negative for Heroin Tested Positive for Heroin Risk of Negative Heroin Test Tested Negative for Heroin Tested Positive for Heroin Risk of Negative Heroin Test Tested Negative for Heroin Tested Positive for Heroin 1002179 90 or 21% 21 100 2179 90 or 21% 21 100 2179 90 or 21% 21 100 2179 90 or 21% 21 100 2179 90 or 21% 21 100 1 Bupe is not associated with having a negative test for heroin. Making Group Comparisons and Identifying Associations Teach Epidemiology

86
86 Risk of Negative Heroin Test Nothing Bupe Total Trial 1 Trial 2 Trial 3 Trial 4 Bupe No Bupe Bupe No Bupe Bupe Total Relative Risk No Bupe Total Relative Risk Total Tested Negative for Heroin Tested Positive for Heroin Relative Risk Risk of Negative Heroin Test Tested Negative for Heroin Tested Positive for Heroin Risk of Negative Heroin Test Tested Negative for Heroin Tested Positive for Heroin Risk of Negative Heroin Test Tested Negative for Heroin Tested Positive for Heroin 1002179 90 or 21% 21 100 2179 90 or 21% 21 100 2179 90 or 21% 21 100 2179 90 or 21% 21 100 2179 90 or 21% 21 100 Bupe is not associated with having a negative test for heroin. 1 1006238 90 or 62% 62 100 Bupe is associated with having a positive test for heroin!.34 Making Group Comparisons and Identifying Associations Teach Epidemiology

87
87 Risk of Negative Heroin Test Nothing Bupe Total Trial 1 Trial 2 Trial 3 Trial 4 Bupe No Bupe Bupe No Bupe Bupe Total Relative Risk No Bupe Total Relative Risk Total Tested Negative for Heroin Tested Positive for Heroin Relative Risk Risk of Negative Heroin Test Tested Negative for Heroin Tested Positive for Heroin Risk of Negative Heroin Test Tested Negative for Heroin Tested Positive for Heroin Risk of Negative Heroin Test Tested Negative for Heroin Tested Positive for Heroin 1002179 90 or 21% 21 100 2179 90 or 21% 21 100 2179 90 or 21% 21 100 2179 90 or 21% 21 100 2179 90 or 21% 21 100 Bupe is not associated with having a negative test for heroin. 1 1006238 90 or 62% 62 100 Bupe is associated with having a positive test for heroin!.34 100694 90 or 6% 6 100 Bupe is associated with having a negative test for heroin. 3.5 Making Group Comparisons and Identifying Associations Teach Epidemiology

88
88 Risk of Negative Heroin Test Nothing Bupe Total Trial 1 Trial 2 Trial 3 Trial 4 Bupe No Bupe Bupe No Bupe Bupe Total Relative Risk No Bupe Total Relative Risk Total Tested Negative for Heroin Tested Positive for Heroin Relative Risk Risk of Negative Heroin Test Tested Negative for Heroin Tested Positive for Heroin Risk of Negative Heroin Test Tested Negative for Heroin Tested Positive for Heroin Risk of Negative Heroin Test Tested Negative for Heroin Tested Positive for Heroin 1002179 90 or 21% 21 100 2179 90 or 21% 21 100 2179 90 or 21% 21 100 2179 90 or 21% 21 100 2179 90 or 21% 21 100 Bupe is not associated with having a negative test for heroin. 1 1006238 90 or 62% 62 100 Bupe is associated with having a positive test for heroin!.34 100694 90 or 6% 6 100 Bupe is associated with having a negative test for heroin. 3.5 Nothing Compared to what? Making Group Comparisons and Identifying Associations Teach Epidemiology

89
89 Buprenorphine Buprenorphine & Naloxone Placebo Making Group Comparisons and Identifying Associations Teach Epidemiology Handout

90
90 National Research Council, Learning and Understanding Teach Epidemiology Enduring Epidemiological Understandings Knowledge that “… is connected and organized, and … ‘conditionalized’ to specify the context in which it is applicable.”

91
91

92
92 Suicide Higher in Areas with Guns Smoking Linked to Youth Eating Disorders Snacks Key to Kids’ TV- Linked Obesity: China Study Family Meals Are Good for Mental Health Lack of High School Diploma Tied to US Death Rate Study Links Spanking to Aggression Breakfast Each Day May Keep Colds Away Study Concludes: Movies Influence Youth Smoking Study Links Iron Deficiency to Math Scores Kids Who Watch R-Rated Movies More Likely to Drink, Smoke Pollution Linked with Birth Defects in US Study Depressed Teens More Likely to Smoke In the News

93
93 Total ab dc 2 x 2 Table Suicide Higher in Areas with Guns

94
94 Total ab dc People who are exposed ab 2 x 2 Table Suicide Higher in Areas with Guns Areas with Guns No Suicide Suicide Areas without Guns

95
95 ab dc 2 x 2 Table Total Kids Who Watch R-Rated Movies More Likely to Drink, Smoke

96
96 ab dc 2 x 2 Table R-Rated Movies Total Drink & Smoke Kids Who Watch R-Rated Movies More Likely to Drink, Smoke No Drink & Smoke No R-Rated Movies

97
97 ab dc People who are exposed and have the outcome a 2 x 2 Table R-Rated Movies Total Drink & Smoke Kids Who Watch R-Rated Movies More Likely to Drink, Smoke No Drink & Smoke No R-Rated Movies

98
98 ab dc 2 x 2 Table Family Meals Are Good for Mental Health Total

99
99 ab dc 2 x 2 Table Family Meals Are Good for Mental Health Family Meals Total Mental Health No Mental Health No Family Meals

100
100 ab dc People who are not exposed and do not have the outcome d 2 x 2 Table Family Meals Are Good for Mental Health Family Meals Total Mental Health No Mental Health No Family Meals

101
101 ab dc 2 x 2 Table Study Links Iron Deficiency to Math Scores Total

102
102 ab dc 2 x 2 Table Study Links Iron Deficiency to Math Scores Iron Deficiency Poor Math Scores No Iron Deficiency Good Math Scores Total

103
103 ab dc People who do not have the outcome and are not exposed d 2 x 2 Table Study Links Iron Deficiency to Math Scores Iron Deficiency Poor Math Scores No Iron Deficiency Good Math Scores Total

104
104 ab dc 2 x 2 Table Pollution Linked with Birth Defects in US Study Total

105
105 ab dc 2 x 2 Table Pollution Linked with Birth Defects in US Study Pollution Birth Defects No Pollution No Birth Defects Total

106
106 ab dc People who are not exposed dc 2 x 2 Table Pollution Linked with Birth Defects in US Study Pollution Birth Defects No Pollution No Birth Defects Total

107
107 ab dc 2 x 2 Table Depressed Teens More Likely to Smoke Total

108
108 ab dc People who do not have the outcome d b 2 x 2 Table Depressed Teens More Likely to Smoke Depression Smoke No Depression No Smoke Total

109
109 ab dc 2 x 2 Table Smoking Linked to Youth Eating Disorders Total

110
110 ab dc 2 x 2 Table Smoking Linked to Youth Eating Disorders Smoke Eating Disorders No Smoke No Eating Disorders Total

111
111 ab dc People who are exposed and do not have the outcome b 2 x 2 Table Smoking Linked to Youth Eating Disorders Smoke Eating Disorders No Smoke No Eating Disorders Total

112
112 ab dc 2 x 2 Table Total Study Links Spanking to Aggression

113
113 ab dc People who have the outcome a c 2 x 2 Table Study Links Spanking to Aggression Spanking Aggression No Spanking Total No Aggression

114
114 ab dc 2 x 2 Table Total Snacks Key to Kids’ TV-Linked Obesity – China Study

115
115 ab dc 2 x 2 Table Snacks Key to Kids’ TV-Linked Obesity – China Study Snacks Obesity No Snacks No Obesity Total People who are not exposed and have the outcome c

116
116

117
117 National Research Council, Learning and Understanding Teach Epidemiology Enduring Epidemiological Understandings Knowledge that “… is connected and organized, and … ‘conditionalized’ to specify the context in which it is applicable.”

118
118 Laboratory Teach Epidemiology Making Group Comparisons and Identifying Associations

119
119 Laboratory Teach Epidemiology Making Group Comparisons and Identifying Associations

120
120 Naturally occurring circumstances in which groups of people within a population have been exposed to different levels of the hypothesized cause of an outcome. Natural Experiment Teach Epidemiology Making Group Comparisons and Identifying Associations

121
121 An epidemiologic study of a natural experiment in which the investigator is not involved in the intervention other than to record, classify, count, and statistically analyze results. Observational Study Teach Epidemiology Making Group Comparisons and Identifying Associations

122
122 An epidemiologic experiment in which subjects are assigned into groups to receive or not receive a hypothesized beneficial intervention. Controlled Trial Teach Epidemiology Making Group Comparisons and Identifying Associations

123
123 Buprenorphine Buprenorphine will stop heroin addicts from using heroin. Teach Epidemiology Making Group Comparisons and Identifying Associations

124
124 Naturally occurring circumstances in which groups of people within a population have been exposed to different levels of the hypothesized cause of an outcome. Observational Study of a Natural Experiment Epidemiologic studies of natural experiments in which the investigator is not involved in the intervention other than to record, classify, count, and statistically analyze results. Teach Epidemiology Making Group Comparisons and Identifying Associations

125
125 Making Group Comparisons and Identifying Associations Teach Epidemiology

126
126 Making Group Comparisons and Identifying Associations Teach Epidemiology

127
127 Stephen Jay Gould (survivor of abdominal mesothelioma) Absolutely nothing in the available arsenal of anti-emetics worked at all. I was miserable and came to dread the frequent treatments with an almost perverse intensity. I had heard that marijuana often worked well against nausea. I was reluctant to try it because I had never smoked any substance habitually (and didn’t even know how to inhale). Moreover, I had tried marijuana twice (in the 1960s) … and had hated it …. Marijuana worked like a charm …. The sheer bliss of not experiencing nausea - and not having to fear it for all the days intervening between treatments - was the greatest boost I received in all my year of treatment, and surely the most important effect upon my eventual cure. Making Group Comparisons and Identifying Associations Teach Epidemiology
. Moreover, I had tried marijuana twice (in the 1960s) … and had hated it …. Marijuana worked like a charm …. The sheer bliss of not experiencing nausea - and not having to fear it for all the days intervening between treatments - was the greatest boost I received in all my year of treatment, and surely the most important effect upon my eventual cure. Making Group Comparisons and Identifying Associations Teach Epidemiology.")
128
128 A particular or detached incident or fact of an interesting nature; a biographical incident or fragment; a single passage of private life. Anecdote Making Group Comparisons and Identifying Associations Teach Epidemiology

129
129 Science Transforming Anecdote to Science Making Group Comparisons and Identifying Associations Teach Epidemiology Anecdote

130
130 Time ++++++++++++++++++++++++++++++++++++++++++++++++++++++++++ Healthy People - E Random Assignment E DZ Controlled Trial Time ++++++++++++++++++++++++++++++++++++++++++++++++++++++++++ Healthy People - E E DZ Cohort Study Time ++++++++++++++++++++++++++++++++++++++++++++++++++++++++++ Case-Control Study - DZ E E E E Time ++++++++++++++++++++++++++++++++++++++++++++++++++++++++++ Cross-Sectional Study - E E DZ Making Group Comparisons and Identifying Associations Teach Epidemiology

131
131 Time ++++++++++++++++++++++++++++++++++++++++++++++++++++++++++ Healthy People - E Random Assignment E DZ Controlled Trial Time ++++++++++++++++++++++++++++++++++++++++++++++++++++++++++ Healthy People - E E DZ Cohort Study Time ++++++++++++++++++++++++++++++++++++++++++++++++++++++++++ Case-Control Study - DZ E E E E Time ++++++++++++++++++++++++++++++++++++++++++++++++++++++++++ Cross-Sectional Study - E E DZ d b c a Making Group Comparisons and Identifying Associations Teach Epidemiology

132
The goal of every epidemiological study is to harvest valid and precise information about the relationship between an exposure and a disease in a population. The various study designs merely represent different ways of harvesting this information. Essentials in Epidemiology in Public Health Ann Aschengrau and George R. Seage III Making Group Comparisons and Identifying Associations Teach Epidemiology

133
133

134
134 Ms. Wilson After-School, Make-Up Homework Hall

135
135 Talking too much on a cell phone causes students not to do their homework. a c b d Label the 2x2 Table

136
136 a c b d Did Not Have Cell Phone Did Not Do Homework Did Homework Had Cell Phone Total Talking too much on a cell phone causes students not to do their homework.

137
137 a c b d Did Not Have Cell Phone Did Not Do Homework Did Homework Had Cell Phone Total Talking too much on a cell phone causes students not to do their homework. Place the data into the 2x2 Table

138
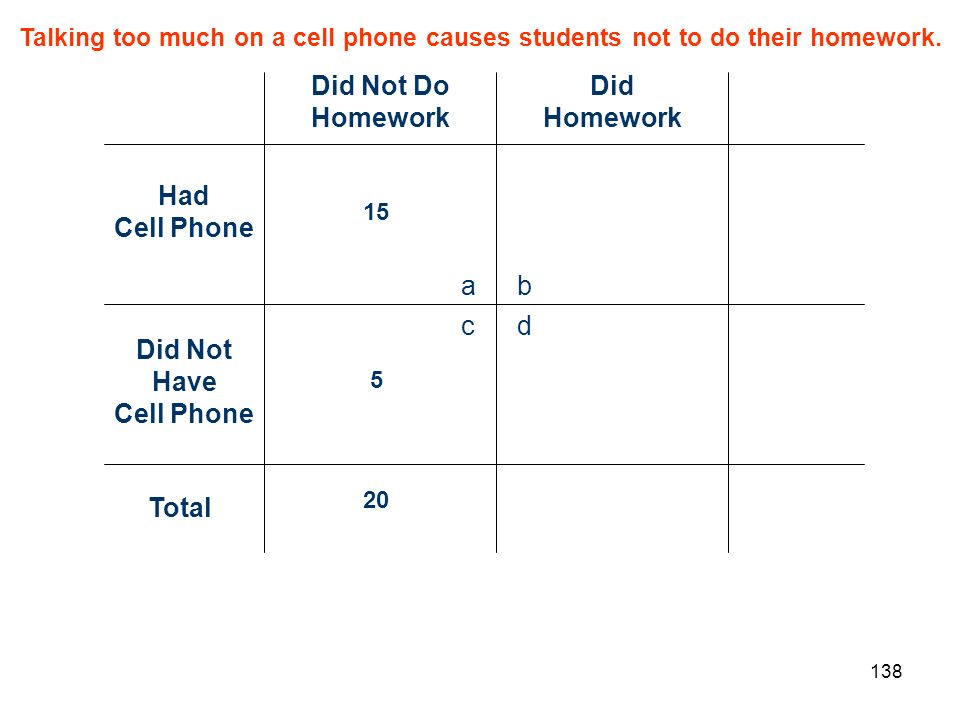
138 a c b d Did Not Have Cell Phone Did Not Do Homework Did Homework Had Cell Phone Total Talking too much on a cell phone causes students not to do their homework. 15 5 20
139
139 a c b d Did Not Have Cell Phone Did Not Do Homework Did Homework Had Cell Phone Total Talking too much on a cell phone causes students not to do their homework. 15 5 20 Which of the following statements can be made based on the above data: A: 15 of 20 students, who did not do their homework, had cell phones. B: 15 of 20 students, who had cell phones, did not do their homework.

140
140 Breast Implants No Breast Implants No Connective Tissue Disease 31,1801,183 51385,80586,318 Cohort Study – The Nurses’ Health Study (1976) Which of the following statements can be made based on the above data: A: 15 of 20 students, who did not do their homework, had cell phones. B: 15 of 20 students, who had cell phones, did not do their homework. Total Connective Tissue Disease Risk

141
141 a c b d Did Not Have Cell Phone Did Not Do Homework Did Homework Had Cell Phone Total Talking too much on a cell phone causes students not to do their homework. 15 5 20 Which of the following statements can be made based on the above data: A: 15 of 20 students, who did not do their homework, had cell phones. B: 15 of 20 students, who had cell phones, did not do their homework. RiskX Odds

142
142 Odds A ratio of the probability of occurrence of an event to that of its nonoccurrence. Talking too much on a cell phone causes students not to do their homework.

143
143 a c b d Did Not Have Cell Phone Did Not Do Homework Did Homework Had Cell Phone Total 15 5 Which of the following statements can be made based on the above data: A: 15 of 20 students, who did not do their homework, had cell phones. B: 15 of 20 students, who had cell phones, did not do their homework. A ratio of the probability of occurrence of an event to that of its nonoccurrence. 15 to 5 or 3 to 1 Odds Talking too much on a cell phone causes students not to do their homework. 20

144
144 a c b d Did Not Have Cell Phone Did Not Do Homework Did Homework Had Cell Phone Total 15 5 Which of the following statements can be made based on the above data: A: 15 of 20 students, who did not do their homework, had cell phones. B: 15 of 20 students, who had cell phones, did not do their homework. Talking too much on a cell phone causes students not to do their homework. 20 Nothing A ratio of the probability of occurrence of an event to that of its nonoccurrence. 15 to 5 or 3 to 1 Odds Compared to what?

145
145 CompareDivideCount Talking too much on a cell phone causes students not to do their homework.

146
146 a c b d Did Not Have Cell Phone Did Not Do Homework Did Homework Had Cell Phone Total 15 5 Which of the following statements can be made based on the above data: A: 15 of 20 students, who did not do their homework, had cell phones. B: 15 of 20 students, who had cell phones, did not do their homework. Talking too much on a cell phone causes students not to do their homework. 20 Nothing A ratio of the probability of occurrence of an event to that of its nonoccurrence. 15 to 5 or 3 to 1 Odds Compared to what? What did Ms. Wilson do?

147
147 Talking too much on a cell phone causes students not to do their homework. What did Ms. Wilson do?

148
148 a c b d Did Not Have Cell Phone Did Not Do Homework Did Homework Had Cell Phone Total Talking too much on a cell phone causes students not to do their homework. 15 5 20 10 30 40 3 to 1 10 to 30 or 1 to 3 Place the data into the 2x2 Table

149
149 What mathematical computation would allow them to complete the statement: The odds of having a cell phone were ____ times greater among students who had not done their homework compared to students who did do their homework. a c b d Did Not Have Cell Phone Did Not Do Homework Did Homework Had Cell Phone Total Talking too much on a cell phone causes students not to do their homework. 15 5 20 10 30 40 3 to 1 10 to 30 or 1 to 3

150
What mathematical computation would allow them to complete the statement: The odds of having a cell phone were ____ times greater among students who had not done their homework compared to students who did do their homework. 150 a c b d Did Not Have Cell Phone Did Not Do Homework Did Homework Had Cell Phone Total Talking too much on a cell phone causes students not to do their homework. 15 5 20 10 30 40 3 to 1 3 / 1 = 3 1 / 3 =.33 3 /.33 = 9 9 10 to 30 or 1 to 3

151
151 Odds Ratio Ratio of odds in favor of exposure among cases to the odds in favor of exposure among controls. Talking too much on a cell phone causes students not to do their homework. Relative Odds

152
152 a c b d Did Not Have Cell Phone Did Not Do Homework Did Homework Had Cell Phone Total Talking too much on a cell phone causes students not to do their homework. 15 5 20 35 5 40 Odds Ratio What mathematical computation would allow them to complete the statement: The odds of having a cell phone were ____ times greater among students who had not done their homework compared to students who did do their homework..43

153
153 a c b d Did Not Have Cell Phone Did Not Do Homework Did Homework Had Cell Phone Total Talking too much on a cell phone causes students not to do their homework. 15 5 20 30 10 40 Odds Ratio What mathematical computation would allow them to complete the statement: The odds of having a cell phone were ____ times greater among students who had not done their homework compared to students who did do their homework. 1

154
154

155
155 Arthur Herbst, et al. “Adenocarcinoma of the Vagina,” New England Journal of Medicine, 284:16, 1971, 878-881 Case-Control Study

156
156 Case-Control Study

157
157 Case-Control Study

158
158 Case-Control Study

159
159 Case-Control Study

160
160 Case-Control Study

161
161 Case-Control Study

162
162 DZ X _ X _ 8 1 7 Case-Control Study

163
163 DZ X _ X _ 8 5 3 Case-Control Study

164
164 DZ X _ X _ 8 2 6 Case-Control Study

165
165 DZ X _ X _ 8 1 7 Case-Control Study

166
166 DZ X _ X _ 8 5 3 Case-Control Study

167
167 DZ X _ X _ 8 7 1 Case-Control Study

168
168 Case-Control Study

169
169 DZ X _ X _ 832 1 721 11 Case-Control Study

170
170 DZ X _ X _ 832 5 31 31 Case-Control Study

171
171 DZ X _ X _ 832 2 65 27 Case-Control Study

172
172 DZ X _ X _ 832 1 70 Case-Control Study

173
173 DZ X _ X _ 832 5 33 29 Case-Control Study

174
174 DZ X _ X _ 832 7 14 28 Case-Control Study

175
175 Case-Control Study

177
177

178
Authentic Assessment Teach Epidemiology Epi – Grades 6-12 Are realistic; simulate the way a person’s understanding is tested in the real world Require judgment and innovation to address an unstructured problem, rather than following a set routine Ask students to “do” the subject rather than simply recall what was taught Replicate the context in which a person would be tested at work, in the community, or at home Are messy and murky Require a repertoire of knowledge and skill to be used efficiently and effectively Allow opportunities for rehearsal, practice, consultation, feedback, and refinement

179
179 Epi Challenge http://www.teachepidemiology.org/viewSO1.php

180
180 Epi Challenge http://www.teachepidemiology.org/viewSO2.php

181
Think Like an Epidemiologist Challenge New Jersey Science Olympiad, March 15, 2011 Thank you for competing in the 3 rd Think Like an Epidemiologist Challenge. You worked with others, developed epidemiologic knowledge and skills, and used judgment and innovation to actually "do" epidemiology under pressure. We hope you enjoyed the challenge. Name School Teach Epidemiology Robert Wood Johnson Foundation Detectives in the Classroom Special thanks to the Epidemiology Section of the American Public Health Association for allowing us to distribute their Section pins to the student participants in the 2011 Think Like an Epidemiologist Challenge.

202
202 Time Check 10:45 AM

203
203

204
204 Revised Teach Epidemiology

205
205 Time Check 11:00 AM

206
206

207
The Journey Detectives in the Classroom - Investigation 2-6: The Journey

208
The Journey from Exposure to Disease Detectives in the Classroom - Investigation 2-6: The Journey

209
Analogy Detectives in the Classroom - Investigation 2-6: The Journey

210
Epi Talk Study Design Epi Talk Detectives in the Classroom - Investigation 2-6: The Journey Procedures and methods, established beforehand, that are followed by the investigator conducting the study.

211
Timing When are the passengers identified as exposed or unexposed? E When are the passengers identified as sick or not sick? DZ Timing When does the epidemiologist start to observe the journey? - Detectives in the Classroom - Investigation 2-6: The Journey

212
Time +++++++++++++++++++++++++++++++++++++++++++++++++++++++++++++++++ E DZ Label the Train Tracks - Detectives in the Classroom - Investigation 2-6: The Journey

213
Time +++++++++++++++++++++++++++++++++++++++++++++++++++++++++++++++++ Study Design: E DZ Label the Train Tracks - Detectives in the Classroom - Investigation 2-6: The Journey Controlled Trial

214
Time ++++++++++++++++++++++++++++++++++++++++++++++++++++++++++ Healthy People Controlled Trial Flow Diagram Detectives in the Classroom - Investigation 2-6: The Journey - Healthy People E Random Assignment E DZ

215
Time +++++++++++++++++++++++++++++++++++++++++++++++++++++++++++++++++ Study Design: Label the Train Tracks Detectives in the Classroom - Investigation 2-6: The Journey Cohort Study

216
Just as in the controlled trial, the epidemiologist is also on the train during the entire journey. But there is an important difference. The epidemiologist is not telling passengers what to do. Rather, the epidemiologist is just observing them and counting. Passengers are not being told to have or not have an exposure, they are just living their normal lives. The epidemiologist, on the ride for the whole journey, just keeps observing everyone’s exposures and whether or not they develop the disease during the journey. Label the Train Tracks Detectives in the Classroom - Investigation 2-6: The Journey

217
Time +++++++++++++++++++++++++++++++++++++++++++++++++++++++++++++++++ E DZ Label the Train Tracks - Detectives in the Classroom - Investigation 2-6: The Journey Study Design: Cohort Study

218
Time ++++++++++++++++++++++++++++++++++++++++++++++++++++++++++ Healthy People Cohort Study Flow Diagram Detectives in the Classroom - Investigation 2-6: The Journey - Healthy People E E DZ

219
Time ++++++++++++++++++++++++++++++++++++++++++++++++++++++++++ Healthy People Cohort Study Flow Diagram Detectives in the Classroom - Investigation 2-6: The Journey - Healthy People E E DZ Controlled Trial

220
Time ++++++++++++++++++++++++++++++++++++++++++++++++++++++++++ Healthy People Cohort Study Flow Diagram Detectives in the Classroom - Investigation 2-6: The Journey - Healthy People E E DZ Controlled Trial Random Assignment

221
Review Observational Studies Epi Talk Detectives in the Classroom - Investigation 2-6: The Journey Epidemiologic studies of natural experiments in which the investigator is not involved in the intervention other than to record, classify, count, and statistically analyze results.

222
Time +++++++++++++++++++++++++++++++++++++++++++++++++++++++++++++++++ Label the Train Tracks Detectives in the Classroom - Investigation 2-6: The Journey Study Design: Case-Control Study

223
The epidemiologist is not on the journey. Rather, the epidemiologist is waiting at the train station at the end of the journey. As passengers get off the train, the epidemiologist selects sick passengers for the case group and selects passengers who are similar but not sick for the control group. The epidemiologist then asks each person in the case group and control group questions about their exposures during the train ride. The epidemiologist relies on passengers’ memories of their exposures that occurred during the train ride. Label the Train Tracks Case-Control Study Detectives in the Classroom - Investigation 2-6: The Journey

224
Time +++++++++++++++++++++++++++++++++++++++++++++++++++++++++++++++++ E DZ Label the Train Tracks - Detectives in the Classroom - Investigation 2-6: The Journey Study Design: Case-Control Study

225
Observational Study Flow Diagram Flow Diagram Time ++++++++++++++++++++++++++++++++++++++++++++++++++++++++++ DZ - E E E E Detectives in the Classroom - Investigation 2-6: The Journey

226
Time +++++++++++++++++++++++++++++++++++++++++++++++++++++++++++++++++ Label the Train Tracks Detectives in the Classroom - Investigation 2-6: The Journey Study Design: Cross-Sectional Study

227
The epidemiologist, who has not been on the journey, stops the train somewhere during the trip (kind of like a train robbery) and takes a “snapshot” of all the passengers by asking them whether or not they have the exposure and whether or not they have the disease. Then the epidemiologist leaves the train and goes home to analyze the data from that particular day. The journey continues without the epidemiologist. Label the Train Tracks Cross-Sectional Study Detectives in the Classroom - Investigation 2-6: The Journey

228
E DZ Time +++++++++++++++++++++++++++++++++++++++++++++++++++++++++++++++++ Label the Train Tracks - Detectives in the Classroom - Investigation 2-6: The Journey Study Design: Cross-Sectional Study

229
Observational Study Flow Diagram Flow Diagram Time ++++++++++++++++++++++++++++++++++++++++++++++++++++++++++ E E - DZ Detectives in the Classroom - Investigation 2-6: The Journey

230
Epi Talk Controlled Trial Epi Talk Detectives in the Classroom - Investigation 2-6: The Journey An epidemiologic experiment in which subjects are assigned into groups to receive or not receive a hypothesized beneficial intervention.

231
Epi Talk Cohort Study Epi Talk Detectives in the Classroom - Investigation 2-6: The Journey An analytical epidemiological study design in which the investigator selects a group of exposed individuals and a group of unexposed individuals and follows both groups to compare the frequency with which the disease occurs in each group.

232
Epi Talk Case-Control Study Epi Talk Detectives in the Classroom - Investigation 2-6: The Journey An analytical epidemiological study design in which the investigator selects a group of individuals with a disease (cases) and a group of similar individuals without the disease (controls) and compares the frequency with which an exposure occurred in the cases versus the controls.
 and a group of similar individuals without the disease (controls) and compares the frequency with which an exposure occurred in the cases versus the controls.")
233
Epi Talk Cross-Sectional Study Epi Talk Detectives in the Classroom - Investigation 2-6: The Journey An analytical epidemiological study design in which the investigator selects a group of individuals and determines the presence or absence of a disease and the presence or absence of an exposure at the same time.

234
234

235
Epi Teams Detectives in the Classroom - Investigation 2-6: The Journey

236
What’s My Design? Detectives in the Classroom - Investigation 2-6: The Journey Time ++++++++++++++++++++++++++++++++++++++++++++++++++++++++++ Healthy People - E Random Assignment E DZ Controlled Trial Time ++++++++++++++++++++++++++++++++++++++++++++++++++++++++++ Healthy People - E E DZ Cohort Study Epi Team Challenge Time ++++++++++++++++++++++++++++++++++++++++++++++++++++++++++ - DZ E E E E Case-Control Study Time ++++++++++++++++++++++++++++++++++++++++++++++++++++++++++ - E E DZ Cross-Sectional Study DZ

237
Controlled Trial Epidemiologist is involved during the entire time from exposure and disease. Assign treatment and control groups. Follow through time and compare risk of disease in treatment group with risk of disease in control group. Give exposure to treatment group, but not control group. What’s My Design? Detectives in the Classroom - Investigation 2-6: The Journey

238
Observational Study Flow Diagram Flow Diagram - DZ E E E E Detectives in the Classroom - Investigation 2-6: The Journey Case-Control Study

239
Observational Study Detectives in the Classroom - Investigation 2-6: The Journey What’s My Design? Cohort, Case-Control, and Cross-Sectional Study

240
CDC Investigation 2-6 has ended. The Journey Detectives in the Classroom - Investigation 2-6: The Journey

241
241

242
Epi Team Challenge Detectives in the Classroom - Investigation 2-7: Epi Team Challenge

243
Time ++++++++++++++++++++++++++++++++++++++++++++++++++++++++++ Healthy People - E Random Assignment E DZ Controlled Trial Time ++++++++++++++++++++++++++++++++++++++++++++++++++++++++++ Healthy People - E E DZ Cohort Study Time ++++++++++++++++++++++++++++++++++++++++++++++++++++++++++ - DZ E E E E Case-Control Study Time ++++++++++++++++++++++++++++++++++++++++++++++++++++++++++ - E E DZ Cross-Sectional Study DZ What’s My Design? Detectives in the Classroom - Investigation 2-7: Epi Team Challenge

244
Epidemiologist is involved during the entire time from exposure to disease. Assign treatment and control groups. Follow through time and compare risk of disease in treatment group with risk of disease in control group. Give exposure to treatment group, but not control group. What’s My Design? Practice Clue Trial Detectives in the Classroom - Investigation 2-7: Epi Team Challenge

245
Assign treatment and control groups. What’s My Design? Clue 1 Begin Epi Team Challenge Trial Detectives in the Classroom - Investigation 2-7: Epi Team Challenge

246
Observational Study Flow Diagram DZ - E E E E Clue 2 Case-Control Study What’s My Design? Detectives in the Classroom - Investigation 2-7: Epi Team Challenge

247
Observational Study Flow Diagram Clue 3 What’s My Design? Cohort, Case-Control, and Cross-Sectional Studies Detectives in the Classroom - Investigation 2-7: Epi Team Challenge

248
Follow through time and compare risk of disease in exposed group with risk of disease in the unexposed group. Clue 4 Trial and Cohort Study What’s My Design? Detectives in the Classroom - Investigation 2-7: Epi Team Challenge

249
Follow through time and compare risk of disease in treatment group with risk of disease in control group. Give exposure to treatment group, but not control group. Clue 5 Trial What’s My Design? Detectives in the Classroom - Investigation 2-7: Epi Team Challenge

250
Epidemiologist is involved during the entire time from exposure to disease. Clue 6 Trial and Cohort Study What’s My Design? Detectives in the Classroom - Investigation 2-7: Epi Team Challenge

251
Select a group of people with disease and a similar group of people without disease. Clue 7 Case-Control Study What’s My Design? Detectives in the Classroom - Investigation 2-7: Epi Team Challenge

252
Healthy People Flow Diagram - Healthy People E E Random Assignment Non-Observational Study Clue 8 Trial What’s My Design? Detectives in the Classroom - Investigation 2-7: Epi Team Challenge

253
Observational Study Flow Diagram E E - DZ Clue 9 Cross Sectional Study What’s My Design? Detectives in the Classroom - Investigation 2-7: Epi Team Challenge

254
Compare percent of exposed people in the two groups. Clue 10 Case-Control Study What’s My Design? Detectives in the Classroom - Investigation 2-7: Epi Team Challenge

255
Healthy People Flow Diagram - Healthy People E E DZ Random Assignment Clue 11 Trial What’s My Design? Detectives in the Classroom - Investigation 2-7: Epi Team Challenge

256
Flow Diagram Clue 12 Cross Sectional Study What’s My Design? Detectives in the Classroom - Investigation 2-7: Epi Team Challenge

257
Flow Diagram DZ Observational Study Clue 13 Cohort Study What’s My Design? Detectives in the Classroom - Investigation 2-7: Epi Team Challenge

258
Ask each person about both exposure and disease at that point in time. What’s My Design? Clue 14 Cross Sectional Study Detectives in the Classroom - Investigation 2-7: Epi Team Challenge

259
Ask both groups about their exposures in the past. What’s My Design? Clue 15 Case-Control Study Detectives in the Classroom - Investigation 2-7: Epi Team Challenge

260
Healthy People Flow Diagram - Healthy People Random Assignment Clue 16 Trial What’s My Design? Detectives in the Classroom - Investigation 2-7: Epi Team Challenge

261
Disease risk in exposed group is compared to disease risk in unexposed group. Clue 17 Trial, Cohort Study, and Cross Sectional Study What’s My Design? Detectives in the Classroom - Investigation 2-7: Epi Team Challenge

262
Flow Diagram E E - DZ Clue 18 Cross Sectional Study What’s My Design? Detectives in the Classroom - Investigation 2-7: Epi Team Challenge

263
Select a healthy study sample. Clue 19 Trial (?) and Cohort Study What’s My Design? Detectives in the Classroom - Investigation 2-7: Epi Team Challenge

264
Observe who has and has not been exposed. Clue 20 Cohort and Cross-Sectional Studies What’s My Design? Detectives in the Classroom - Investigation 2-7: Epi Team Challenge

265
Clue 21 Give exposure to treatment group, but not control group. Trial What’s My Design? Detectives in the Classroom - Investigation 2-7: Epi Team Challenge

266
Healthy People Flow Diagram - Healthy People E E Observational Study Clue 22 Cohort Study What’s My Design? Detectives in the Classroom - Investigation 2-7: Epi Team Challenge

267
Epidemiologist is involved after disease has occurred and relies on subjects’ memories to gather information about exposure. Clue 23 Case-Control Study What’s My Design? Detectives in the Classroom - Investigation 2-7: Epi Team Challenge

268
Select a study sample. Clue 24 Trial, Cohort, Case-Control, and Cross Sectional Studies What’s My Design? Detectives in the Classroom - Investigation 2-7: Epi Team Challenge

269
Healthy People Flow Diagram - Healthy People E E DZ Observational Study Clue 25 Cohort Study What’s My Design? Detectives in the Classroom - Investigation 2-7: Epi Team Challenge

270
Epidemiologist gathers data only at that one point in time. Clue 26 Cross Sectional Study What’s My Design? Detectives in the Classroom - Investigation 2-7: Epi Team Challenge

271
Flow Diagram DZ Clue 27 Trial and Cohort Study What’s My Design? Detectives in the Classroom - Investigation 2-7: Epi Team Challenge

272
Follow through time and compare risk of disease in exposed group to risk of disease in unexposed group. Clue 28 Trial and Cohort Study What’s My Design? Detectives in the Classroom - Investigation 2-7: Epi Team Challenge

273
Epidemiologist is involved during the entire time from exposure to disease. Clue 29 Trial and Cohort Study What’s My Design? Detectives in the Classroom - Investigation 2-7: Epi Team Challenge

274
Flow Diagram E E DZ Clue 30 Cross Sectional Study What’s My Design? Detectives in the Classroom - Investigation 2-7: Epi Team Challenge

275
Flow Diagram DZ - Clue 31 Case-Control Study What’s My Design? Detectives in the Classroom - Investigation 2-7: Epi Team Challenge

276
Ask each person about both exposure and disease at that point in time. Epidemiologist gathers data only at that one point in time. Disease risk in exposed group is compared to disease risk in unexposed group. Select a study sample. Clue 32 Cross Sectional Study What’s My Design? Detectives in the Classroom - Investigation 2-7: Epi Team Challenge

277
Epidemiologist is involved after disease has occurred and relies on subjects’ memories to gather information about exposure. Select a group of people with disease and a similar group of people without disease. Compare percent of exposed people in the two groups. Ask both groups about their exposures in the past. Case-Control Study Clue 33 What’s My Design? Detectives in the Classroom - Investigation 2-7: Epi Team Challenge

278
Epidemiologist is involved during the entire time from exposure to disease. Select a healthy study sample. Follow through time and compare risk of disease in exposed group to risk of disease in unexposed group. Observe who has and has not been exposed. Cohort Study Clue 34 What’s My Design? Detectives in the Classroom - Investigation 2-7: Epi Team Challenge

279
Epidemiologist is involved during the entire time from exposure to disease. Assign treatment and control groups. Follow through time and compare risk of disease in treatment group with risk of disease in control group. Give exposure to treatment group, but not control group. Trial Clue 35 What’s My Design? Detectives in the Classroom - Investigation 2-7: Epi Team Challenge

280
End Epi Team Challenge What’s My Design? Detectives in the Classroom - Investigation 2-7: Epi Team Challenge

282
Detectives in the Classroom - Investigation 2-8: Which Design Is Best? Which Design Is Best?

283
Cross-Sectional Study Case-Control Study Cohort Study Trial Main WeaknessesMain StrengthsStudy Designs 1 5 6 2 3 7 8 4 Epi Team Challenge Detectives in the Classroom - Investigation 2-8: Which Design Is Best?

284
Cross-Sectional Study Case-Control Study Cohort Study Trial Main WeaknessesMain StrengthsStudy Designs 1 5 6 2 3 7 8 4 Cross- Sectional Cohort Case- Control Controlled Trial Epi Team Challenge Detectives in the Classroom - Investigation 2-8: Which Design Is Best?

285
Cross-Sectional Study Case-Control Study Cohort Study Trial Main WeaknessesMain StrengthsStudy Designs 1 5 6 2 3 7 8 4 Fastest Which study design is the fastest? Epi Team Challenge Detectives in the Classroom - Investigation 2-8: Which Design Is Best?

286
Cross-Sectional Study Case-Control Study Cohort Study Trial Main WeaknessesMain StrengthsStudy Designs 1 5 6 2 3 7 8 4 Fastest Time Consuming Which study designs are the most time consuming? Epi Team Challenge Detectives in the Classroom - Investigation 2-8: Which Design Is Best?

287
Cross-Sectional Study Case-Control Study Cohort Study Trial Main WeaknessesMain StrengthsStudy Designs 1 5 6 2 3 7 8 4 Fastest Time Consuming Most Scientifically Sound Which study design is the most scientifically sound? Time Consuming Epi Team Challenge Detectives in the Classroom - Investigation 2-8: Which Design Is Best?

288
Cross-Sectional Study Case-Control Study Cohort Study Trial Main WeaknessesMain StrengthsStudy Designs 1 5 6 2 3 7 8 4 Fastest Time Consuming Most Scientifically Sound Can Study Rare Diseases Which study design is best for studying rare diseases? Time Consuming Epi Team Challenge Detectives in the Classroom - Investigation 2-8: Which Design Is Best?

289
Cross-Sectional Study Case-Control Study Cohort Study Trial Main WeaknessesMain StrengthsStudy Designs 1 5 6 2 3 7 8 4 Fastest Time Consuming Most Scientifically Sound Possible Time-Order Confusion Can Study Rare Diseases Which study designs do not identify the time order of exposure and disease? Time Consuming Epi Team Challenge Detectives in the Classroom - Investigation 2-8: Which Design Is Best?

290
Cross-Sectional Study Case-Control Study Cohort Study Trial Main WeaknessesMain StrengthsStudy Designs 1 5 6 2 3 7 8 4 Fastest Time Consuming Least Confidence in Findings Most Scientifically Sound Possible Time-Order Confusion Can Study Rare Diseases Which study design gives the least confidence in findings? Time Consuming Epi Team Challenge Detectives in the Classroom - Investigation 2-8: Which Design Is Best?

291
Cross-Sectional Study Case-Control Study Cohort Study Trial Main WeaknessesMain StrengthsStudy Designs 1 5 6 2 3 7 8 4 Fastest Time Consuming Least Confidence in Findings Most Scientifically Sound Best Measure of Exposure Possible Time-Order Confusion Can Study Rare Diseases Which study design provides the best measure of exposure? Time Consuming Epi Team Challenge Detectives in the Classroom - Investigation 2-8: Which Design Is Best?

292
Cross-Sectional Study Case-Control Study Cohort Study Trial Main WeaknessesMain StrengthsStudy Designs 1 5 6 2 3 7 8 4 Fastest Time Consuming Least Confidence in Findings Most Scientifically Sound Best Measure of Exposure Possible Time-Order Confusion Can Study Rare Diseases Most Accurate Observational Study Which study design is the most accurate observational study? Time Consuming Epi Team Challenge Detectives in the Classroom - Investigation 2-8: Which Design Is Best?

293
Cross-Sectional Study Case-Control Study Cohort Study Trial Main WeaknessesMain StrengthsStudy Designs 1 5 6 2 3 7 8 4 Fastest Time Consuming Least Confidence in Findings Most Scientifically Sound Best Measure of Exposure Possible Time-Order Confusion Can Study Rare Diseases Least Expensive Most Accurate Observational Study Which study design is the least expensive? Time Consuming Epi Team Challenge Detectives in the Classroom - Investigation 2-8: Which Design Is Best?

294
Cross-Sectional Study Case-Control Study Cohort Study Trial Main WeaknessesMain StrengthsStudy Designs 1 5 6 2 3 7 8 4 Fastest Time Consuming Least Confidence in Findings Most Scientifically Sound Best Measure of Exposure Possible Time-Order Confusion Can Study Rare Diseases Least Expensive Unethical for Harmful Exposures Most Accurate Observational Study Which study design would be unethical for harmful exposures? Time Consuming Epi Team Challenge Detectives in the Classroom - Investigation 2-8: Which Design Is Best?

295
Cross-Sectional Study Case-Control Study Cohort Study Trial Main WeaknessesMain StrengthsStudy Designs 1 5 6 2 3 7 8 4 Fastest Time Consuming Least Confidence in Findings Most Scientifically Sound Best Measure of Exposure Possible Time-Order Confusion Can Study Rare Diseases Least Expensive Good Measure of Exposure Which study design provides a good measure of exposure? Most Accurate Observational Study Time Consuming Unethical for Harmful exposures Epi Team Challenge Detectives in the Classroom - Investigation 2-8: Which Design Is Best?

296
Cross-Sectional Study Case-Control Study Cohort Study Trial Main WeaknessesMain StrengthsStudy Designs 1 5 6 2 3 7 8 4 Fastest Time Consuming Least Confidence in Findings Most Scientifically Sound Best Measure of Exposure Possible Time-Order Confusion Can Study Rare Diseases Least Expensive Most Expensive Most Accurate Observational Study Which study designs are the most expensive? Good Measure of Exposure Time Consuming Unethical for Harmful exposures Epi Team Challenge Detectives in the Classroom - Investigation 2-8: Which Design Is Best?

297
Cross-Sectional Study Case-Control Study Cohort Study Trial Main WeaknessesMain StrengthsStudy Designs 1 5 6 2 3 7 8 4 Fastest Time Consuming Least Confidence in Findings Most Scientifically Sound Best Measure of Exposure Possible Time-Order Confusion Can Study Rare Diseases Least Expensive Relatively Less Expensive and Relatively Fast Most Accurate Observational Study Which study design is relatively less expensive and relatively fast? Time Consuming Unethical for Harmful exposures Most Expensive Good Measure of Exposure Epi Team Challenge Detectives in the Classroom - Investigation 2-8: Which Design Is Best?

298
Cross-Sectional Study Case-Control Study Cohort Study Trial Main WeaknessesMain StrengthsStudy Designs 1 5 6 2 3 7 8 4 Fastest Time Consuming Least Confidence in Findings Most Scientifically Sound Best Measure of Exposure Possible Time-Order Confusion Can Study Rare Diseases Least Expensive Relatively Less Expensive and Relatively Fast Possible Error in Recalling Past Exposures Most Accurate Observational Study Which study design creates the possibility of error in recalling past exposures? Time Consuming Unethical for Harmful exposures Most Expensive Good Measure of Exposure Epi Team Challenge Detectives in the Classroom - Investigation 2-8: Which Design Is Best?

299
Cross-Sectional Study Case-Control Study Cohort Study Trial Main WeaknessesMain StrengthsStudy Designs 1 5 6 2 3 7 8 4 Fastest Time Consuming Most Scientifically Sound Best Measure of Exposure Can Study Rare Diseases Least Expensive Relatively Less Expensive and Relatively Fast Possible Error in Recalling Exposures Most Accurate Observational Study Which Design Is Best? Time Consuming Unethical for Harmful exposures Most Expensive Possible Time-Order Confusion Least Confidence in Findings Good Measure of Exposure It depends …. Detectives in the Classroom - Investigation 2-8: Which Design Is Best?

300
It depends on …. Regulations Time urgency How much is known about the association Money Whether the exposure is believed to be beneficial Detectives in the Classroom - Investigation 2-8: Which Design Is Best?

302
DZ E E d b c a Flow Diagram 2x2 Table Detectives in the Classroom – Investigation 2-9: Designs, Diagrams, and Tables & “fit” Designs, Diagrams, and Tables Healthy People - E E DZ

303
E E a 2x2 Table Where do these people “fit” in the 2x2 table? Flow Diagram Controlled Trial Healthy People E E DZ Random Assignment Detectives in the Classroom – Investigation 2-9: Designs, Diagrams, and Tables

304
DZ E E b Flow Diagram 2x2 Table Healthy People E E DZ Random Assignment Where do these people “fit” in the 2x2 table? Controlled Trial Detectives in the Classroom – Investigation 2-9: Designs, Diagrams, and Tables

305
DZ E E c Flow Diagram 2x2 Table Flow Diagram Healthy People E E DZ Random Assignment Where do these people “fit” in the 2x2 table? Controlled Trial Detectives in the Classroom – Investigation 2-9: Designs, Diagrams, and Tables

306
DZ E E d 2x2 Table Flow Diagram Healthy People E E DZ Random Assignment Where do these people “fit” in the 2x2 table? Controlled Trial Detectives in the Classroom – Investigation 2-9: Designs, Diagrams, and Tables

307
DZ E E c Flow Diagram 2x2 Table Where are these people in the flow diagram? Cohort Study Healthy People E E DZ Detectives in the Classroom – Investigation 2-9: Designs, Diagrams, and Tables

308
DZ E E a 2x2 Table Where are these people in the flow diagram? Flow Diagram Cohort Study Healthy People E E DZ Healthy People Detectives in the Classroom – Investigation 2-9: Designs, Diagrams, and Tables

309
DZ E E d Flow Diagram 2x2 Table Where are these people in the flow diagram? Cohort Study Healthy People E E DZ Healthy People Detectives in the Classroom – Investigation 2-9: Designs, Diagrams, and Tables

310
DZ E E b Flow Diagram 2x2 Table Where are these people in the flow diagram? Cohort Study Healthy People E E DZ Healthy People Detectives in the Classroom – Investigation 2-9: Designs, Diagrams, and Tables

311
DZ E E a Where do these people go in the 2x2 table? 2x2 Table Flow Diagram Case-Control Study DZ E E E E Detectives in the Classroom – Investigation 2-9: Designs, Diagrams, and Tables

312
DZ E E c Where do these people go in the 2x2 table? Flow Diagram 2x2 Table Case-Control Study DZ E E E E Detectives in the Classroom – Investigation 2-9: Designs, Diagrams, and Tables

313
Flow Diagram DZ E E b 2x2 Table Where do these people go in the 2x2 table? Case-Control Study DZ E E E E Detectives in the Classroom – Investigation 2-9: Designs, Diagrams, and Tables

314
Flow Diagram DZ E E d 2x2 Table Where do these people go in the 2x2 table? Case-Control Study DZ E E E E Detectives in the Classroom – Investigation 2-9: Designs, Diagrams, and Tables

315
DZ E E a Flow Diagram 2x2 Table Where do these people go in the 2x2 table? Cross-Sectional Study E E DZ Detectives in the Classroom – Investigation 2-9: Designs, Diagrams, and Tables

316
DZ E E c Flow Diagram 2x2 Table Where do these people go in the 2x2 table? Cross-Sectional Study E E DZ Detectives in the Classroom – Investigation 2-9: Designs, Diagrams, and Tables

317
DZ E E d Flow Diagram 2x2 Table Where do these people go in the 2x2 table? Cross-Sectional Study E E DZ Detectives in the Classroom – Investigation 2-9: Designs, Diagrams, and Tables

318
DZ E E b Flow Diagram 2x2 Table Where do these people go in the 2x2 table? Cross-Sectional Study E E DZ Detectives in the Classroom – Investigation 2-9: Designs, Diagrams, and Tables

319
319 National Research Council, Learning and Understanding Teach Epidemiology Enduring Epidemiological Understandings Knowledge that “… is connected and organized, and … ‘conditionalized’ to specify the context in which it is applicable.”

320
The goal of every epidemiological study is to harvest valid and precise information about the relationship between an exposure and a disease in a population. The various study designs merely represent different ways of harvesting this information. Essentials in Epidemiology in Public Health Ann Aschengrau and George R. Seage III Making Group Comparisons and Identifying Associations Teach Epidemiology

321
321

322
322 Revised Teach Epidemiology

323
Teach Epidemiology Workshop—Day 3 Diane Marie M St. George, PhD University of MD School of Medicine Dept of Epidemiology and Public Health

324
EU7: One possible explanation for finding an association is that the exposure causes the outcome. Because studies are complicated by factors not controlled by the observer, other explanations also must be considered, including confounding, chance, and bias. EU7: One possible explanation for finding an association is that the exposure causes the outcome. Because studies are complicated by factors not controlled by the observer, other explanations also must be considered, including confounding, chance, and bias.

325
EU8: Judgments about whether an exposure causes a disease are developed by examining a body of epidemiologic evidence, as well as evidence from other scientific disciplines.

326
EU9: While a given exposure may be necessary to cause an outcome, the presence of a single factor is seldom sufficient. Most outcomes are caused by a combination of exposures that may include genetic make-up, behaviors, social, economic, and cultural factors and the environment. EU9: While a given exposure may be necessary to cause an outcome, the presence of a single factor is seldom sufficient. Most outcomes are caused by a combination of exposures that may include genetic make-up, behaviors, social, economic, and cultural factors and the environment.

327
Reasons for associations Confounding Bias Reverse causality Sampling error (chance) Causation
 Causation")
328
Confounding in our lives MAP tests measure academic growth over time, independent of grade level or age. Age- and gender-specific growth charts Age-adjusted rates of… Rates of lung cancer adjusted for smoking Computer exposure may cause illness (absence), but it actually may just be the football game
, but it actually may just be the football game.")
329
Osteoporosis risk is higher among women who live alone than among women who live with others.

330
Confounding Confounding is an alternate explanation for an observed association of interest. Number of persons in the home Osteoporosis Age

331
Confounding Confounding is an alternate explanation for an observed association of interest. ExposureOutcome Confounder

332
Controlling confounding Study design phase Matching Restriction Random assignment Study analysis phase Stratification Statistical adjustment

333
Reasons for associations Confounding Bias Reverse causality Sampling error (chance) Causation
 Causation")
334
Bias Errors are mistakes that are: randomly distributed not expected to impact the MA less modifiable Biases are mistakes that are: not randomly distributed may impact the MA more modifiable

335
Types of bias Selection bias The process for selecting/keeping subjects causes mistakes Information bias The process for collecting information from the subjects causes mistakes

336
Selection bias People who are working are likely to be healthier than non-workers People who participate in a study may be different from people who do not People who drop out of a study may be different from those who stay in the study Hospital controls may not represent the source population for the cases

337
Information bias Misclassification, e.g. non-exposed as exposed or cases as controls Cases are more likely than controls to recall past exposures Interviewers probe cases more than controls (exposed more than unexposed)
.")
338
Birth defects and diet In a study of birth defects, mothers of children with and without infantile cataracts are asked about dietary habits during pregnancy.

339
Pesticides and cancer mortality In a study of the relationship between home pesticide use and cancer mortality, controls are asked about pesticide use and family members are asked about their loved ones’ usage patterns.

340
Minimize bias Can only be done in the planning and implementation phase Standardized processes for data collection Masking Clear, comprehensive case definitions Incentives for participation/retention

341
Reasons for associations Confounding Bias Reverse causality Sampling error (chance) Causation
 Causation")
342
Reverse causality Suspected disease actually precedes suspected cause Pre-clinical disease Exposure Disease For example: Memory deficits Reading cessation Alzheimer’s Cross-sectional study For example: Sexual activity/Marijuana

343
Minimize effect of reverse causality Done in the planning and implementation phase of a study Pick study designs in which exposure is measured before disease onset Assess disease status with as much accuracy as possible

344
Reasons for associations Confounding Bias Reverse causality Sampling error (chance) Causation
 Causation")
345
Sampling error/chance E and D are associated in a sample, but not in the population from which the sample was drawn.

346
RR in the population D+D- E+5050100 E-5050100 100100200 RR = (24 / 718) / (281 / 8566) = 1.0
 / (281 / 8566) = 1.0")
347
RR in sample 1 D+D- E+252550 E-252550 5050100 RR = (24 / 718) / (281 / 8566) = 1.0
 / (281 / 8566) = 1.0")
348
RR in sample 2 D+D- E+45550 E-153550 5050100 RR = (24 / 718) / (281 / 8566) = 1.0
 / (281 / 8566) = 1.0")
349
RR in sample 3 D+D- E+203050 E-302050 5050100 RR = (24 / 718) / (281 / 8566) = 1.0
 / (281 / 8566) = 1.0")
350
Minimize sampling error (chance) Random Selection
 Random Selection")
351
351 Time Check 12:30 PM

352
352

353
353 Revised Teach Epidemiology

354
354 Time Check 1:30 PM

355
355

356
356 Revised Teach Epidemiology

357
357 Time Check 2:00 PM

358
358

359
359 Revised Teach Epidemiology

360
360

361
361 Teach Epidemiology Enduring Epidemiological Understandings

362
362 Suicide Higher in Areas with Guns Family Meals Are Good for Mental Health Lack of High School Diploma Tied to US Death Rate Study Links Spanking to Aggression Study Concludes: Movies Influence Youth Smoking Study Links Iron Deficiency to Math Scores Kids Who Watch R-Rated Movies More Likely to Drink, Smoke Pollution Linked with Birth Defects in US Study Ties, Links, Relationships, and Associations Snacks Key to Kids’ TV- Linked Obesity: China Study Depressed Teens More Likely to Smoke

363
363 Suicide Higher in Areas with Guns Family Meals Are Good for Mental Health Lack of High School Diploma Tied to US Death Rate Study Links Spanking to Aggression Study Concludes: Movies Influence Youth Smoking Study Links Iron Deficiency to Math Scores Kids Who Watch R-Rated Movies More Likely to Drink, Smoke Pollution Linked with Birth Defects in US Study Snacks Key to Kids’ TV- Linked Obesity: China Study Depressed Teens More Likely to Smoke Ties, Links, Relationships, and Associations

364
364 1.Cause 2.Confounding 3.Reverse Time Order 4. Chance 5.Bias Possible Explanations for Finding an Association

365
365 Epidemiology... the study of the distribution and determinants of health- related states or events in specified populations and the application of this study to the control of health problems. Leon Gordis, Epidemiology, 3 rd Edition, Elsevier Saunders, 2004.

366
366 1.Cause 2.Confounding 3.Reverse Time Order 4. Chance 5.Bias Possible Explanations for Finding an Association

367
367 Cause A factor that produces a change in another factor. William A. Oleckno, Essential Epidemiology: Principles and Applications, Waveland Press, 2002. Possible Explanations for Finding an Association

368
368 Sample of 100

369
369 Sample of 100, 25 are Sick

370
370 Diagram 2x2 Table DZ X X ab c d Types of Causal Relationships

371
371 DZ X X ab c d Diagram 2x2 Table Types of Causal Relationships

372
372 Handout

373
373

374
374 X1X1 X1X1 X1X1 X1X1 X1X1 X1X1 X1X1 X1X1 X1X1 X1X1 X1X1 X1X1 X1X1 X1X1 X1X1 X1X1 X1X1 X1X1 X1X1 X1X1 X1X1 X1X1 X1X1 X1X1 X1X1 X1X1 DZ X1X1 X1X1 ab c d Diagram 2X12 Table Necessary and Sufficient

375
X1X1 375 DZ ab c d X1X1 X2X2 X3X3 ++ X1X1 X1X1 X1X1 X1X1 X1X1 X1X1 X1X1 X1X1 X1X1 X1X1 X1X1 X1X1 X1X1 X1X1 X1X1 X1X1 X1X1 X1X1 X1X1 X1X1 X1X1 X1X1 X1X1 X1X1 X1X1 X1X1 X1X1 X1X1 X1X1 X1X1 X1X1 X1X1 X1X1 X1X1 X1X1 Diagram 2X12 Table Necessary but Not Sufficient X1X1

376
X1X1 376 X1 X1X1 X1X1 X1X1 X1X1 X1X1 X1X1 X1X1 X1X1 X1X1 X1X1 X1X1 X1X1 X1X1 X1X1 X1X1 DZ ab c d X2X2 X1X1 X3X3 Diagram 2X12 Table Not Necessary but Sufficient X1X1

377
X1X1 377 DZ ab c d X1X1 X1X1 X1X1 X1X1 X1X1 X1X1 X1X1 X1X1 X1X1 X1X1 X1X1 X1X1 X1X1 X1X1 X1X1 X1X1 X1X1 X1X1 X1X1 X1X1 X1X1 X1X1 X1X1 X1X1 X1X1 X1X1 X1X1 X1X1 X1X1 X1X1 X4X4 X1X1 X7X7 X5X5 X6X6 ++ X2X2 X3X3 ++ X8X8 X9X9 ++ Not Necessary and Not Sufficient Diagram 2X12 Table X1X1

378
378 X X X X X X X X X X X X X X XX X X X X X X X X X XDZ X X ab c d X Diagram 2x2 Table Necessary and Sufficient

379
379 DZ X X ab c d X XX++ X X X X X X X X X X X X X X X XX X X X X X X X X X X X X X X X X X XX Diagram 2x2 Table Necessary but Not Sufficient

380
380 X X X X X X X X X X X X X X X X DZ X X ab c d X X X X Diagram 2x2 Table Not Necessary but Sufficient

381
381 DZ X X ab c d X X X X X X X X X X X X X X X X X X X X X X X X X X X X X XX X X X XX++ XX++ XX++ Not Necessary and Not Sufficient Diagram 2x2 Table

382
382 a b c d Heart Attack No Heart Attack Lack of Fitness No Lack of Fitness Lack of fitness and physical activity causes heart attacks.

383
383 a b c d Lead Poisoning No Lead Poisoning Lack of Supervision No Lack of Supervision Lack of supervision of small children causes lead poisoning.

384
384

385
385 Is the association causal?

386
386 Suicide Higher in Areas with Guns Family Meals Are Good for Mental Health Lack of High School Diploma Tied to US Death Rate Study Links Spanking to Aggression Study Concludes: Movies Influence Youth Smoking Study Links Iron Deficiency to Math Scores Kids Who Watch R-Rated Movies More Likely to Drink, Smoke Pollution Linked with Birth Defects in US Study Ties, Links, Relationships, and Associations 1.Cause 2.Confounding 3.Reverse Time Order 4. Chance 5.Bias Snacks Key to Kids’ TV- Linked Obesity: China Study Depressed Teens More Likely to Smoke

387
387 Teach Epidemiology Enduring Epidemiological Understandings

388
388

389
389 1.Cause 2.Confounding 3.Reverse Time Order 4. Chance 5.Bias Possible Explanations for Finding an Association

390
390 All the people in a particular group. Population Possible Explanations for Finding an Association

391
391 A selection of people from a population. Sample Possible Explanations for Finding an Association

392
392 Inference Process of predicting from what is observed in a sample to what is not observed in a population. To generalize back to the source population. Possible Explanations for Finding an Association

393
393 Sample Population Process of predicting from what is observed to what is not observed. Observed Not Observed Inference

394
394 Deck of 100 cards Population

395
395 a 25 cards b c d Population

396
396 = Population a 25 cards bc d = ab cd Odd # Even # No Marijuana Population Total

397
397 = Population a 25 cards bc d = 25 50 Total Odd # Even # No Marijuana Population

398
398 = Population = M&M’s No M&M’s Flu No Flu 25 50 Total = 25 50 Total a 25 cards bc d Odd # Even # No Marijuana Population

399
399 = Population = 25 50 Total a 25 cards bc d Risk 25 / 50 or 50% Odd # Even # No Marijuana Population

400
400 = Population a 25 cards bc d = 25 50 TotalRiskRelative Risk 25 / 50 or 50 % 50 % / 50% = = 1 50 % ____ Odd # Even # No Marijuana Population

401
401 25 cards Population

402
402 To occur accidentally. To occur without design. Chance A coincidence. Possible Explanations for Finding an Association

403
403 Chance

404
404 Chance

405
405 Population Sample b Sample of 20 cards 25 cards Sample

406
406 Population Sample b Sample of 20 cards 25 cards 10 Total 55 55 Odd # Even # No Marijuana Sample

407
407 Population Sample b Sample of 20 cards 25 cards 10 Total 55 55 Risk 5 / 10 or 50 % Odd # Even # No Marijuana Sample

408
408 Population Sample b Sample of 20 cards 25 cards 10 Total 55 55 Risk 5 / 10 or 50 % Odd # Even # No Marijuana Sample Relative Risk 50 % / 50% = = 1 50 % ____

409
409 b Sample of 20 cards Total Risk 5 / 10 = 50 % 50 1 Relative Risk By Chance CDC % ___ % = Odd # Even # No Marijuana Sample

410
410 10 Total 55 55 Risk 5 / 10 or 50 % Relative Risk How many students picked a sample with 5 people in each cell? = 1 50 % ____ Odd # Even # No Marijuana Chance By Chance

411
411 Relative Risks Greater than 1Less than 1 Chance

412
412 Study Links Having an Odd Address to Marijuana Use Ties, Links, Relationships, and Associations

413
413 Relative Risks Greater than 1Less than 1 Possible Explanations for Finding an Association

414
414 Study Links Having an Even Address to Marijuana Use Ties, Links, Relationships, and Associations

415
415 Relative Risks Greater than 1Less than 1 1 By Chance 25 cards Chance

416
416 b Sample of 20 cards Total Risk 5 / 10 = 50 % 50 Relative Risk 50 % ___ % = Odd # Even # No Marijuana Different Sample Sizes

417
417 Relative Risks Greater than 1Less than 1 1 By Chance 25 cards Chance 50 cards

418
418 b Sample of 20 cards Total Risk 5 / 10 = 50 % 50 Relative Risk 75 % ___ % = Odd # Even # No Marijuana Different Sample Sizes

419
419 Relative Risks Greater than 1Less than 1 1 By Chance 25 cards Chance 75 cards

420
420 b Sample of 20 cards Total Risk 5 / 10 = 50 % 50 1 Relative Risk 99 % ___ % = Odd # Even # No Marijuana Different Sample Sizes

421
421 Relative Risks Greater than 1Less than 1 1 By Chance 25 cards Chance 99 cards

422
422 Suicide Higher in Areas with Guns Family Meals Are Good for Mental Health Lack of High School Diploma Tied to US Death Rate Study Links Spanking to Aggression Study Concludes: Movies Influence Youth Smoking Study Links Iron Deficiency to Math Scores Kids Who Watch R-Rated Movies More Likely to Drink, Smoke 1.Cause 2.Confounding 3.Reverse Time Order 4. Chance 5.Bias Snacks Key to Kids’ TV- Linked Obesity: China Study Depressed Teens More Likely to Smoke Association is not necessarily causation. Ties, Links, Relationships, and Associations

423
423 Teach Epidemiology Enduring Epidemiological Understandings

424
424

425
425 Revised Teach Epidemiology

426
426 Time Check 3:30 PM

427
427

428
428 Teach Epidemiology Enduring Epidemiological Understandings

429
Teach Epidemiology Explaining Associations and Judging Causation

430
1.Cause 2.Confounding 3.Reverse Time Order 4. Chance 5.Bias Teach Epidemiology Explaining Associations and Judging Causation Coffee and Cancer of the Pancreas

431
431

432
432 Guilt or Innocence?Causal or Not Causal? Does evidence from an aggregate of studies support a cause-effect relationship? Teach Epidemiology Explaining Associations and Judging Causation

433
433 Sir Austin Bradford Hill “The Environment and Disease: Association or Causation?” Proceedings of the Royal Society of Medicine January 14, 1965 Teach Epidemiology Explaining Associations and Judging Causation Handout

434
434 “In what circumstances can we pass from this observed association to a verdict of causation?” Teach Epidemiology Explaining Associations and Judging Causation

435
435 “Here then are nine different viewpoints from all of which we should study association before we cry causation.” Teach Epidemiology Explaining Associations and Judging Causation

436
Does evidence from an aggregate of studies support a cause-effect relationship? 1. What is the strength of the association between the risk factor and the disease? 2. Can a biological gradient be demonstrated? 3. Is the finding consistent? Has it been replicated by others in other places? 4. Have studies established that the risk factor precedes the disease? 5. Is the risk factor associated with one disease or many different diseases? 6. Is the new finding coherent with earlier knowledge about the risk factor and the m disease? 7. Are the implications of the observed findings biologically sensible? 8. Is there experimental evidence, in humans or animals, in which the disease has m been produced by controlled administration of the risk factor? Teach Epidemiology Explaining Associations and Judging Causation

437
Handout Teach Epidemiology Explaining Associations and Judging Causation

438
Timeline Cohort Study Randomized Controlled Trial Timeline Case-Control Study Timeline Cross-Sectional Study Timeline E E O O O O E E E E Healthy People E Random Assignment E O O O O Healthy People E E O O O O Teach Epidemiology Explaining Associations and Judging Causation

439
Teach Epidemiology Explaining Associations and Judging Causation Handout

440
440 Stress causes ulcers. Helicobacter pylori causes ulcers. Teach Epidemiology Explaining Associations and Judging Causation

441
441 * * * * * * * * * Teach Epidemiology Explaining Associations and Judging Causation

442
442 Teach Epidemiology Explaining Associations and Judging Causation

443
443 Time Check 4:30 PM

444
444

Similar presentations


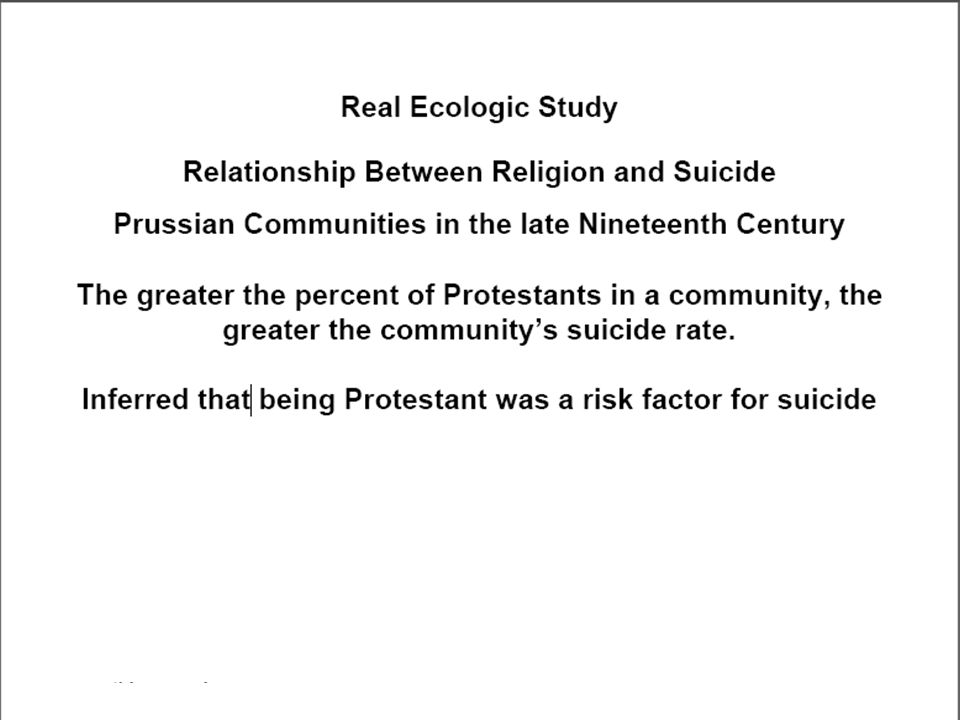

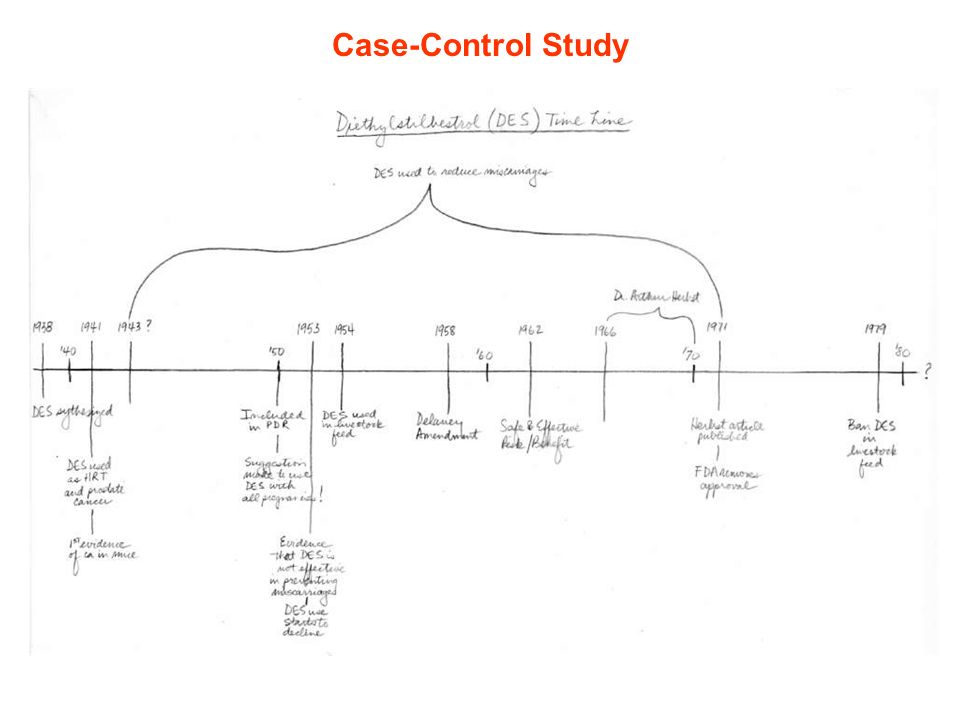


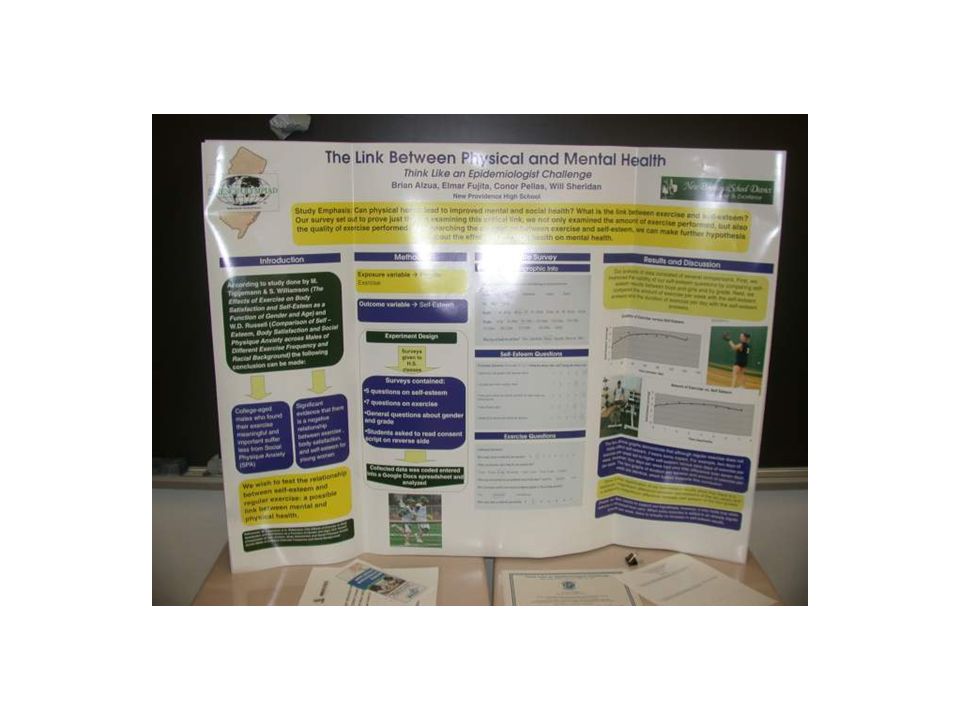

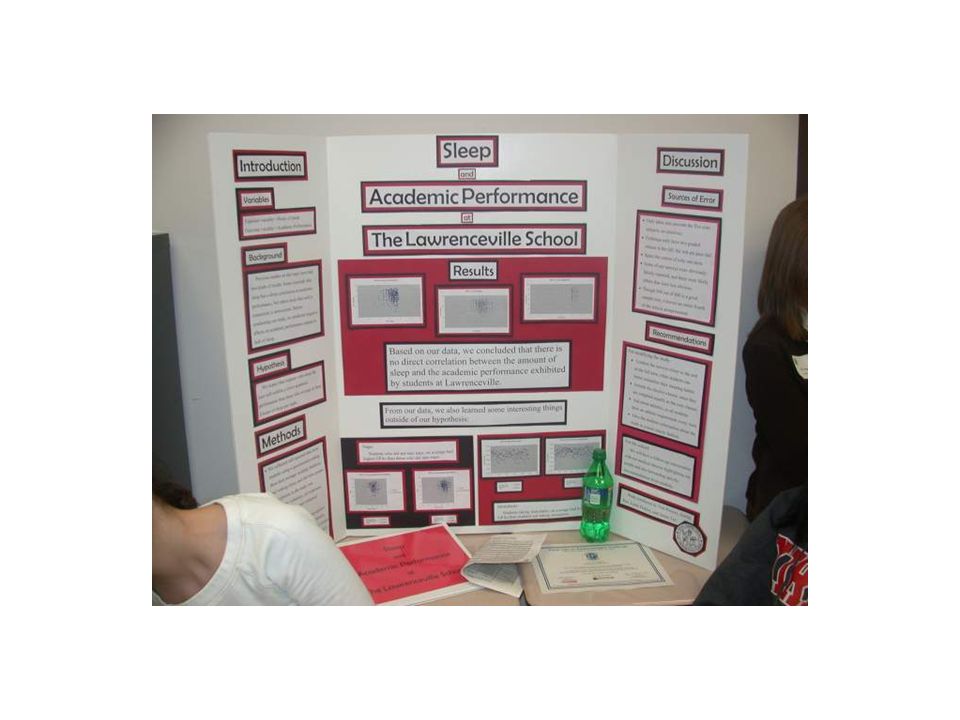


: Is there an association between.>")


: Is there an association.>")

