Download presentation
Presentation is loading. Please wait.

1
Choice of Methods and Instruments

2
Introduction Choice of proper instrument or method of analysis is a major preventive quality assurance activity that will affect the quality of the service provided The process of choosing a new instrument or kit can be divided into two parts: Method selection Method evaluation

3
A good quality assurance program has three major aspects:

4
1- METHOD SELECTION The goal of the selection process is to choose a test method that best suits the laboratory's service requirements The primary consideration for making this selection should be based on the test method's usefulness in providing medically relevant data The demands on the laboratory are imposed by the users of its services and this information can be determined by communicating with these users In making the selection among various methods, the desired characteristics should be carefully considered

5
1- METHOD SELECTION Three classes of characteristics should be considered: A- The Method's Application Characteristics: These are the characteristics of a test method that determine whether it can or cannot be implemented in a particular laboratory, include factors such as: Personnel Turnaround time Cost per test Space and utility requirements Rate of analysis Types of specimens Safety considerations Run size, materials Sample volume

6
1- METHOD SELECTION B- Methodology Characteristics:
These contribute to the quality of the method such as: Chemical sensitivity and specificity, manner of calibration, and optimization of the reaction conditions C- Performance Characteristics: Those that determine how well the method performs in its practical application. They include: the method's linear range (also known as the analytical or working range), its precision, and its accuracy
, its precision, and its accuracy.")
7
2- SOURCES OF INFORMATION
You need to have a full information before deciding to buy a new instrument or kit The best sources of information are: The laboratory technical literature (Journals) It will have evaluations and recommendations for different methods and instruments Use the literature to find the method's application, methodology, and performance characteristics Conferences & Exhibitions Vendors come to show their wares with demonstrations and discussions of their product Word-of-mouth recommendations From reliable and trustworthy sources Contact others to find out what they are using and if they are happy or unhappy with their choice
 It will have evaluations and recommendations for different methods and instruments. Use the literature to find the method s application, methodology, and performance characteristics. Conferences & Exhibitions. Vendors come to show their wares with demonstrations and discussions of their product. Word-of-mouth recommendations. From reliable and trustworthy sources. Contact others to find out what they are using and if they are happy or unhappy with their choice.")
8
2- SOURCES OF INFORMATION

9
2- SOURCES OF INFORMATION

10
2- SOURCES OF INFORMATION

11
3- METHOD EVALUATION Once an instrument or test kit has been selected as a possible candidate for use, it should be carefully evaluated before making a final commitment The evaluation process should be logically structured so that a minimum of time and effort is invested to obtain maximum results Goals of the evaluation includes: The first determinations to be made in a method evaluation are the imprecision and inaccuracy, which should be compared with the maximum allowable error based on medical criteria Discover if the new method fits into the framework of the laboratory's organization and workload

12
3- METHOD EVALUATION Imprecision is estimated from studies in which multiple aliquots of the same specimen (with a constant concentration) are analyzed repetitively (Replication Experiment) Inaccuracy, or the difference between a measured value and its actual value, is due to the presence of a systemic error Systemic error can be due to constant or proportional error and is estimated from Recovery study and interference study
 are analyzed repetitively (Replication Experiment) Inaccuracy, or the difference between a measured value and its actual value, is due to the presence of a systemic error. Systemic error can be due to constant or proportional error and is estimated from Recovery study and interference study.")
13
Allowable Analytic Error (Ea)
Probably the most important aspect of method evaluation is to determine if the random and systematic error (total error) is less than the Ea The error that can be tolerated without invalidating the medical usefulness of the test The Clinical Laboratory Improvement Amendments of 1988 (CLIA 88) have published Eas for an array of clinical tests physiologic variation, pathologist judgment
 is less than the Ea. The error that can be tolerated without invalidating the medical usefulness of the test. The Clinical Laboratory Improvement Amendments of 1988 (CLIA 88) have published Eas for an array of clinical tests. physiologic variation, pathologist judgment.")
14
Allowable Analytic Error (Ea)
")
15
3- METHOD EVALUATION The evaluation should last for no less than one week and no more than 60 days. Barnett and Westgard recommend a minimum of 20 days for a complete evaluation that includes day-to-day precision studies. Enough time should be allowed to perform all of the necessary evaluation experiments and to observe the instrument's day-to-day variation. Too short a time period may result in important data being missed or misrepresented. Too long an evaluation period may last longer than the expiration date of reagents, calibrators, and controls, and also incorporate long-range instrument variation.

16
A- Instrument and Method Evaluation Steps:
Construct a good evaluation plan and establish a working procedure detailing calibration, operation, and maintenance during the evaluation period. Acquire enough reagents, calibrators, and controls to last the evaluation period. The plan should be designed as a series of logical steps so that failure in the preliminary steps will cancel the continuation of the process.

17
A- Instrument and Method Evaluation Steps:
The course that the evaluation process takes will depend on the availability of an acceptable comparative method If the comparative method has satisfactory and well-documented precision and accuracy, then the evaluation should determine if the new method is as accurate and precise as the old. If a satisfactory comparative method is not available for comparison, then other experiments should be used to determine the new method's precision and accuracy. If possible, the entire evaluation should be conducted by a single individual. Variations between individual techniques and bias can be excluded if one person, conducts all of the experiment.

18
B- Linearity Check The first step in the Evaluation process is to perform a Linearity Check It is important to assess the useful analytical range of a laboratory method, i.e., the lowest and highest test results that are reliable and can be reported This confirms that the instrument or method is linear over its published working range stated by Manufacturers

19
B- Linearity Check How to perform linearity check:
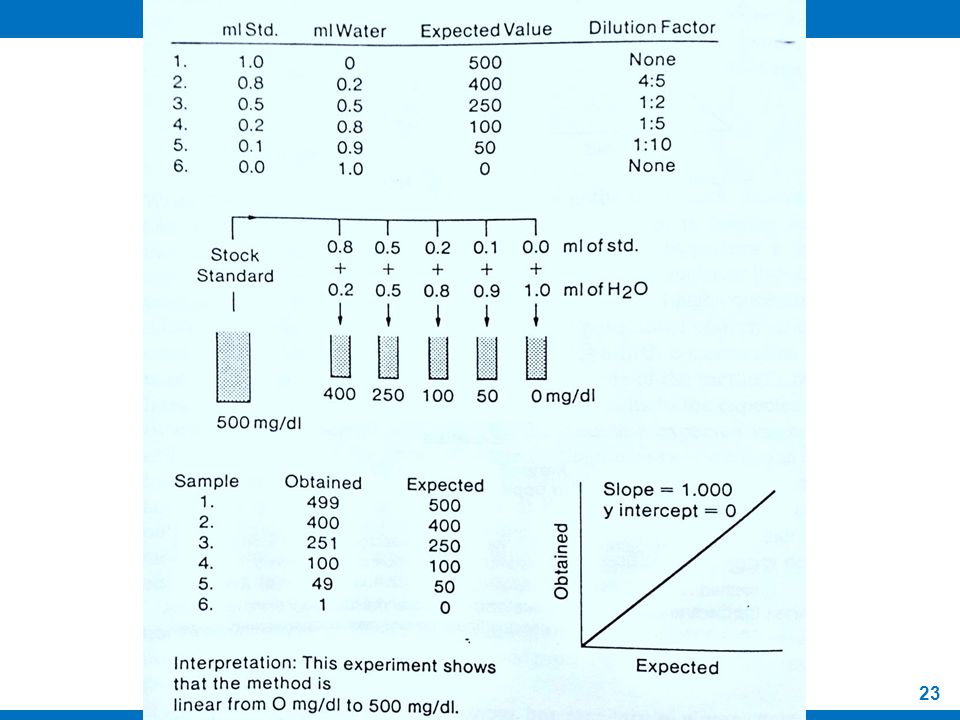
An aqueous or protein-based standard of high concentration is diluted to obtain a series of samples of lesser but known concentration. The range of samples should cover both ends of the method’s range of linearity. Analyze the samples and compare the results to the expected values by constructing a scatter plot Place the expected value on the x-axis and the obtained value on the y-axis and draw a line of agreement

20
B- Linearity Check Example of linearity experiment (glucose method with a published range from mg/dl) A known glucose standard of 500 mg/dl is diluted (as shown in the figure) with deionized water All dilutions should be made from a stock sample avoiding serial dilutions Dilution errors are magnified in serial dilutions Use volumetric glassware and good pipetting technique when preparing the dilutions
 with deionized water. All dilutions should be made from a stock sample avoiding serial dilutions. Dilution errors are magnified in serial dilutions. Use volumetric glassware and good pipetting technique when preparing the dilutions.")
21
B- Linearity Check Analyze each sample in triplicate and average the results. Accept the method's linearity if the line of agreement has a slope of ± 0.03 and an intercept of zero plus or minus the within-run precision of the method. (If the within-run precision of the method is not known, it will be determined in the next series of experiments; consequently this part of the evaluation may not be completed until the replication experiments are completed). Investigate pipetting errors as the probable cause of a nonlinear line by repeating the experiment with a freshly diluted series of samples. If the method is not linear over its published range, stop and investigate the problem before any further experiments are carried out. When a method loses linearity on either end of its range the line will start to curve.
. Investigate pipetting errors as the probable cause of a nonlinear line by repeating the experiment with a freshly diluted series of samples. If the method is not linear over its published range, stop and investigate the problem before any further experiments are carried out. When a method loses linearity on either end of its range the line will start to curve.")
22
Glucose Colorimetric Assay Kit
Cayman Chemicals Co.

25
Experiments and type of error which can be detected

26
C- Replication Experiment
This evaluation experiment is used to demonstrate a test method's precision and random error Three different replication studies are performed: within-run, within-day, and day-to-day Choose three samples that have the same matrix or physical qualities as the patient samples that the method will be analyzing The three should represent the low, normal, and high physiological concentrations of the analyte in question

27
C- Replication Experiment
The within-run replication experiment measures precision or the lack of it caused by random error within an analytical run Each sample is analyzed a minimum of 20 times within a single analytical run The within-day replication experiment measures the amount of random error between runs that occurs within a single day Each of the three samples is analyzed a minimum of 20 times throughout the day in several analytical runs The day-to-day replication experiment measures the amount of random error inherent in the method from day-to-day Analyze each sample daily for a minimum of 20 consecutive days

28
C- Replication Experiment
For most chemical constituents, lyophilized control serum or some similar stable material should be used for the day-to-day replication experiments Though there are some differences between prepared controls and patient specimens, the control material will remain stable over the 20-day period and chances of obtaining it in the desired concentrations and quantities are greater than using only patient samples

29
C- Replication Experiment
For each of the replication experiments, calculate a mean, mode, standard deviation (s), and coefficient of variation (CV) for each sample The greater the imprecision of the method, the larger the standard deviation will be If the distribution of the values is due to random chance, then it should have a normal or Gaussian distribution with the mean equal to the mode If the distribution is skewed as the result of some random error, then the mode and the mean will not be equal
, and coefficient of variation (CV) for each sample. The greater the imprecision of the method, the larger the standard deviation will be. If the distribution of the values is due to random chance, then it should have a normal or Gaussian distribution with the mean equal to the mode. If the distribution is skewed as the result of some random error, then the mode and the mean will not be equal.")
30
C- Replication Experiment
A method lacks precision if it has a large coefficient of variation and there is a substantial difference between the mean and the mode Such random error is unacceptable and potentially dangerous to the patient. Ninety-five percent of the values should fall within two standard deviations of the mean One in 20 samples will be beyond the 2s limits If more than 1 sample in 20 or 2 in 40 are beyond 2s for unexplained reasons (other than acknowledged errors in pipetting, short sampling, or some other obvious problem) the method should be discarded as having too great a degree of random error and thus is potentially dangerous to the patient
 the method should be discarded as having too great a degree of random error and thus is potentially dangerous to the patient.")
31
C- Replication Experiment
The acceptable CV will vary, depending on the medical significance of the analyte that the method is measuring The within-run and within-day replication experiments are optimistic evaluations of the method’s precision but are useful in determining if the method is performing properly The day-to-day replication experiment is a better indication of the method’s overall precision

32
D- Recovery Experiment
The recovery experiment is performed to estimate the proportional systematic error in the absence of a reliable comparative or reference method This is the type of error whose magnitude increases as the concentration of analyte increases The error is often caused by a substance in the sample matrix that reacts with the sought for analyte and therefore competes with the analytical reagent

33
D- Recovery Experiment
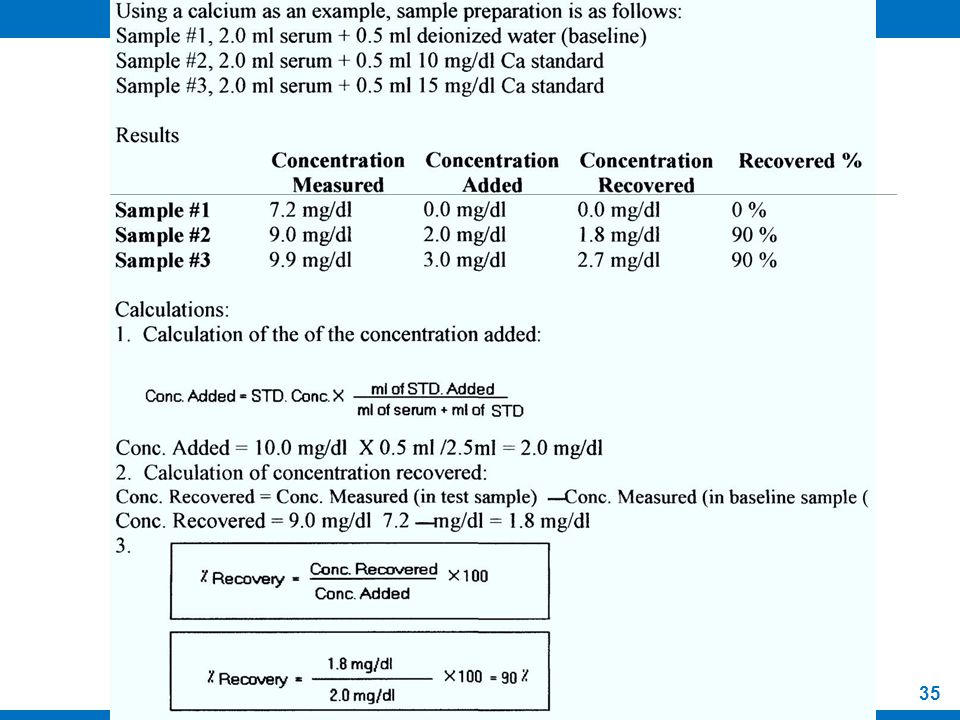
A patient sample is spiked with varying amounts of pure standard and then analyzed A baseline sample and samples with concentration at the medical decision levels should be prepared After analyzing the samples in triplicate and averaging the values for each, the expected results are compared to the actual results and the degree of proportional systematic errors defined as the percent of the added analyte recovered Westagrd states that the limits of acceptability occur when the percentage of error is less than the determined allowable analytical error (95% of the limit of allowable error) at the medical decision levels
 at the medical decision levels.")
34
D- Recovery Experiment
If it is determined that the allowable error of a value is limited to 95% of that value without any harm or influence on the physician’s course of treatment, then any proportional systematic error greater than 5% at that decision level will judge the method to be unacceptable

36
D- Recovery Experiment
Interpretation This method has a 90% recovery rate or a 10% proportional systematic rate based on this experiment The acceptable level of recovery or accuracy will vary, depending on the analyte and the concentration

37
E- Interference Experiment
The interference experiment is performed to estimate the systematic error caused by other materials that may be present in the specimen being analyzed We describe these errors as constant systematic errors because a given concentration of interfering material will generally cause a constant amount of error regardless of the concentration of the analyte being tested in the specimen As the concentration of interfering material changes, however, the size of the error is expected to change

38
E- Interference Experiment
The volume of the interferer should be small relative to the original test sample to minimize the dilution of the patient specimen However the amount of dilution is not as important as maintaining the exact same dilutions for the pair of test samples Using the test method in question, a sample is analyzed in triplicate to determine a value A specific amount and concentration of a substance thought or known to be an interfering substance is added to this sample and the sample is then reanalyzed

39
E- Interference Experiment
The difference between the result of the sample with and without the substance is calculated The sample is repeated with several different concentrations of the interfering substance The acceptability of this experiment, according to Westagrd, is that the difference between the two values, one with and the other without interfering substance, should be less than the allowable analytical error at that concentration

40
E- Interference Experiment
Interference to be tested Bilirubin can be tested by addition of a standard bilirubin solution Hemolysis is often tested by removing one aliquot of a sample, then mechanically hemolyzing or freezing and thawing the specimen before removing a second aliquot. Lipemia can be tested by addition of a commercial fat emulsion, such as Liposyn (Abbott Laboratories) or lntralipid (Cutter Laboratories) Additives to specimen collection tubes can be conveniently studied by drawing a whole blood specimen, then dispensing aliquots into a series of tubes containing the different additives
 or lntralipid (Cutter Laboratories) Additives to specimen collection tubes can be conveniently studied by drawing a whole blood specimen, then dispensing aliquots into a series of tubes containing the different additives.")
41
E- Interference Experiment
As example, determination of glucose will be used Creatinine is an interfering substance in this method. By adding creatinine to a sample in measured amounts the amount of interference can be determined Prepare the sample as follows: Sample #1, 0.9 ml serum ml deionized water (baseline) Sample #2, 0.9 ml serum ml of 50 mg/dl creatinine STD Sample #3, 0.9 ml serum ml of 100 mg/dl creatinine STD Each sample is prepared and run in triplicate and the results are averaged.
 Sample #2, 0.9 ml serum ml of 50 mg/dl creatinine STD. Sample #3, 0.9 ml serum ml of 100 mg/dl creatinine STD. Each sample is prepared and run in triplicate and the results are averaged.")
42
E- Interference Experiment
Results: Amount of glucose measured Amount of Creatinine added Interference Sample # 1 100 mg/dl 0 mg/dl Sample # 2 104 mg/dl 5 mg/dl + 4 mg/dl Sample # 3 111 mg/dl 10 mg/dl +11 mg/dl

43
E- Interference Experiment
Calculations: Amount of creatinine added Amount of Interference Interference = Conc. Measured (test) — Conc. Measured (baseline) Interference = mg/dl — mg/dl = 4 mg/dl Conc. Added = STD. Conc. X ml STD. Added ml of serum+ ml of STD Conc. Added = 50 mg/dl X 0.1 ml = 5 mg/dl 0.1 ml ml
 — Conc. Measured (baseline) Interference = 104 mg/dl 100 — 100 mg/dl = 4 mg/dl. Conc. Added = STD. Conc. X. ml STD. Added. ml of serum+ ml of STD. Conc. Added = 50 mg/dl X. 0.1 ml. = 5 mg/dl. 0.1 ml ml.")
44
E- Interference Experiment
Interpretation: The experiment shows that increasing amounts of creatinine will result in an increasing positive interference The acceptable level of recovery and accuracy will vary depending on the analyte and the concentration In this case, further investigating is recommended

45
F- Comparison Of Methods
The comparison of methods is a procedure that determines accuracy and precision by comparing the test method to a method of known precision and accuracy The comparative method can be either a recognized reference method (is one that has a well documented low level of imprecision and inaccuracy) or a method of analysis that the laboratory wishes to replace. Choose a method that is well documented and widely accepted Check the comparative method carefully during the experiment to ensure that it is performing properly Run controls and use proper procedures in performing the comparison on both methods
 or a method of analysis that the laboratory wishes to replace. Choose a method that is well documented and widely accepted. Check the comparative method carefully during the experiment to ensure that it is performing properly. Run controls and use proper procedures in performing the comparison on both methods.")
46
F- Comparison Of Methods
When using a known reference method, all of the observed differences between the methods can be attributed to the new method. When the comparative method is the one that is being used and the bias and analytical error is known, then part of the observed analytical error noted between the two methods can be attributed to the comparative method, with the remaining error belonging to the test method The difference between the two methods at medical decision levels should be less than the allowable analytical error for that concentration of the analyte

47
F- Comparison Of Methods
This experiment involves simultaneously analyzing split samples on both the test and comparative method Only patient samples should be used for evaluation between methods Lyophilized, aqueous, or ethylene glycol-based control samples have slightly different physical properties than fresh human serum or plasma and may react differently in different systems Westgard recommends that each sample be run in duplicate, at different analytical runs This is done in order to check on the validity of the experimental observations and to detect random errors, such as mixing up of samples and short sampling

48
F- Comparison Of Methods
The replicates should be analyzed the same day on the same instrument and within as short a time as possible The difference between the duplicate measurements should be less than or equal to the determined between-run precision If the differences are grater than this, suspect an error Analyze a minimum of 40 samples, 5 samples a day for 8 days Select a variety of concentrations so that the entire linear or working range of the new method will be represented This requires the pre-selection of samples but comparing samples only in the " normal " range can cover analytical differences between the methods at medical decision levels

49
F- Comparison Of Methods
Reduce opportunities for bias and mistakes to occur: Limit the number of technologists participating in the experiment. Try to run samples on both instruments at the same time to limit the effects of sample deterioration. Use acceptable techniques in preparing reagents and samples for analysis.

50
F- Comparison Of Methods
There are several ways of approach in evaluating the comparison between two methods: Plot the results on a scattergram Linear regression analysis The paired t-Test The F-Test The correlation of coefficient

51
F- Comparison Of Methods
One of the easiest and most visually studied is to plot the results on a scattergram, draw a best straight line through the points, and determine the slope and intercept of the line The slope and the intercept offer a fair evaluation of the agreement between the methods Data should be plotted on the scattergram on a daily basis and inspected for outliers so that original samples can be reanalyzed as needed If the technologist waits until all of the samples are analyzed there will be no opportunity to investigate outliers or to reanalyze samples

52
F- Comparison Of Methods
Plot the test method on the y-axis and the reference or comparative method on the x-axis. A best fit straight line can be drawn through the plotted points A visual inspection of the line and the points around it can give a preliminary assessment of the agreement between the methods

53
F- Comparison Of Methods
Perfect correlation (Hypothetical) Slope (b) = 1 Y intercept (a) = 0 Correlation coefficent (r) = 1
 Slope (b) = 1 Y intercept (a) = 0 Correlation coefficent (r) = 1.")
Similar presentations


 for Medical Laboratories: An introduction Dr. Otto Panagiotakis and Dr. Alexander Haliassos ESEAP – Greek Proficiency Testing.>")


, Mansoura.>")
