Download presentation
Presentation is loading. Please wait.

2
The Bohr model was proposed: 1913 by Neils Bohr After observing the H line emission spectrum

3
Why did Bohr study hydrogen? Simplest atom – only has one electron The electrons of the gas are easily excited by a current

4
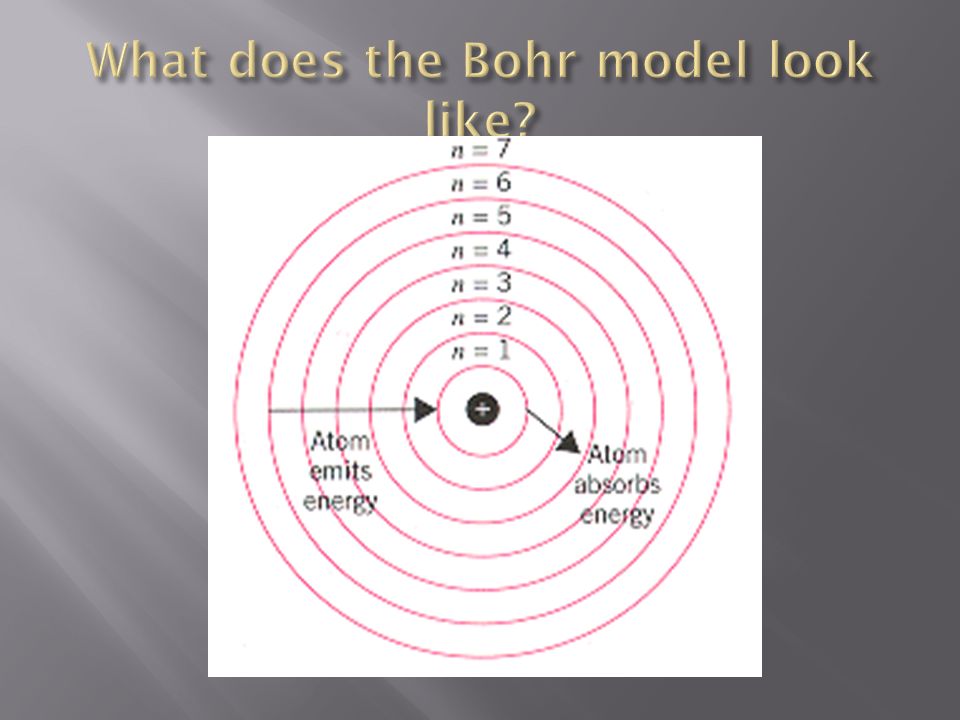
1. How are the electrons moving? As particles with a definite circular path 2. Where are they located? - In rings, or orbitals, around the nucleus 3. How much energy do they have? - The energy of an electron can be calculated

5
E = -2.178 x 10 -18 (Z 2 /n 2 ) Z= atomic number N= ring number or energy level Calculations of energy change for transitions: E = E final – E initial E = -2.178x10 -18 J (Z 2 /n f 2 – Z 2 /n i 2 )
 Z= atomic number N= ring number or energy level Calculations of energy change for transitions: E = E final – E initial E = x J (Z 2 /n f 2 – Z 2 /n i 2 )")
6
Electrons closer to the nucleus have LOWER energy values. At higher energy levels, the energy is HIGHER

8
Each orbit is an energy level designated by the variable n. n = 1 is the ground state. n = ∞ is when the electron has been removed from the atom. Energy is quantized, meaning there are no levels in between the levels designated by n = 1, 2, 3, 4, etc.

9
When atoms are excited by an outside energy source heat, flame, or electric current, the electrons can be promoted to higher energy states. However, this situation is highly unstable and the electron will eventually return to a lower energy state. When the electron returns to a lower energy level, energy is given off in the form of quanta (light), also known as a photon of light. How do we represent this electron transition in our model?
, also known as a photon of light. How do we represent this electron transition in our model .")
10
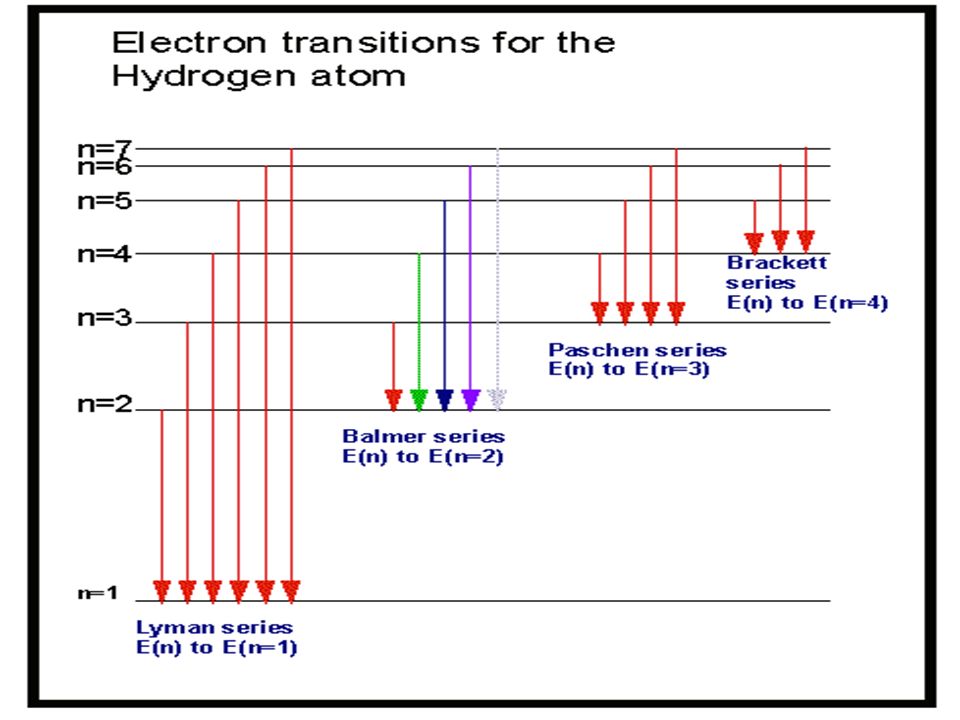
Using a spectroscope, Bohr noticed that hydrogen gave off a spectrum rather than a continuous spectrum (rainbow) when excited. He calculated the energy associated with each transition based on the wavelength of light given off. Each energy value corresponded to a certain electron transition from an excited state back to the n=2 energy level.

11
Wavelength of light observed (nm) Frequency of light (/ sec) Energy of light (Joule) N initial (excited state) N final (lower energy level) 410. nm7.32 x10 16 -4.84 x10 -19 62 434 nm6.91 x10 16 -4.57 X10 -19 52 486 nm6.17 x10 16 -4.08 X10 -19 42 656 nm4.57 x10 16 -3.03 X10 -19 32

12
Hydrogen produces lines in the visible, ultraviolet, and infrared regions of the electromagnetic spectrum Each set of spectral lines has a name: Balmer series Lyman series Paschen series

Similar presentations


 is broken up into its component frequencies.>")


>")


 electron (-) Courtesy Christy Johannesson www.nisd.net/communicationsarts/pages/chem.>")


