Download presentation
Presentation is loading. Please wait.

1
Quantifying the uncertainty in spatially- explicit land-use model predictions arising from the use of substituted climate data Mike Rivington, Keith Matthews and Kevin Buchan. Macaulay Institute, Craigiebuckler, Aberdeen, Scotland. m.rivington@macaulay.ac.uk MODSIM 2003, Townsville, Australia. Land Allocation Decision Support System

2
“There is a serious limit on the application of agricultural, hydrological and ecosystem models if [appropriate spatially and temporally representative] biophysical data are not directly available” - Gerrit Hoogenboom (2000)
![There is a serious limit on the application of agricultural, hydrological and ecosystem models if [appropriate spatially and temporally representative] biophysical data are not directly available - Gerrit Hoogenboom (2000)](http://images.slideplayer.com/25/7892221/slides/slide_2.jpg "There is a serious limit on the application of agricultural, hydrological and ecosystem models if [appropriate spatially and temporally representative] biophysical data are not directly available - Gerrit Hoogenboom (2000)")
3
Data + Parameters Results

4
Rationale for quantifying uncertainty Land use models often have a fundamental requirement for biophysical data: Weather data is highly spatially and temporally variable Soils data can be highly spatially variable and temporally variable with management Use of non-representative biophysical data impacts on quality of model output –Restricts calibration and validation Decision Support Systems often use models for predictions: Model output will be fundamentally flawed if inappropriate biophysical data is used Therefore need to quantify the impacts of using ‘non-ideal’ biophysical input data on model output to determine consequences on DSS performance

5
Choosing an appropriate weather data source Knowing the decay in weather data similarity enables distance thresholds to be set beyond which alternative methods of data supply must be used By knowing the impacts of using alternative Met Stations on model output, it is possible to evaluate options for alternative weather data sources: –Data generators –Spatial interpolation –Calculated, i.e. solar radiation derived from max and min temperature

6
Identifying a suitable weather data source Met stations with solar radiation data

7
Aims and Purpose To investigate the spatial dissimilarity in solar radiation –How the dissimilarity increases with distance from original data source Determine the impacts on a cropping systems model (CropSyst) output arising from the use of substitute weather data from Met stations at increasing distance from the point of model application
 output arising from the use of substitute weather data from Met stations at increasing distance from the point of model application")
8
Materials and Method Spatial dissimilarity in solar radiation Create database of daily synchronised weather data (rain, max + min temp, solar radiation) for Met stations with +3 years solar radiation data for 24 locations
 for Met stations with +3 years solar radiation data for 24 locations")
9
Abd=Aberdeen (29) Abp=Aberporth (36) Ald=Aldergrove (25) Alt=Altnaharra (3) Auc=Auchincruive (19) Avi=Aviemore (12) Bra=Bracknell (24) Bro=Brooms Barn (16) Caw=Cawood (29) Den=Denver (18) Dun=Dunstaffnage (23) Eas=East Malling (34) Esk=Eskdalemuir (24) Eve=Everton (29) Haz=Hazelrigg (17) Inv=Inverbervie (4) Ler=Lerwick (47) Loc=Loch Glascarnoch (5) Myl=Mylnefield (25) Rot=Rothamstead (28) Sto=Stornoway (13) Sut=Sutton Bonnington (26) Tul=Tulloch Bridge (6) Wal=Wallingford (26)
 Abp=Aberporth (36) Ald=Aldergrove (25) Alt=Altnaharra (3) Auc=Auchincruive (19) Avi=Aviemore (12) Bra=Bracknell (24) Bro=Brooms Barn (16) Caw=Cawood (29) Den=Denver (18) Dun=Dunstaffnage (23) Eas=East Malling (34) Esk=Eskdalemuir (24) Eve=Everton (29) Haz=Hazelrigg (17) Inv=Inverbervie (4) Ler=Lerwick (47) Loc=Loch Glascarnoch (5) Myl=Mylnefield (25) Rot=Rothamstead (28) Sto=Stornoway (13) Sut=Sutton Bonnington (26) Tul=Tulloch Bridge (6) Wal=Wallingford (26)")
10
Materials and Method Spatial dissimilarity in solar radiation: Create database of daily synchronised weather data (rain, max + min temp, solar radiation) for Met stations with +3 years solar radiation data for 24 locations Use a search and optimisation replacement strategy for missing data Calculate yearly solar radiation RMSE values (1–365 daily difference in solar radiation) between site 1 and sites 2-23 for all corresponding years, i.e:
 for Met stations with +3 years solar radiation data for 24 locations Use a search and optimisation replacement strategy for missing data Calculate yearly solar radiation RMSE values (1–365 daily difference in solar radiation) between site 1 and sites 2-23 for all corresponding years, i.e:")
11
Materials and Method Where: O = observed daily solar radiation for site 1 E = observed daily solar radiation for site 2 Yearly RMSE = This process was applied for each site, i.e. - O for a fixed site - E for the nearest site, then second nearest, third nearest etc, for all sites in the data base with corresponding years data. This produced a matrix data set from which it was possible to derive the mean, maximum and minimum RMSE for each site.

12
Materials and Method Impacts on CropSyst output Run a standardised Spring Barley scenario within CropSyst for each year of available weather data per site –weather data the only variables Compare yield estimates from one site with those from the three nearest sites for all corresponding years of available weather data Metrics used: –Difference in mean yield / n –Probability of means being equal –Difference in total yield / n –Absolute difference / n (sum of over and under estimates) –Size of maximum single error (where n = number of corresponding years)
 –Size of maximum single error (where n = number of corresponding years)")
13
Results Spatial dissimilarity in solar radiation Range in rates and patterns of dissimilarity –Geographical variation

14
Geographical variation - South-East Britain

15
Geographical variation - Northern Britain

16
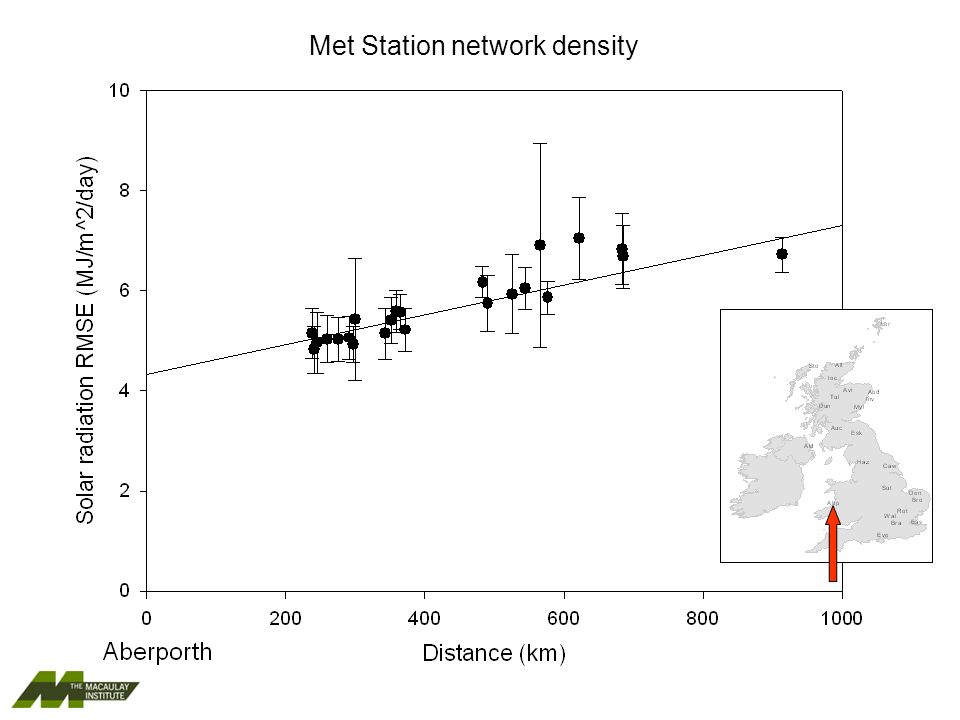
Results Spatial dissimilarity in solar radiation Range in rates and patterns of dissimilarity –Geographical variation –Met Station network density

17
Met Station network density

19
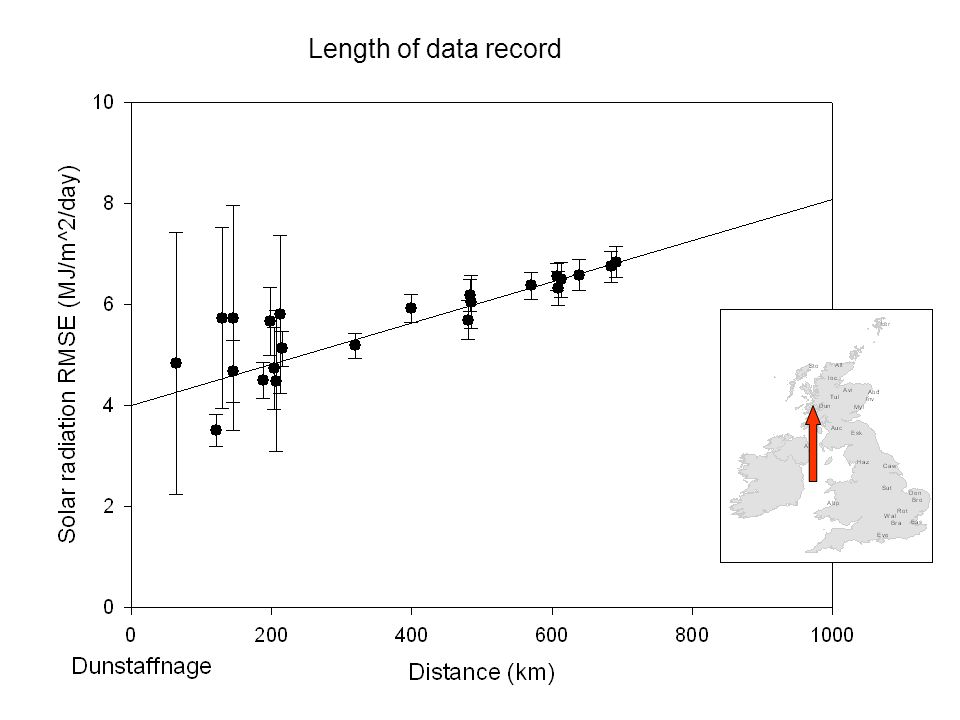
Results Spatial dissimilarity in solar radiation Range in rates and patterns of dissimilarity –Geographical variation –Met Station network density –Length of data record

20
Length of data record

22
Results Spatial dissimilarity in solar radiation Range in rates and patterns of dissimilarity –Geographical variation –Met Station network density –Length of data record Nearest neighbour does not always provide the best substitute

23
Best substitute – not always nearest neighbour

24
Impact on CropSyst output Best substitute weather data – not always the nearest neighbour –At 4 sites nearest substitute provided best fit for metrics –At 2 sites second nearest substitute provided best fit for metrics –At 3 sites third nearest substitute provided best fit for metrics –Remaining sites had a range of best substitutes per metric Results

25
SiteSubstituteDist (km) Mean Yield Diff / n (t/ha) Total Yield Diff / n (t/ha) Absolute Diff / n (t/ha) Max Error (t/ha) InverbervieAberdeen32-0.0068-0.02720.1892-0.33 Mylnefield650.03610.21640.50840.89 Aviemore102-0.6264-1.87911.8791-5.53 AuchencruiveEskdalemuir88-0.1081-1.84081.1547-2.97 Dunstaffnage121-0.0088-0.15910.59921.49 Aldergrove140-0.0029-0.04940.36191.38 HazelriggCawood109-0.0904-1.35661.3566-3.27 Eskdalemuir147-0.1805-2.34652.3465-6.24 Sutton B’ton166-0.07-0.97961.0031-2.09 CawoodHazelrigg1090.10251.5375 3.27 Sutton B’ton1110.01310.32740.66932.46 Denver1710.0120.19190.36561.88 Assessment Metric Best substitute weather source
 Mean Yield Diff / n (t/ha) Total Yield Diff / n (t/ha) Absolute Diff / n (t/ha) Max Error (t/ha) InverbervieAberdeen Mylnefield Aviemore AuchencruiveEskdalemuir Dunstaffnage Aldergrove HazelriggCawood Eskdalemuir Sutton B’ton CawoodHazelrigg Sutton B’ton Denver Assessment Metric Best substitute weather source")
26
Impact on CropSyst output Best substitute weather data – not always the nearest neighbour –At 4 sites nearest substitute provided best fit for metrics –At 2 sites second nearest substitute provided best fit for metrics –At 3 sites third nearest substitute provided best fit for metrics –Remaining sites had a range of best fitting substitutes per metric Substitute data will introduce a minimum error of approx +/- 0.4 t/ha Smallest maximum error was 0.33 t/ha –Between Aberdeen and Inverbervie (32 km apart) Mean maximum error was 1.90 t/ha Results
 Mean maximum error was 1.90 t/ha Results")
27
SiteSubstitute Distance (km) Absolute diff / n (t/ha) AberdeenInverbervie320.189 AldergroveAuchencruive1400.342 DenverBrooms Barn400.354 CawoodDenver1710.366 DenverRothamstead1030.403 Loch GlasAviemore860.413 AldergroveDunstaffnage2060.413 Brooms BarnRothamstead810.429 AltnaharraLoch Glas680.436 BracknellWallingford330.447 Mean0.379 Substitute sites providing the ten lowest absolute differences / n in yield (t/ha).
 Absolute diff / n (t/ha) AberdeenInverbervie AldergroveAuchencruive DenverBrooms Barn CawoodDenver DenverRothamstead Loch GlasAviemore AldergroveDunstaffnage Brooms BarnRothamstead AltnaharraLoch Glas BracknellWallingford Mean0.379 Substitute sites providing the ten lowest absolute differences / n in yield (t/ha).")
28
Conclusions Spatial dissimilarity in solar radiation Clear trend of increasing dissimilarity of solar radiation with distance BUT –Sufficient variation to exclude assumption that the nearest substitute will provide the best alternative –Rate of dissimilarity increase is a function of: Met station network density Geographical location Distance threshold of when to use alternative (non- observed) data source varies with location
 data source varies with location")
29
Locations in dense Met station network of geographically similar characteristics can use a higher distance threshold Locations in low density Met station network with diverse geographical characteristics need a low distance threshold Isolated locations should use an alternative method, i.e. calculated solar radiation

30
Conclusions Impact on model output Highly complex relationship between distance to substitute data source and model output Best substitute may be beyond nearest or even second nearest Met Station Choice of substitute has different impacts on model output, depending on which assessment metrics are used Substitute data can have a substantial impact on model output Impact needs to be quantified to enable appropriate model output interpretation

31
Thank you for your attention website: www.macaulay.ac.uk/LADSS

Similar presentations


 Surface Meteorological Stations and Data Quality Control Procedures.>")


