Download presentation
Presentation is loading. Please wait.

1
Evaluation of the Togo National Integrated Child Health Campaign

3
Global Burden of Malaria 300-500 million cases occur annually 700,000-2.7 million deaths annually, > 75% in African children 41% of the world’s population lives in areas where malaria is transmitted

4
Millennium Development Goals Address health, poverty, education, gender inequalities, environmental sustainability and development Include reducing infant and child mortality by half between 1990-2015

5
Roll Back Malaria (RBM) Goals: To halve malaria mortality by 2010 and again by 2015 The Abuja targets: At least 60% children under five years of age under an ITN the previous night At least 60% of pregnant women under an ITN the previous night
 Goals: To halve malaria mortality by 2010 and again by 2015 The Abuja targets: At least 60% children under five years of age under an ITN the previous night At least 60% of pregnant women under an ITN the previous night")
6
Presidential Malaria Initiative Building on the Abuja Targets 15 countries targeted with pop 175 million 85% coverage with select malaria control and prevention interventions Reduction in malaria-related deaths by 50% 1.2 billion USD

7
Strategies for Control and Prevention of Malaria Prompt diagnosis and treatment Intermittent presumptive treatment in pregnant women Insecticide-treated bed nets (ITNs) Indoor-residual spraying Larval control
 Indoor-residual spraying Larval control")
8
Effectiveness of ITNs Western Kenya Insecticide Treated Bed Nets Trial Reduction in overall childhood mortality by 20% Averted 1 in 4 infant deaths in areas of intense transmission A protective effect on compounds lacking ITNs located within 300 meters of compounds with ITNs for child mortality, moderate anemia, high-density parasitemia, and hemoglobin levels.

9
Strategies to Increase Coverage Largely social marketing in the past High coverage not achieved Highest concentration in urban areas and among wealthiest

10
Strategies to Increase Coverage Linked to routine health services Extended Program on Immunizations Antenatal Clinics

11
Strategies to Increase Coverage Free distribution linked to an immunization campaign Ghana (2002) and Zambia (2003): first district-level distributions Achieved high and equitable coverage Approached or exceeded Abuja targets for use Togo (2004): first national-level distributions
 and Zambia (2003): first district-level distributions Achieved high and equitable coverage Approached or exceeded Abuja targets for use Togo (2004): first national-level distributions")
12
Togo

13
Togo National Integrated Child Health Campaign Measles vaccination Polio vaccination Presumptive treatment with anti-helminth Long-lasting insecticide-treated bed net (LLITN)
")
14
Togo National Integrated Child Health Campaign December 13-19, 2004 Objective: achieve > 95% coverage of the 866,725 children between 9-59 months with the four interventions Over 930,000 ITNs distributed Approximate total cost for all interventions USD $6.92

15
Campaign Targets & Resources 870,000 children ages 9-59 months (measles & polio vaccines, mebendazole) 735,000 households with children ages 9-59 months for ITNs 905,000 LLITNS available (RC and GFATM) 1,340 fixed, outreach, mobile posts 20,000 health workers & volunteers.
 735,000 households with children ages 9-59 months for ITNs 905,000 LLITNS available (RC and GFATM) 1,340 fixed, outreach, mobile posts 20,000 health workers & volunteers.")
16
Multidisciplinary Evaluation of the Campaign Pre- and post-campaign morbidity surveys: anemia, peripheral parasitemia, clinical malaria 1-month (low transmission season) and 9-month (high transmission season) coverage surveys Cost-effectiveness evaluation Social mobilization evaluation
 and 9-month (high transmission season) coverage surveys Cost-effectiveness evaluation Social mobilization evaluation")
17
Timeline of Evaluation September 2004: 1st morbidity survey December 2004: Campaign January 2005: 1st coverage survey September 2005: 2nd coverage survey 2nd morbidity survey

18
One-month Coverage Survey September 2004: 1st morbidity survey December 2004: Campaign January 2005: 1st coverage survey September 2005: 2nd coverage survey 2nd morbidity survey

19
Study site All six regions of the country Lome Maritime Plateau Central Kara Savannes Urban and rural communities Two districts per region

20
Study design and sample size Community-based cross-sectional survey Stratified two-stage cluster sample design District-level sample size Estimated rise in ITN coverage from 15% to 65% 80% power to estimate the proportion of households (HHs) that received an ITN with a range of 4% with 95% confidence Assuming 70% of HHs to have children<5yo, 10% of HHs to own and ITN, and 10% non-response rate
 that received an ITN with a range of 4% with 95% confidence Assuming 70% of HHs to have children<5yo, 10% of HHs to own and ITN, and 10% non-response rate")
21
Study design and sample size Stratified two-stage cluster sample design Selection of Enumeration Areas (EAs) 12 per district for total of 144 1998 census provided the sampling frame with defined EAs with populations between 452 and 1440 Selected using probability proportional to size methodology 16 HHs selected within each EA regardless of presence of children to participate (+5 alternates)
 12 per district for total of 144 1998 census provided the sampling frame with defined EAs with populations between 452 and 1440 Selected using probability proportional to size methodology 16 HHs selected within each EA regardless of presence of children to participate (+5 alternates)")
22
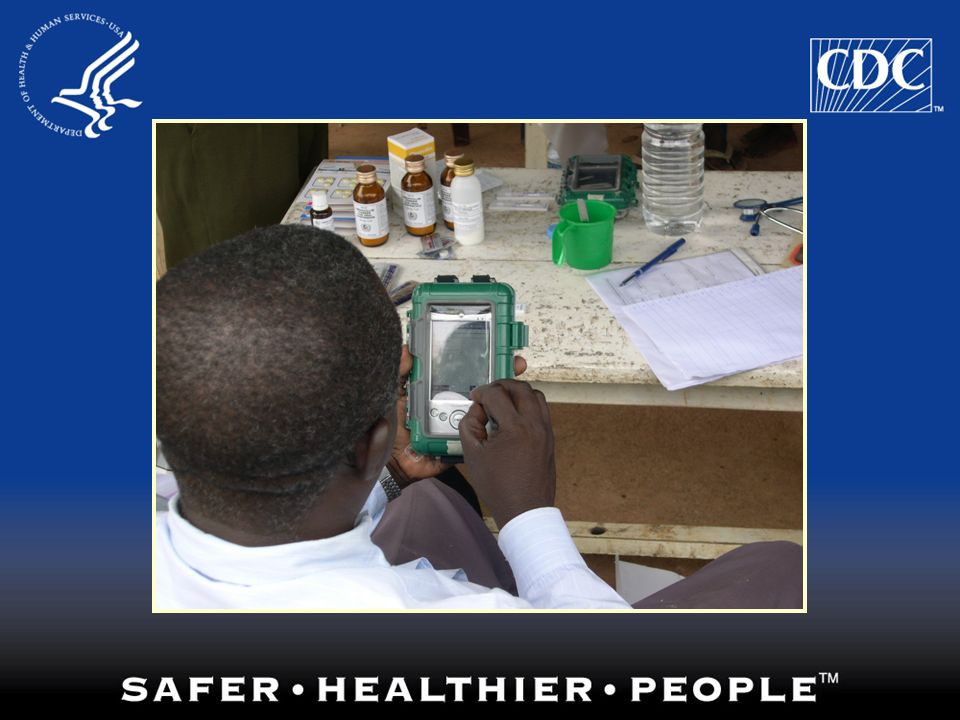
Study Procedures All six regions surveyed in 12 working days One team mapped 2 EAs per day Census-based maps provided EA borders Mapping performed with PDA’s equipped with GPS units Random selection of HHs selected in the field using survey specific program designed by CDC Selected HHs invited to participate that same day

23
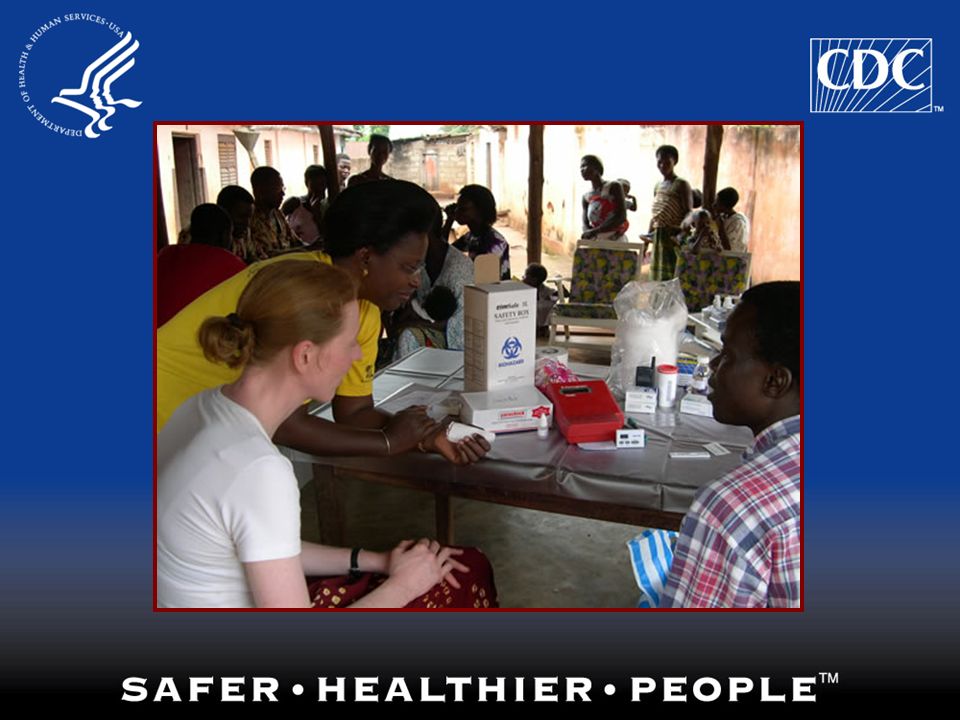
Methods (Anemia) 3 regions included 2 stage cluster survey Enumeration Area (30 per region) Simple random sample of EA GPS mapping (all houses in EA) PDA selection (25 Households invited per EA) PDA-based survey, clinical examination, lab evaluation
 3 regions included 2 stage cluster survey Enumeration Area (30 per region) Simple random sample of EA GPS mapping (all houses in EA) PDA selection (25 Households invited per EA) PDA-based survey, clinical examination, lab evaluation")
24
Enumeration Areas

25
Not Selected Selected Alternate Each Household Mapped

26
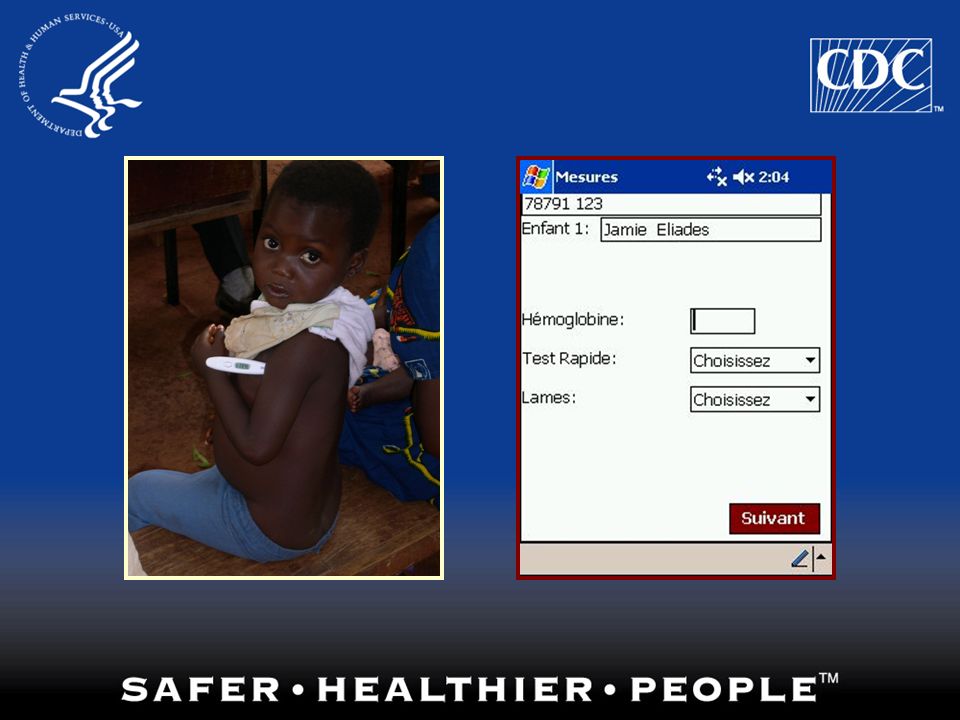
Study Procedures Questionnaire: all answers entered directly into database on PDAs while in the field (Visual CE) Household Campaign Children in the HH Bed nets in the HH Economic questions (World Bank)
 Household Campaign Children in the HH Bed nets in the HH Economic questions (World Bank)")
27
Study Procedures Questionnaire shot

28
Analysis All data downloaded from PDAs into a central database at the end of the survey (Microsoft Access) Analysis performed using SAS (version 9.1)
 Analysis performed using SAS (version 9.1)")
29
Study procedures One team mapped all households in two EAs each day using PDA with GPS PIC OF BOTH

30
N EW S Enumeration Areas Coverage Survey Anemia Survey

31
PercentageRangeConfidence Intervals HHs with an ITN hanging HHs with a child < 5 sleeping under any net HHs with a child < 5 sleeping under an ITN Pregnant women sleeping under an ITN

32
Results Coverage of all services

33
Results Graph of coverage of all services

34
Results Itn coverage and equity One or two slides? Just graph or test too?

35
Ownership of an ITN by economic quintile before and after the campaign

37
Results ITN use Table of all figures in paper

38
Advantages Data quality procedures such as skip patterns and validity checks included Ability to rapidly aggregate data, perform additional data checks and preliminary analysis Presenting preliminary results Rapidly map entire EA Use geospatial information in reports and analyses Statistically valid

39
Follow-up: Pre- and Post- campaign Morbidity Surveys Performed in September of 2004 and 2005 in the same three districts (high transmission season) Hemoglobin levels, peripheral parasitemia, clinical malaria Similar rainfall pattern significant post-campaign reductions of the prevalence of multiple anaemia and malaria markers in the pooled group of children under 5 years in 2 out of the 3 evaluated districts
 Hemoglobin levels, peripheral parasitemia, clinical malaria Similar rainfall pattern significant post-campaign reductions of the prevalence of multiple anaemia and malaria markers in the pooled group of children under 5 years in 2 out of the 3 evaluated districts")
40
Follow-up: 9-month Coverage Survey

41
History 2001 Measles Catch-up Campaign: 95% coverage (by survey). Synchronized West Africa campaigns: 2 rounds NIDs, 1 measles round. 2004 Follow-up Campaign: first nationwide integrated campaign. Integrated campaigns with measles and malaria Conducted in selected districts of two countries Ghana (1 district 2002) Zambia (5 districts 2003) Scale-up to national level Togo (26 districts 2004)
 Zambia (5 districts 2003) Scale-up to national level Togo (26 districts 2004).")
42
Ministries of Health National Societies Partnerships

43
Campaign Costs USD $6.75 per child for all 4 interventions. USD $0.78 per child vaccinated for measles. Gov’t contribution: CFA 10m ($20,500) Cold chain: $500,000 (Rotary, GAVI, UNICEF) CIDA: Measles Initiative: Other:
 Cold chain: $500,000 (Rotary, GAVI, UNICEF) CIDA: Measles Initiative: Other:.")
44
Social Mobilization Greater than 7,400 Red Cross volunteers trained, monitored, and engaged 5,000 TRC volunteers received ITNs 2 weeks before the campaign, demonstrated use

45
What worked well? Smooth post organization (improved with supervision. Good injection technique, cold chain. Adverse Events Following Immunization (AEFI) surveillance: 25 minor, none severe. High motivation for bednets.
 surveillance: 25 minor, none severe. High motivation for bednets..")
46
What was a challenge? Lack consensus on denominator. Target age groups. Mebendazole problems. Late arrival funds at operational level. Partner coordination in field (RC, MOH, WHO). Targets for ITN (per child vs. per household)
. Targets for ITN (per child vs. per household).")
47
Task Assist Togolese Ministry of Health (MOH) and Togolese Red Cross in community-based coverage survey Assist partners in assessing anemia levels in children less than 5 years old Assist MOH in assessing ITN retention and utilization Gather data and report results as quickly as possible (Days, not months)
 and Togolese Red Cross in community-based coverage survey Assist partners in assessing anemia levels in children less than 5 years old Assist MOH in assessing ITN retention and utilization Gather data and report results as quickly as possible (Days, not months)")
48
Evaluation Local supervisors, external monitors for campaign Anemia surveys pre- and post-campaign Pre-campaign survey completed September 2004 Post-campaign survey planned for September 2005 Coverage surveys 1 month (all interventions) and 6 months post-campaign (Bednets) 1 month survey completed February 2005 6 month survey planned for June 2005 Facility-based mortality study - ongoing Economic/ cost effectiveness evaluation - ongoing
 and 6 months post-campaign (Bednets) 1 month survey completed February 2005 6 month survey planned for June 2005 Facility-based mortality study - ongoing Economic/ cost effectiveness evaluation - ongoing")
49
Logistics of Evaluation Two groups of 6 teams GPS (Advance team) Evaluation Daily data synchronization Daily supply restocking
 Evaluation Daily data synchronization Daily supply restocking")
50
Logistics Battery Charging Checking Data Workload Management

51
Training Supervisors - 6 GPS staff - 12 Field staff - 24/district 2 interviewers/team 1 laboratorian/team 1 clinician/team

52
Multiple Stations with Multiple Children Each PDA can record data for each child <5 in a household Mother takes PDA from station to station Data is entered by trained staff

56
Preliminary Results Anemia Survey

57
Denominators 1924 households 2677 children (all <5s)
")
58
Indicators Rapid Diagnostic Test for P. faliciparum 74% positive (n=2642) Hemoglobin levels (n=2677) Severe (<5) 0.75% Moderate(5-7.9) 20% Mild(8-10.9) 63% Normal (>=11) 16%
 Hemoglobin levels (n=2677) Severe (<5) 0.75% Moderate(5-7.9) 20% Mild(8-10.9) 63% Normal (>=11) 16%.")
59
Indicators (2) Houses owning at least one bed net (any type) 10% (n=1924) Houses with at least one bed net hanging (any type) 8% (n=1924)
 Houses owning at least one bed net (any type) 10% (n=1924) Houses with at least one bed net hanging (any type) 8% (n=1924)")
60
Methods (Coverage) All 6 regions included 2 stage cluster survey District (2 per Region) Enumeration Area (12 per District) Simple random sample of EA GPS mapping (all houses in EA) PDA selection (16 Households per EA) PDA-based survey
 All 6 regions included 2 stage cluster survey District (2 per Region) Enumeration Area (12 per District) Simple random sample of EA GPS mapping (all houses in EA) PDA selection (16 Households per EA) PDA-based survey")
61
Logistics of Evaluation Six teams Supervisor 3 Interviewers Daily data backup Recharging PDAs

62
Preliminary Results Coverage Survey

63
Denominators 2254 households 2599 children (all <5s) 2469 total nets 2194 ITNs 1611 households with at least one ITN
 2469 total nets 2194 ITNs 1611 households with at least one ITN")
64
What was the Draw?

65
Households With At Least One Child Less Than 5 Years Old 77.23%

66
Campaign Attendance 97.1% of eligible children attended the campaign

67
Oral Polio Vaccine National Coverage Estimates Before Campaign: 93.37% Of those who attended the Campaign: 98.56%

68
55% verified by immunization card Eligible Children Receiving Polio Vaccine 67% verified by campaign card

69
Measles Vaccine National Coverage Estimates Before Campaign: 80.81% Of those who attended the Campaign: 97.88% Campaign Administrative coverage: 100.4% EPI cluster survey: 98.4%

70
57% verified by immunization card Eligible Children Receiving Measles Vaccine 67% verified by campaign card

71
Mebendazole National Coverage Estimates Of those who attended the Campaign: 97.12% Noticed Worms Exiting: 3.88%

72
Eligible Children Receiving Mebendazole 68% verified by campaign card

73
Eligible Children Who Received an ITN from the Campaign National Coverage Estimates Of those who attended the Campaign: 94.87% Households with at Least One Eligible Child: 97.82%

74
Eligible Children and Households Receiving ITNs

75
% of Campaign Eligible Children Under a Campaign Net the Previous Night 94.94%

76
Equity in ITN Ownership

77
ITN Ownership (All Households) National Coverage Estimates Not From Campaign: 5.90% After Campaign: 62.43%
 National Coverage Estimates Not From Campaign: 5.90% After Campaign: 62.43%")
78
Household ITN Ownership

79
Households ITN Ownership by Wealth Quintile

80
ITNs (All Households) Hanging: 36.2% Retention among HH that received at least one ITN: 90%
 Hanging: 36.2% Retention among HH that received at least one ITN: 90%")
81
RBM Indicators

82
Under ITNs National Coverage Estimates Children Less Than 5 Years Under an ITN Previous Night: 59.98% Pregnant Women Under an ITN Previous Night: 35.8%

83
% All Children Less Than 5 Years and Bednets

84
Summary of Campaign

Similar presentations