Download presentation
Presentation is loading. Please wait.

1
Spectrophotometry Lecture

3
Interaction of Radiation and Matter

6
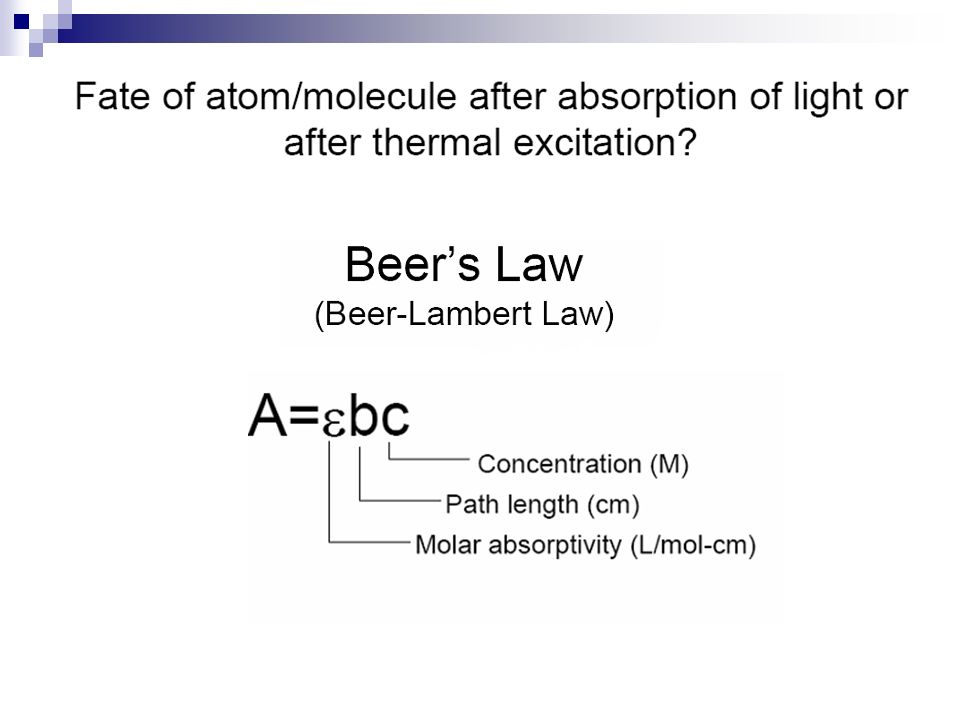
Absorption and Fluorescence

7
Terms

8
Interaction of Light with Matter

10
Molecules Absorption Wavelengths

11
Spectrophotometry Although a number of different types of spectrophotometers exist all have one thing in common. Utilize light energy to detect molecules in a solution Light energy is reported to the user as wavelengths in nanometers (nm) Different spec’s utilize wavelengths that fall into different ranges. Visible (VIS) 350-700 nm Ultraviolet (UV) 200-350 nm
 Different spec’s utilize wavelengths that fall into different ranges. Visible (VIS) nm Ultraviolet (UV) nm.")
12
Absorption Spectrophotometer

13
Spectrophotometer

14
spectrophotometer measures intensity of a light beam after it is directed through and emerges from a solution Ex: solution of copper sulfate (CuSO4) absorbs light The red part of spectrum has been almost complete absorbed by CuSO4 and blue light has been transmitted Gain greater sensitivity by directing red light through the solution because CuSO4 absorbs strongest at the red end of the visible spectrum But to do this, we have to isolate the red wavelengths
 absorbs light The red part of spectrum has been almost complete absorbed by CuSO4 and blue light has been transmitted Gain greater sensitivity by directing red light through the solution because CuSO4 absorbs strongest at the red end of the visible spectrum But to do this, we have to isolate the red wavelengths")
15
Spectrum of visible light How do you isolate red wavelengths of light? In a spectrophotometer, a light source gives off white light which strikes a prism, separating light into its component wavelengths: Red wavelengths pass through CuSO4 solution and measure amount of red light absorbed Colored compounds absorb light differently depending on the l of incident light l = Wavelength, nm=nanometers

16
Design of Spectrophotometer THE BLANK In order to effectively use a spectrophotometer we must first zero the machine Blank contains everything except compound of interest which absorbs light. By zeroing machine using "the blank," any measured absorbance is due to the presence of solute of interest ABSORPTION SPECTRUM Different compounds having dissimilar atomic and molecular interactions have characteristic absorption phenomena and absorption spectra which differ The point (wavelength) at which any given solute exhibits maximum absorption of light (the peaks on the curves on the figure below) is defined as that compounds particular lmax
 at which any given solute exhibits maximum absorption of light (the peaks on the curves on the figure below) is defined as that compounds particular lmax.")
17
Design of Spectrophotometer

18
Electromagnetic Spectrum

19
How is Does a Spectrophotometer Work? Amount of a particular molecule of interest is measured according to amount of light that is absorbed Absorbance data is compared to a standard of a known concentration to determine the concentration of the unknown.

20
How is Does a Spectrophotometer Work? All spec’s share following common features: Lamp i.e. tungsten or deuterium Prism or grating Sample holder Display

21
Absorption Spectrophotometer

22
Absorption Curve

23
Background, B

24
Detection Limit DL or LOD

25
Dynamic or linear range

26
Sensitivity

27
Calibration Curve

28
Calibration Curve Procedures

29
Calibration Curve Plot

30
Example Nitrite Analysis

31
Results

32
Plot of Results

33
Best Fit Line

34
How are Concentrations Obtained Using a Spec? More molec…more to absorb light Note peaks of absorption curves Lambda max Wavelength at which a molecule absorbs the most light Proteins, like other molecules, interact with certain wavelengths of light Proteins absorption spectrum can be determined by measuring proteins light absorbance at different wavelengths. Determine the lambda max for protein

35
How are Concentrations Obtained Using a Spec? Most proteins are colorless Light in visible range will not work Light in UV range will work for a colorless solution ~280 nm Does NOT distinguish between different protein types in a solution

36
Using Bradford Reagent Way to colorize proteins and use white light spectroscopy Solution changes from brown to blue when proteins present. Degree of “blueness” of Bradford-protein mixture can be used to determine concentration of protein in a solution

37
How are Concentrations Obtained Using a Spec? Calculating protein concentration in an unknown sample Known standards are mixed with Bradford reagent and their absorbance values are determined Standard curve generated. known absorbance values can be plotted and concentrations determined

38
This project is funded by a grant awarded under the President’s Community Based Job Training Grant as implemented by the U.S. Department of Labor’s Employment and Training Administration (CB-15-162-06-60). NCC is an equal opportunity employer and does not discriminate on the following basis: against any individual in the United States, on the basis of race, color, religion, sex, national origin, age disability, political affiliation or belief; and against any beneficiary of programs financially assisted under Title I of the Workforce Investment Act of 1998 (WIA), on the basis of the beneficiary’s citizenship/status as a lawfully admitted immigrant authorized to work in the United States, or his or her participation in any WIA Title I-financially assisted program or activity. “This workforce solution was funded by a grant awarded under the President’s Community-Based Job Training Grants as implemented by the U.S. Department of Labor’s Employment and Training Administration. The solution was created by the grantee and does not necessarily reflect the official position of the U.S. Department of Labor. The Department of Labor makes no guarantees, warranties, or assurances of any kind, express or implied, with respect to such information, including any information on linked sites and including, but not limited to, accuracy of the information or its completeness, timeliness, usefulness, adequacy, continued availability, or ownership. This solution is copyrighted by the institution that created it. Internal use by an organization and/or personal use by an individual for non-commercial purposes is permissible. All other uses require the prior authorization of the copyright owner.”
. NCC is an equal opportunity employer and does not discriminate on the following basis: against any individual in the United States, on the basis of race, color, religion, sex, national origin, age disability, political affiliation or belief; and against any beneficiary of programs financially assisted under Title I of the Workforce Investment Act of 1998 (WIA), on the basis of the beneficiary’s citizenship/status as a lawfully admitted immigrant authorized to work in the United States, or his or her participation in any WIA Title I-financially assisted program or activity. This workforce solution was funded by a grant awarded under the President’s Community-Based Job Training Grants as implemented by the U.S. Department of Labor’s Employment and Training Administration. The solution was created by the grantee and does not necessarily reflect the official position of the U.S. Department of Labor. The Department of Labor makes no guarantees, warranties, or assurances of any kind, express or implied, with respect to such information, including any information on linked sites and including, but not limited to, accuracy of the information or its completeness, timeliness, usefulness, adequacy, continued availability, or ownership. This solution is copyrighted by the institution that created it. Internal use by an organization and/or personal use by an individual for non-commercial purposes is permissible. All other uses require the prior authorization of the copyright owner. .")
Similar presentations


 as implemented by the U.S. Department.>")


 Purification by Chromatography>")


