Download presentation
Presentation is loading. Please wait.

1
Performance Dash A free tool from Microsoft that provides some quick real time information about the status of your SQL Servers.

2
Getting started with Performance Dashboard Reports SQL Server Performance Dashboard Reports are custom reports made to make performance monitoring easier. These are ready to use reports and SQL Server Reporting Services doesn’t have to be installed on the SQL Server where you will use them. See more at: http://www.sqlshack.com/performance- dashboard-reports-sql-server- 2014/#sthash.QJG8eqYt.dpuf SQL Server Management Studio provides a set of standard reports that show basic performance information. These reports are available out of the box, no previous installation and configuration is needed. There are more than 20 reports that show usually required monitoring and troubleshooting information at the SQL Server instance level. As these reports don’t provide enough information for SQL Server performance monitoring and troubleshooting, Microsoft has created a set of performance dashboard reports that provide more insight into what’s going on with your SQL Server. Although there are still no Performance Dashboard Reports for SQL Server 2014, we used the reports for SQL Server 2012 and tested them on SQL Server 2014. - See more at: http://www.sqlshack.com/performance- dashboard-reports-sql-server- 2014/#sthash.QJG8eqYt.dpuf

3
Installation of Performance Dashboard 1.Download the installer here: Microsoft SQL Server 20132 Performance Dashboard Reports.Microsoft SQL Server 20132 Performance Dashboard Reports 2. Start the installer and follow the steps and instructions. By default, the setup unpacks the files into C:\Program Files (x86)\Microsoft SQL Server\110\Tools\Performance Dashboard. Besides the reports (.rdl files), this folder also contains a chm help file, read me file that is actually a step by step guide on what to do next, and the setup.sql file that should be used in the next step. 3.To be able to use the reports, Performance Dashboard Reports functions and stored procedures have to be installed on every SQL Server instance you want to monitor. To do that, open the setup.sql file and execute it against the SQL Server instance using SQL Server Management Studio, or any other integrated developer environment. The script creates one table and multiple stored procedures, table valued, and scalar valued functions in the in msdb database. All created objects are in the MS_PerfDashboard schema. 4.Repeat step 3 against all SQL Server instances you will monitor - See more at: http://www.sqlshack.com/performance-dashboard-reports-sql-server- 2014/#sthash.QJG8eqYt.dpuf
\Microsoft SQL Server\110\Tools\Performance Dashboard. Besides the reports (.rdl files), this folder also contains a chm help file, read me file that is actually a step by step guide on what to do next, and the setup.sql file that should be used in the next step. 3.To be able to use the reports, Performance Dashboard Reports functions and stored procedures have to be installed on every SQL Server instance you want to monitor. To do that, open the setup.sql file and execute it against the SQL Server instance using SQL Server Management Studio, or any other integrated developer environment. The script creates one table and multiple stored procedures, table valued, and scalar valued functions in the in msdb database. All created objects are in the MS_PerfDashboard schema. 4.Repeat step 3 against all SQL Server instances you will monitor - See more at: /#sthash.QJG8eqYt.dpuf.")
4
How to use the reports 1. In Object Explorer, right-click the SQL Server instance 2.Select Reports – Custom Reports

5
How to interpret the reports 3.The Open File dialog shows the folder where the Performance Dashboard Reports installer was unpacked. Only the reports (*.rdl) files are shown. 4.Select the performance _dashboard_main.rdl file. 5.If you get the Run Custom Report warning, click Run as the reports come from an trustworthy source (ie..Microsoft) and there’s no threat.
 files are shown. 4.Select the performance _dashboard_main.rdl file. 5.If you get the Run Custom Report warning, click Run as the reports come from an trustworthy source (ie..Microsoft) and there’s no threat..")
6
Breaking down Performance dashboard If you haven’t disabled the Run Custom Report warnings, each time you click a link in the report, you will get the path and the name of the Performance Dashboard Report that will be opened, so you can match reports in the dashboard to the.rdl files in the Performance Dashboard folder, as their names aren’t always identical. For example, the Cache hit ratio for the User requests opens the wait_buffer_io.rdl report. Most of the information presented by performance dashboard utilize DMV’s behind the scenes.. The dashboard shows processor usage for the last 15 minutes, by both SQL Server and operating system, and basic information for current and historical activity. A recommended value for the processor usage is up to 80%. Peaks when some heavy processing is performed are acceptable. Occasional peaks without a known reason should be investigated. If the processor usage is constantly over 80%, consider deeper query, index, database design analysis, adding more hardware resources, or distributing load on other servers. To go back to the parent report, click the Navigate backward icon in the report menu (the first on the left), or press Ctrl and – on the keyboard. - See more at: http://www.sqlshack.com/performance- dashboard-reports-sql-server-2014/#sthash.QJG8eqYt.dpuf
, or press Ctrl and – on the keyboard. - See more at: dashboard-reports-sql-server-2014/#sthash.QJG8eqYt.dpuf.")
7
Buffer IO Waits The Buffer IO Waits report shows the ratio of pages read from buffer and total number of pages read. If the page is not read from buffer, it has to be read from disk, which degrades performance. The recommended value is higher than 95%. However, this metric can be misleading, as high values are shown even when performance suffers. Therefore, it’s recommended to use some other memory metrics, such as Page Life Expectancy, Page reads/sec, and Free Pages – See more at: http://www.sqlshack.com/performance-dashboard-reports- sql-server-2014/#sthash.QJG8eqYt.dpuf

8
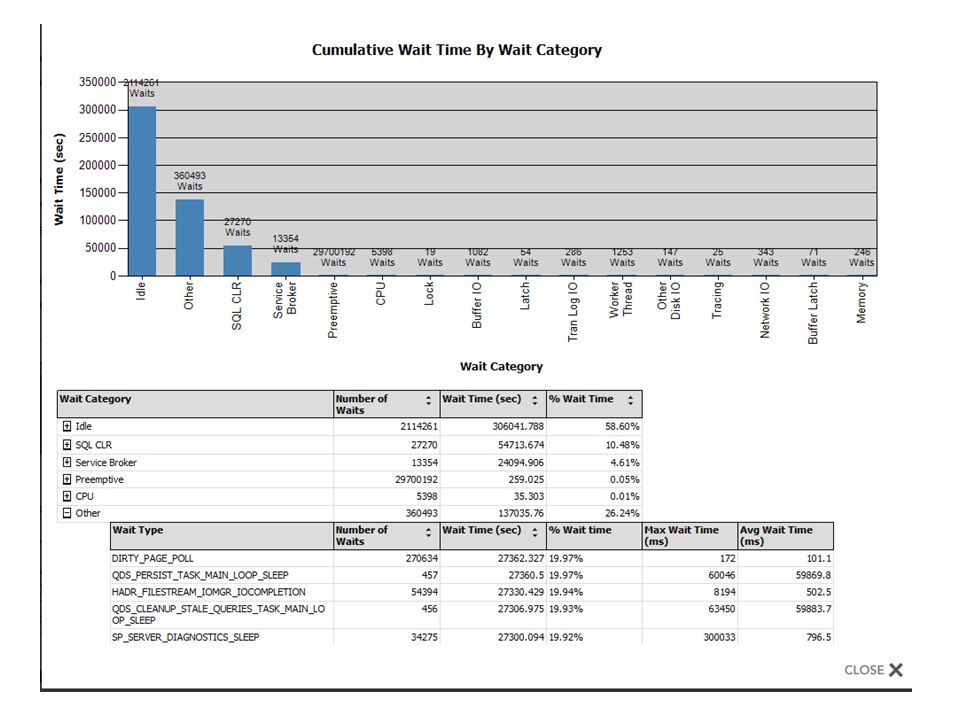
Waits Waits - The Waits report shows the information about the SQL Server processes waiting to be processed. The information is obtained from the sys.dm_os_wait_stats dynamic management view. SQL Server supports more than 200 wait types, but the report shows similar waits grouped into the same category with user-friendly category names. For example, all waits where the wait_type column has the value like LCK_M (LCK_M_SCH_S, LCK_M_SCH_M, LCK_M_S, etc.) are summed and shown as Lock waits in the report, all waits with the wait type like LATCH (LATCH_NL, LATCH_KP, LATCH_SH, etc. ) are shown as Latch, etc. You can find the conditions used for wait grouping in the MS_PerfDashboard.fn_WaitTypeCategory function. See more at: http://www.sqlshack.com/performance-dashboard-reports-sql-server- 2014/#sthash.QJG8eqYt.dpuf
 are summed and shown as Lock waits in the report, all waits with the wait type like LATCH (LATCH_NL, LATCH_KP, LATCH_SH, etc. ) are shown as Latch, etc. You can find the conditions used for wait grouping in the MS_PerfDashboard.fn_WaitTypeCategory function. See more at: /#sthash.QJG8eqYt.dpuf.")
10
.rdl files are located on your local machine under Program Files (x86).
.")
11
List of files located in Performance Dashboard Folder

12
How to open performance dashboard when userdb’s are at an older compatibility level than your Perf Dashboard version. 1.Right Click on a System Database (ie…Tempdb, MSDB). 2.Slide down your option list and choose Reports (ie… If the compatibility level of the user database. Note: (If the user database is an older compatibility level than the version of performance dashboard you have installed, the reports will be grayed out, in which case you can still open the report by running report on system database. This way you can still run perf dashboard on instance even if some or all of the user databases have an older compatibility level than the SQL Server instance.
. 2.Slide down your option list and choose Reports (ie… If the compatibility level of the user database. Note: (If the user database is an older compatibility level than the version of performance dashboard you have installed, the reports will be grayed out, in which case you can still open the report by running report on system database. This way you can still run perf dashboard on instance even if some or all of the user databases have an older compatibility level than the SQL Server instance..")
13
Demo: What you can get… and how to navigate from the main report.

14
Drill down by clicking on the Blue shaded CPU on the previous screen.

15
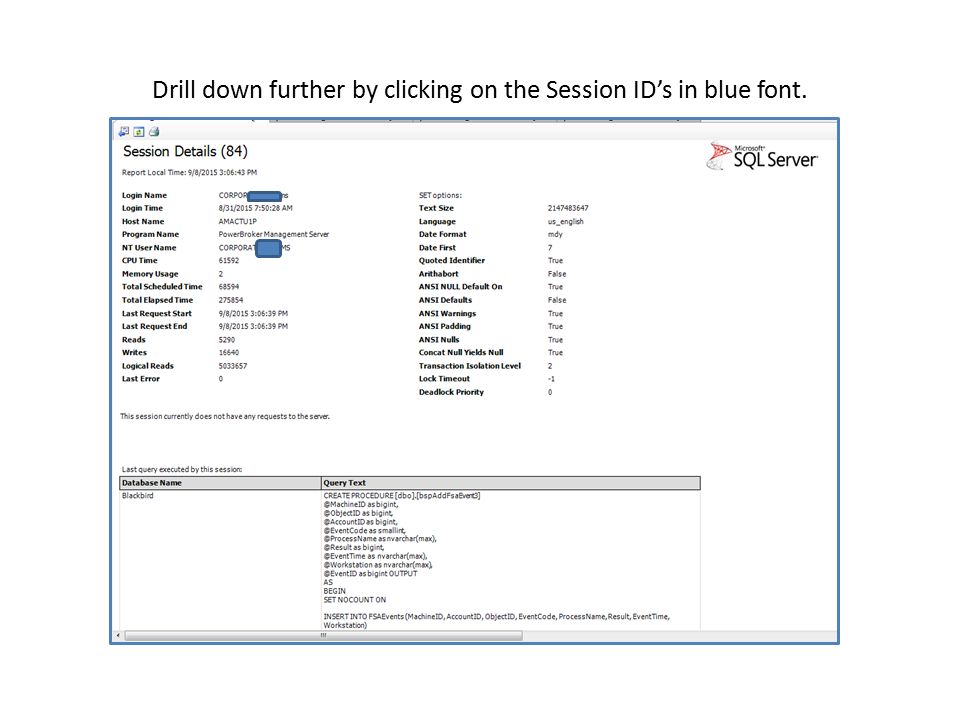
Drill down further by clicking on the Session ID’s in blue font.

17
Click on Databases for an Overview

18
Database Overview Provides basic database information quickly for all databases. Save the output to archive or email to someone Right click on the report and save as xls. or.pdf file.

19
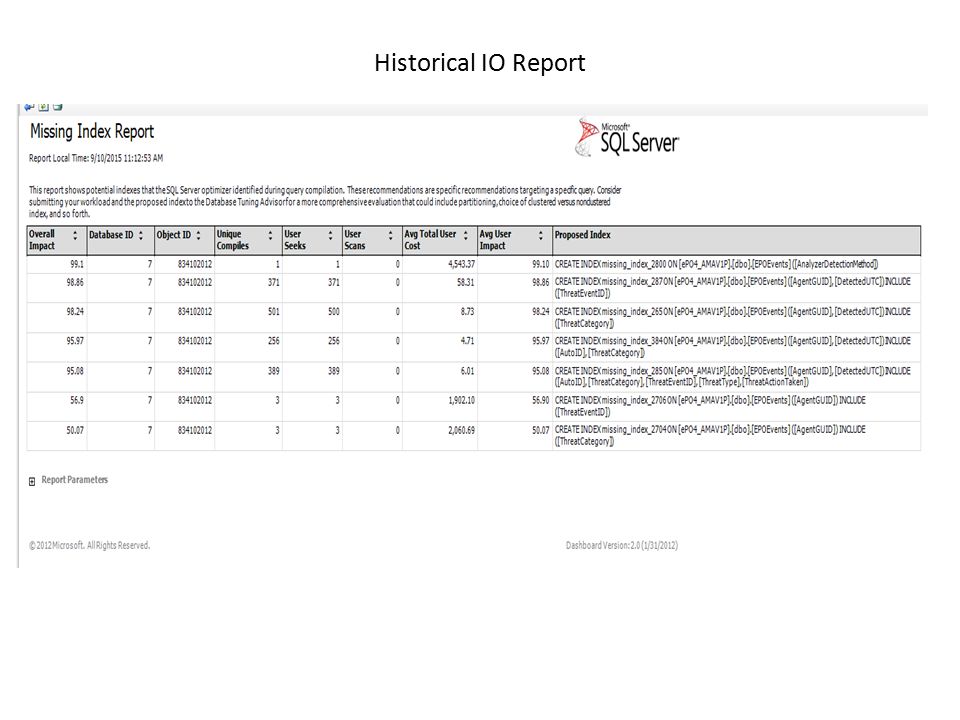
Missing Index Report Save the output to archive or email to someone Right click on the report and save as xls. or.pdf file. 1.Indexes are listed with highest impact at the top. 2.There may be several indexes the same or nearly the same. 3.The index names are cryptic, so you may want to change those names to fit your standard. 4.Save them as an excel or pdf file to send to your application team or third party vendor. 5.The indexes with high user seeks are good candidates to consider, but should compare to existing indexes too.

20
Expensive Queries A set of expensive query reports shows the information about 20 queries that use the most resources, grouped by different categories: processor time, duration, logical reads, physical reads, logical writes, and CLR time. The same rdl report, query_stats is used for all reports. The information in this report is obtained from sys.dm_exec_query_stats. Note that the view doesn’t contain the information about statements other than DML statements (INSERT, UPDATE, DELETE, and SELECT), therefore, some other resource intensive operations, such as creating a full database backup, are not shown in the report, making it potentially misleading. See more at: http://www.sqlshack.com/performance-dashboard-reports-sql-server-2014/#sthash.QJG8eqYt.dpufhttp://www.sqlshack.com/
, therefore, some other resource intensive operations, such as creating a full database backup, are not shown in the report, making it potentially misleading. See more at:")
21
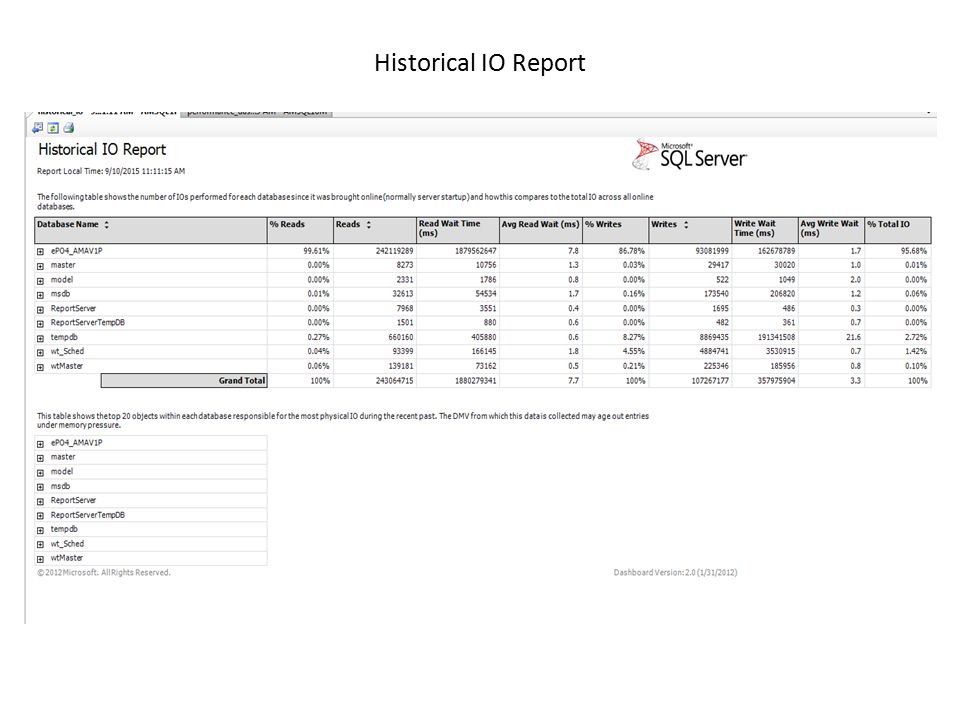
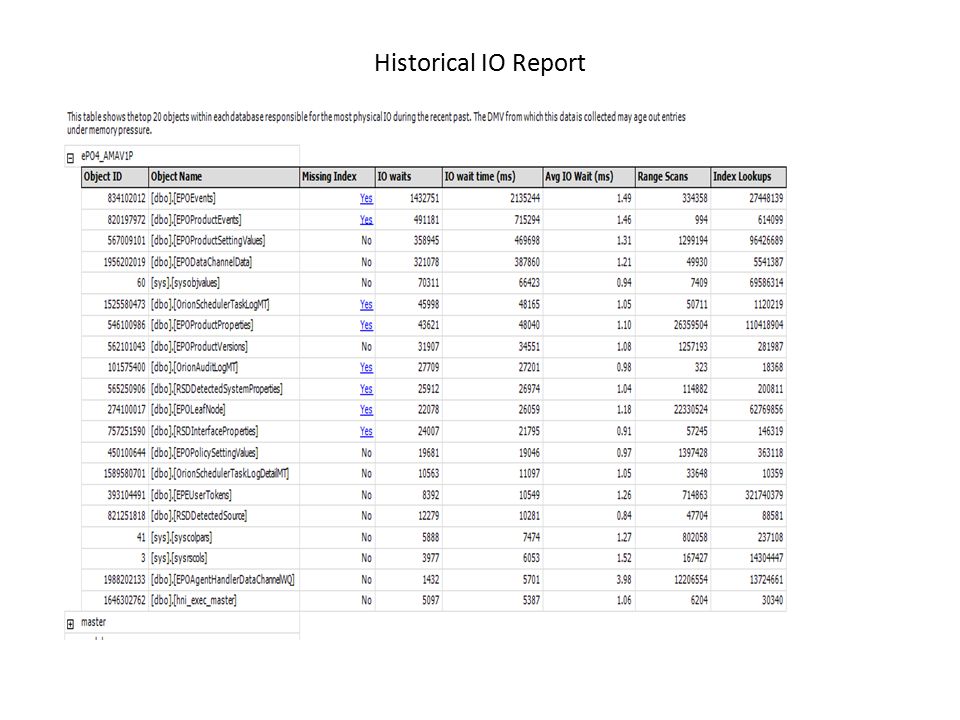
Historical IO Report

25
Bugs – Fixes As with many Microsoft products, this free tool from Microsoft has a couple bugs that you can run into with some default calculations that do not use data types or calcuations with real world columns sizes. If you hit these conditions, you get an error about columns size out of bounds. You just need to replace a couple default files with the fixes that have been provided. There really are only 2 fixes to consider.

26
SQL 2005 Bug Link - http://blogs.msdn.com/b/sachinp/archive/2008/08/11/sql-server-2005-performance-dashboard-difference-of- two-datetime-values-caused-an-overflow-at-runtime-error-message.aspx Descriptionhttp://blogs.msdn.com/b/sachinp/archive/2008/08/11/sql-server-2005-performance-dashboard-difference-of- two-datetime-values-caused-an-overflow-at-runtime-error-message.aspx

27
SQL 2005 Bug 2 Link - https://www.mssqltips.com/sqlservertip/2896/where-do-i-find-the-performance-dashboard-for-sql-server-2008/ Description

28
2012 - http://www.microsoft.com/en-us/download/details.aspx?id=29063 2012 - http://www.microsoft.com/en-us/download/details.aspx?id=29063 2005 - http://www.microsoft.com/en-us/download/details.aspx?id=22602 Download SQL Server Performance Dashboard

Similar presentations