Download presentation
Presentation is loading. Please wait.

1
Transit Impact Evaluation: Context Types: –Predictive (ex ante) vs. Evaluative (ex post) –Inter-modal vs. No-Build (counterfactual) Challenge: Attribution –Econometric: time series data with statistical controls –Quasi-experimental comparisons/matched pairs Economic Impacts: –Generative: travel time savings, employment growth –Distributive: land-use shifts, retail sales shifts Issues: –Accounting (financial) transfers: property tax income –Double-counting
 –Inter-modal vs. No-Build (counterfactual) Challenge: Attribution –Econometric: time series data with statistical controls –Quasi-experimental comparisons/matched pairs Economic Impacts: –Generative: travel time savings, employment growth –Distributive: land-use shifts, retail sales shifts Issues: –Accounting (financial) transfers: property tax income –Double-counting.")
2
Measuring Generative Benefits: Methods TCRP Report 35 Travel Demand Models: travel time savings with vs. without investment Econometric Models: REMI (increased economic outputs from industry-specific travel time savings) Land Market: Hedonic Price Model (premium) –P it = f (I, N, L) it ; I = Improvements; N = Neighborhood Attributes; L = Location Attributes –Captures Accessibility & Agglomeration Benefits –Measurement: Impact Zone (distance rings); Land Price Gradient; Aggregation Utility Choice Models: Compensating Variation estimates
 Land Market: Hedonic Price Model (premium) –P it = f (I, N, L) it ; I = Improvements; N = Neighborhood Attributes; L = Location Attributes –Captures Accessibility & Agglomeration Benefits –Measurement: Impact Zone (distance rings); Land Price Gradient; Aggregation Utility Choice Models: Compensating Variation estimates.")
3
Star-shaped, multi-centered metropolis Star-shaped, multi-centered metropolis Strong Core … “San Francisco as the Manhattan of the West” Strong Core … “San Francisco as the Manhattan of the West” The Vision: 1956 Plan BART @ 20 Study

4
1980 1990 BART: Spurred Decentralization & Strengthened the Core 1968 pre-BART) Employment Densities and BART Alignment (CTPP, Part II)
 Employment Densities and BART Alignment (CTPP, Part II)")
5
~ 30 million ft. sq. office- commercial floorspace added the 1 st 20 Years of BART Retained employment & retail primacy (vs. non-rail west-coast metro areas) Commercial-Office Growth Downtown San Francisco (TRW-REDI)
 Commercial-Office Growth Downtown San Francisco (TRW-REDI).")
6
Trend Comparisons Between BART & Non-BART Superdistricts: Population and Job Changes, 1970-1990 36 superdistricts Employment Impact Analyses: Shift-Share (CBP; FIRE Growth) Econometrics (CTPP; Occupation)
 Econometrics (CTPP; Occupation)")
7
Spurred Decentralization? Impacts outside of San Francisco 54.3 million

8
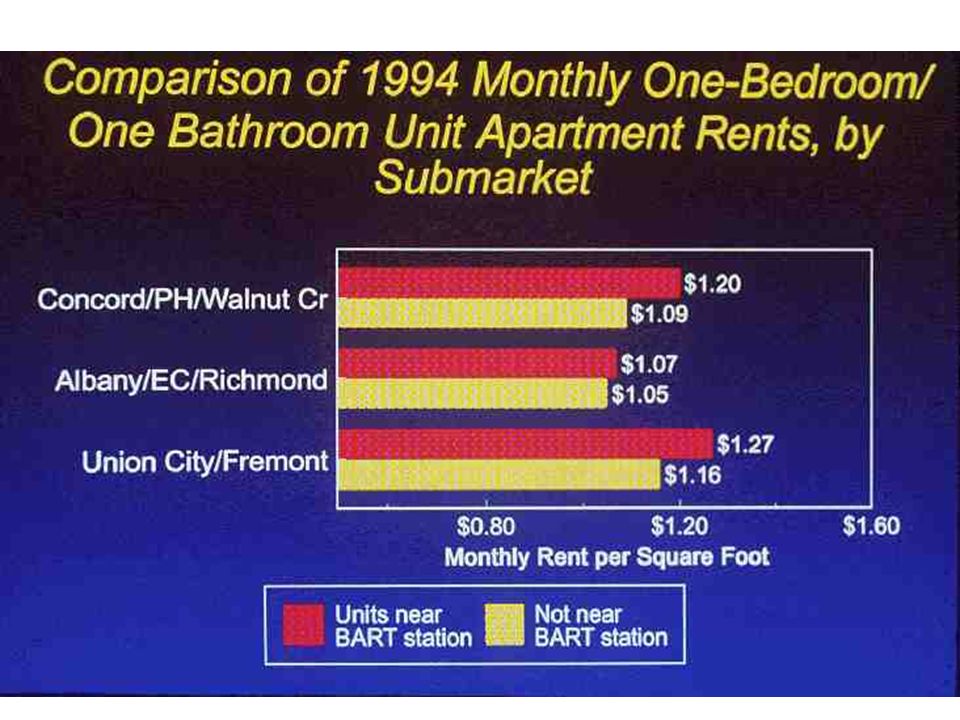
Walnut Creek

9
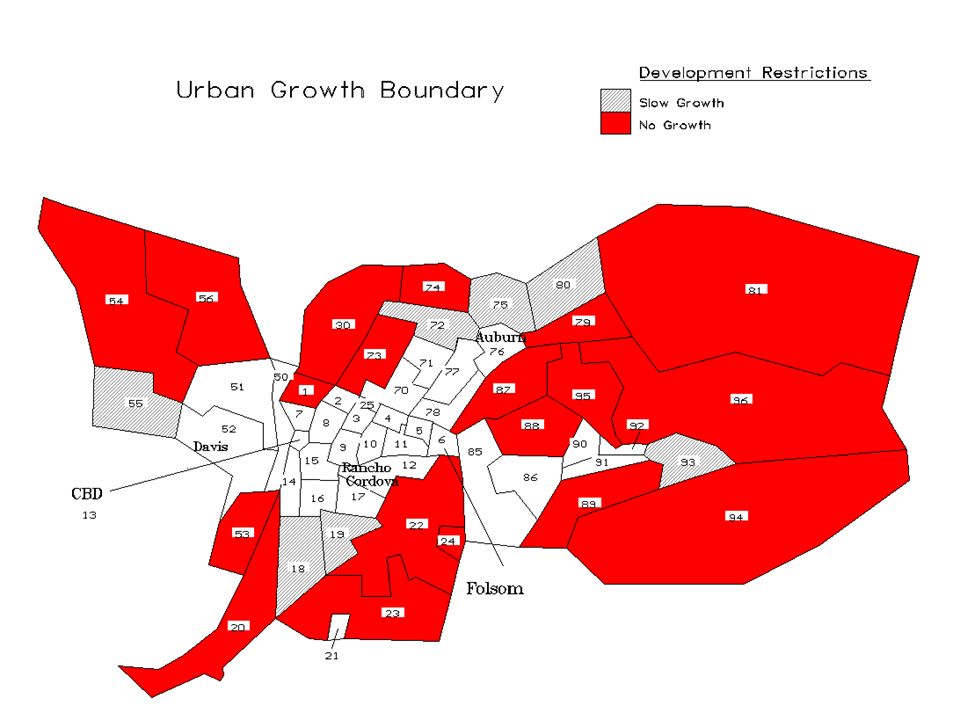
BART & Housing Markets 1-mile catchments: ~ 4,000 Demolitions = ~ 4,000 Additions Home Price Premium “Discrete Change” analysis showed BART induced housing growth for hectare grid-cells within 1 mile of stations (ABAG land-use & aerial-photo information) Nodal Comparisons: Stations vs. Freeway Interchanges

10
Sensitivity Test: Car Ownership Covariate 35% pt. higher prob.

12
BART & Redevelopment Can’t overcome weak local real estate markets Required huge subsidies … and even then, not automatic Oakland CBD

13
Highway and LRT Maps Estimating Benefit Using Compensating Variation C. Rodier & R. Johnston, Travel, Emissions, and Welfare Effects of TDM, TRR 1598, 1997.

15
Benefit Measure Compensating Variation (CV) Compensating Variation (CV) obtained from discrete choice models where is the individual's marginal utility of income, V m is the individual's indirect utility of all m choices, p 0 =before policy, and p f = after policy. From SACMET 94 Logit Models with Land use, Travel Time & Cost, and Household Variables:

16
Scenarios Consumer Welfare ($) Per Trip ($) LRT $120,000$ 0.02 Pricing/No Build $1.918 million$ 0.26 Super LRT & TOD* $2.362 million$ 0.32 * Shifted pop. & emp. from outer zones to 1 mi. radius of 45 LRT stations Estimated Year 2015 Impacts for Sacramento Region

17
HEDONIC PRICE MODELS Timing & Context Matter: Santa Clara LRT – 1996-2000: 4,500 Housing Units > 9 million > 9 million sq. ft. of commercial floorspace

18
Residential Analysis (OLS) Regional Job Accessibility (Highway): No. jobs within 30 min. peak-hour travel time on highway network Regional Job Accessibility (Transit): No. jobs within 15 min. peak-hour travel time on transit network Downtown San Jose: within with ½ mile (straight-line) of downtown San Jose Accessibility/Location Vector Effects on Land Values per Sq. Foot: +++
: No. jobs within 15 min. peak-hour travel time on transit network Downtown San Jose: within with ½ mile (straight-line) of downtown San Jose Accessibility/Location Vector Effects on Land Values per Sq. Foot: +++.")
19
Residential Analysis LRT & Large Apartments: within ¼ mile of LRT station and that are Apartment Complexes (5+ units) Commuter Rail: within ¼ straight-line mile of CalTrain station Freeway Proximity: Distance, in network miles, of parcel to nearest grade-separated freeway or highway interchange Freeway Dis-amenity: Proportion of parcels with ¼ straight-line mile of grade-separated freeway or highway interchange Rail/Highway Proximity Vector Effects on Land Values per Sq. Foot: ++--

20
Residential Analysis Single-Family Residential: Proportion of dwelling units within one-mile radius of parcel that are single-family Jobs-Housing Balance: 1 – {[ABS (ER - E)] / (ER + E)}, where: ER = employed-residents within 5 mile radius of parcel; E = employment within 5 mile radius of parcel Land-Use Mix: Normalized Entropy = { - k [ (p i ) (ln p i )]}/(ln k)}, where: p i = proportion of total land-use activities in category i for 1-mile radius of parcel (where land-use activities are defined in terms of numbers of: employed-residents in single-family housing; employed- residents in multi-family housing; employees in retail; employees in services; employees in manufacturing; employees in trade; employees in agriculture; and employees in other (including office sector); and k = 8 (number of land-use categories). Land Use, Zoning, Mix, & Balance Effects on Land Values per Sq. Foot: -++
![Residential Analysis Single-Family Residential: Proportion of dwelling units within one-mile radius of parcel that are single-family Jobs-Housing Balance: 1 – {[ABS (ER - E)] / (ER + E)}, where: ER = employed-residents within 5 mile radius of parcel; E = employment within 5 mile radius of parcel Land-Use Mix: Normalized Entropy = { - k [ (p i ) (ln p i )]}/(ln k)}, where: p i = proportion of total land-use activities in category i for 1-mile radius of parcel (where land-use activities are defined in terms of numbers of: employed-residents in single-family housing; employed- residents in multi-family housing; employees in retail; employees in services; employees in manufacturing; employees in trade; employees in agriculture; and employees in other (including office sector); and k = 8 (number of land-use categories).](http://images.slideplayer.com/25/7848665/slides/slide_20.jpg "Land Use, Zoning, Mix, & Balance Effects on Land Values per Sq. Foot: -++.")
21
Residential Analysis Land-Use Mix & Apartments: Land-Use Mix (Entropy) * Apartment Residential Use (1=yes; 0=no) Land-Use Mix & Condos: Land-Use Mix (Entropy) * Apartment Residential Use (1=yes; 0=no) Land Use, Zoning, Mix, & Balance Effects on Land Values per Sq. Foot: -+

22
Residential Analysis Racial Mix: Normalized Entropy = { - k [ (p i ) (ln p i )]}/(ln k)}, where: p i = proportion of total population in racial category i for 1- mile radius of parcel (where racial categories are: White; African American; Asian American; Other; and k = 4 (number of land-use categories). Household Income: Mean household income (in $1999) of households within one mile radius of parcel Housing Density: No. housing units per gross acre within one mile of parcel Others: School scores, crime rates Type of Property; Municipality Fixed Effects Neighborhood Attributes Effects on Land Values per Sq. Foot: -+ - Controls:
![Residential Analysis Racial Mix: Normalized Entropy = { - k [ (p i ) (ln p i )]}/(ln k)}, where: p i = proportion of total population in racial category i for 1- mile radius of parcel (where racial categories are: White; African American; Asian American; Other; and k = 4 (number of land-use categories).](http://images.slideplayer.com/25/7848665/slides/slide_22.jpg "Household Income: Mean household income (in $1999) of households within one mile radius of parcel Housing Density: No. housing units per gross acre within one mile of parcel Others: School scores, crime rates Type of Property; Municipality Fixed Effects Neighborhood Attributes Effects on Land Values per Sq. Foot: -+ - Controls:.")
23
Transit Proximity & Value-Added: Santa Clara Valley, 1998-2000 (24 % ) (103 % ) (28 % ) (17 % ) COMMERCIAL PARCELS RESIDENTIAL PARCELS Favorable Conditions: Boom economy More mature network Proactive policies
 (103 % ) (28 % ) (17 % ) COMMERCIAL PARCELS RESIDENTIAL PARCELS Favorable Conditions: Boom economy More mature network Proactive policies")
24
San Diego Rail Stations MF Housing Commercial SAN DIEGO TROLLEY & COASTER’s VALUE-ADDED 30.4 % 38.9 % 46.7 %

25
LA METRO Los Angeles Experiences Multi-Family Housing Premium/Discount

26
Housing Values, Travel Times, and Commuter Rail Stations: NJ Transport Cost HousingCost Travel time to Core Core Price, $ Housing & Transport Budget

Similar presentations


 Luděk Sýkora & Martin Ouředníček Charles University in Prague, Czechia SELMA meeting,>")


